Pressure Tuning: Increasing the Flexibility of Comprehensive Two-Dimensional Gas Chromatography
LCGC North America
Pressure tuning makes it easy to change the orthogonality in the 2D space.
Comprehensive two-dimensional gas chromatography (GC×GC) offers significant improvement for volatile chemical separation. Selecting suitable first (1D) and second dimension (2D) columns normally requires consideration of the chemical composition of a sample. Replacing one of these dimensions with a two-column ensemble (for example, 1D1 + 1D2 for the 1D column), provided with a pressure tuning makeup gas between them, varies the relative retentions of compounds before the modulation step, according to the junction pressure. This makes it possible to alter the apparent polarity of the 1D ensemble, and this alters peak positions in the 2D GC×GC space. This article presents an account of studies that suggest this offers potential for improved operation for a GC×GC laboratory.
The general objectives of newly introduced stationary phases are to perform separations that achieve an improved or alternative selectivity, which are usually not possible on other phases. Ionic liquids, metal organic frameworks, and nanomaterials are a number of newer gas chromatography phase materials to emerge in the literature (1–3). Another valid approach for adjusting selectivity is to use coupled columns. This is an attractive and easy option to alter separation selectivity, and was well studied during the 1980s and 1990s (4). Pressure tuning (PT) at the midpoint between two coupled columns, 1 and 2, of different phases is able to achieve an intermediate selectivity of the serially connected coupled columns, so that the overall result is neither that of column 1 nor of 2. By simply varying pressure, this approach is able to "tune," or adjust, the fractional contribution of each column to the overall separation (5,6). This process is able to alter the relative elution orders of different compounds, which corresponds to making the coupled column (column 1 + column 2) to be more polar or less polar in nature; in effect, it makes the coupled column more like column 1, or more like column 2. This is easily achieved online by simply adjusting the midpoint pressure. Sacks and coworkers were especially active in promoting the PT process, including various stop-flow methods, and multiple stages of PT during the gas chromatography (GC) analysis (7). It is possible that improved chromatographic selectivity (re)discovered by multidimensional and comprehensive two-dimensional (2D) chromatography platforms, and the increased dependence on and innovations in mass spectrometry (MS), led to PT losing favor (8).
Pressure tuning of a coupled column arrangement as the first dimension (1D) in GC×GC, termed PT-GC×GC, was recently proposed (see below). This innovation uses two first-dimension columns-1D1 and 1D2-with pressure tuning at their junction. This is followed by the modulator, which delivers analytes into the second dimension (2D) column. The idea of "tuning" the 2D in GC×GC has also been recently investigated by Gorecki's group, by using separately programmable temperature operation for the 2D column, the goal of which is also to alter relative separation (9). This article will evaluate the scope and role of the PT-GC×GC process, discuss if it provides useful and controllable manipulation of compounds in the 2D separation, and the perspectives it could provide for practical application.
Selectivity Changes by Pressure Tuning
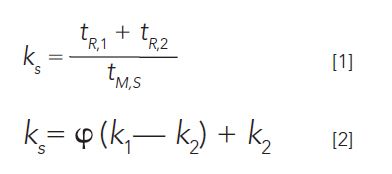
In a typical coupled-column one-dimensional (1D) system with two different stationary phases, two columns are serially connected by, for example, a microfluidic splitter device (10). An analyte's interaction is different for each of these stationary phases, so this provides an intermediate retention property for the analyte. For example, if the analysis is conducted using polar–nonpolar coupled columns, the retention time will be the summation of the interaction time of the analyte in both the first and second columns. This is better expressed in terms of retention factors:

where, tR,1 and tR,2 are analyte retention times on the first and second columns, ks is the coupled column retention, and tM,S is the coupled column void time. The term φ is called the relative retentivity, and measures the relative contribution of each column to the composite retention. It provides a straightforward numerical presentation of hold-up time, and retention variation for a PT system. For isothermal analysis, the overall retention will be a weighted average of the time that the analyte resides on each column. Peaks can shift relative to each other for different midpoint pressure settings, so careful adjustment of the pressure using this strategy allows an optimized 1D separation to be achieved.
A change in the midpoint pressure (junction pressure) has a direct effect on the carrier gas flow, corresponding to changes in hold-up time for each column, that is, the tM values for each column. At a given temperature, this determines the retention factor (k) of each solute on each column; changes in hold-up time can vary the retention properties of the analytes as a result of the PT process. It should be asked how much change in hold-up time is possible by PT, and how this is related to retention properties. The answer is based on (a) the analytes' properties, (b) the stationary phases used for the PT column ensemble, (c) the pressure setting, and (d) contribution of the stationary phase to separation on each column.
PT-GC×GC Mechanism for Adjustment of Retention
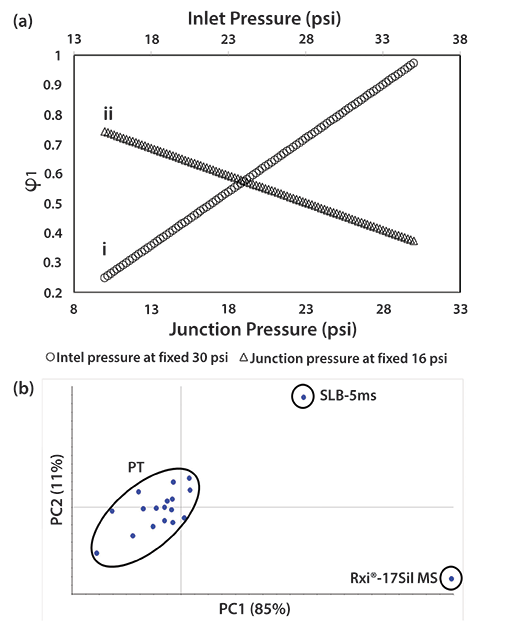
The relationship between relative column contributions and retention properties for different analytes for the decompression of carrier gas in each column in a coupled column system is documented in earlier work (11). Each column's contribution changes in a predictable manner with pressure setting. Figure 1a shows a combined summary of changes in column 1 contribution (φ1) by changing (i) the midpoint pressure at a fixed 30 psi inlet, and (ii) the inlet pressure at a fixed 16 psi of midpoint pressure. Increasing the midpoint pressure at fixed inlet pressure increases the first column contribution by increasing the residence time on the 1D1, and this, consequently, decreases the contribution of the second (1D2) column. Changes in inlet pressure can also provide a tuning opportunity if the midpoint pressure remains constant; midpoint pressure tuning seems more flexible. The overall solvation descriptors using the linear solvation energy relationship (LSER) in the case of PT are also described and compared to the single and coupled column descriptors. The possibility of applying PT for an intermediate selectivity (Figure 1b) is clearly demonstrated, indicating that variable retention properties can arise for PT, allowing peaks to shift in relative retention. Based on this point, it is evident that the PT process could be an opportunity to alter 1D selectivity in the first dimension of an online coupled- column system in GC×GC, which can translate into different elution properties on the 2D column.

Figure 1: (a) Plot showing changes of 1st column contribution (φ1) by either (i) a midpoint, or (ii) inlet pressure change; and (b) selectivity differences when using the PT process in terms of LSER descriptors in a principal component analysis (PCA) plot-the PT system is neither like the SLB-5ms phase, nor the Rxi-17 MS phase. Adapted with permission from reference 11.
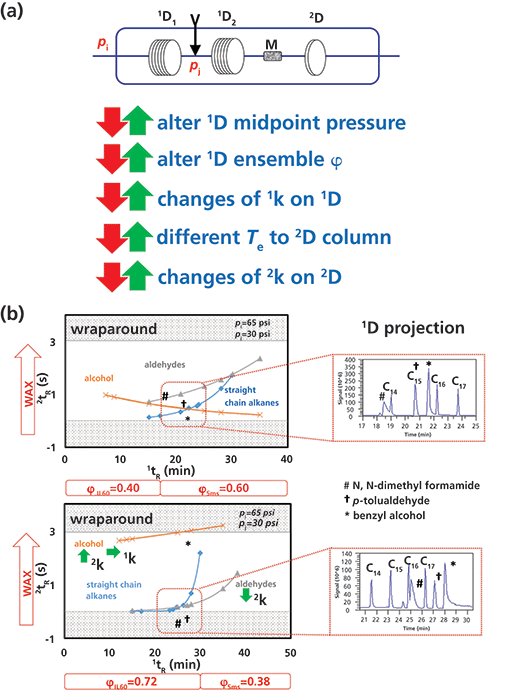
The net retention of an analyte in PT-GC×GC involves a combination of steps that systematically change parameters, as shown in Figure 2a. The first dimension in GC×GC is important to accomplish a preliminary first separation screen of the sample, and then the second dimension provides separation over a very short time with limited peak capacity. A viable separation strategy will ensure that the 1D compound retentions are appropriate to then allow the 2D column to complete the desired separation. PT in 1D GC×GC could be an option to optimize the midpoint pressure to give best separation in the 1D, and then provide best separation in 2D space (12). For example, an increase of junction pressure from 30 to 60 psi in Figure 2b increases the first, 1D, column contribution from 0.40 to 0.72; as a result the 1D ensemble increases the relative retention for polar analytes, such as alcohols (yellow line), compared with straight chain alkanes (blue line).
The effect of PT on 1D separation alters compound elution temperature (Te) to the 2D column, and, as a result, the relative 2D separation will be modified. For example, in Figure 2b, the aldehyde (marked †: p-tolualdehyde) was coeluted with C15 alkane (tR = 21 min) at 30 psi, but tR ~ 27 min at 60 psi midpoint setting. This significantly changes the Te (by 40 °C at 10 °C/min) and hence 2tR In other words, in a temperature programmed run, the Te of this solute is increased when it enters the 2D column. As a result, the 2D retention for this analyte was reduced from 1.015 to 0.226 s. This should be sufficient to resolve this compound from others that might have been coeluted on the 1D or the 2D column. Similar observations can be made for other analytes. As a result of these changes in 1D and 2D retention of analytes by tuning the midpoint pressure, the overall separation orthogonality is also changed, as shown in a recently published work (12). Some wraparound-where wraparound causes 2tR to exceed the modulation period-did occur, which must be considered for the PT-GC×GC separation.

Figure 2: (a) Illustration of features of PT-GC×GC; the arrows illustrate the parameters that will change according to variation in Pi and Pj settings; and (b) the changes in 1k and 2k for selected analytes as a result of change of mid-point pressure from 30 psi to 60 psi. Column set: 30 m × 0.25 mm, 0.20-µm 1D1 SLB-IL60 phase (Supelco), 30 m × 0.25 mm, 0.25-µm 1D2 SLB-5 ms phase (Supelco), and 2 m × 0.10 mm, 0.10-µm 2D Supelcowax10 (Supelco). The contour plot shows only a few experimental, and some extrapolated, data points with an increasing carbon skeleton of straight chain alkanes, aldehyde, and alcohol. M = modulator. See text for details.
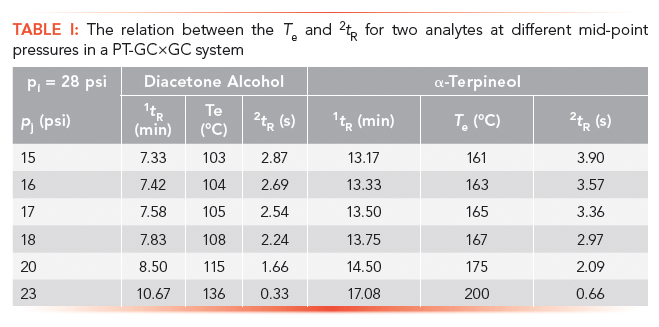
The changes in the 2D can be predicted by estimating the Te for different PT programs. This change follows the isovolatility curve of analytes (progressive reduction in retention as T increases), with data shown in Table I for two analytes. The 2tR value decreases as the Te increases because of an increase of pj for diacetone alcohol and α–terpineol. This relation can be used to determine the 2D position of any analyte for different PT settings, which changes the analyte's retention position in 2D, and, therefore, the overall separation orthogonality. Both of these analytes are polar, and so the effect of PT is not great. A nonpolar analyte will have much more of a variation.

Increasing flexibility of operation by using an "impulse" to tune the separation power of columns is not new in chromatography. Mommers and coworkers studied tuning the selectivity of GC×GC in both the 1D and 2D by using temperature (13,14). In terms of extending separation by use of multiple GC×GC arrangements, Savareear and Shellie proposed multiplexing column phases to give two independent GC×GC systems, and achieve more chromatographic information in reduced operation time (15). Synovec and coworkers recently demonstrated implementation of GC×GC×GC–time-of-flight (TOF)–MS, which offers many opportunities for additional column phase choices to maximize separation (16). The latter are "static" approaches that do not allow easily modified conditions permitted by pressure tuning of selectivity in GC×GC. For 1D approaches, temperature pulsing for liquid chromatography (LC) and a midpoint pressure tuning approach on supercritical fluid chromatography (SFC) have also been reported in the literature (17,18). These two studies demonstrate a degree of flexibility of operation in a 1D ensemble for LC and SFC.
The Multiple Benefits of a PT-GC×GC System
Many strategies can be envisaged to alter the overall separation in a PT-GC×GC experiment.
1. The first-dimension separation could be tuned by peak swapping as a result of the PT process.
2. The second-dimension separation may be tuned by variation in Te to the 2D column.
3. The overall separation orthogonality may be changed.
4. A simple, online process of tuning selectivity by altering the midpoint pressure is possible.
5. It may be possible to use a small set of 1D ensemble and 2D columns, but with PT of 1D, to achieve the best separation for different sample types. By using a "good choice" of 1D ensemble with an appropriate 2D column, with specific PT of 1D, it might be possible to use different PT set points; for example, set point 1 may be best for separation of sample type 1, set point 2 may be best for separation of sample type 2, and set point 3 may be best for separation of sample type 3.
Further examples of the benefits of PT may be expanded on as follows.
Rapid Screening Method of a Wide Variety of Samples
Rapid screening of sample analytes to get an initial idea of sample contents for a wide variety of sample types-for example, essential oils, fatty acids, and so on-by using the tuning properties of PT-GC×GC is advantageous for any laboratory. Instead of accepting a less optimized result using a previously installed column set, an analyst can easily modify the selectivity of the 1D using this PT mechanism, which would save time and resources, and increase throughput and output of the laboratory.
PT in 2D of a GC×GC Separation
The second-dimension separation in GC×GC (GC×PTGC) may be investigated under incrementing isothermal conditions, because of the very short time and fast separation on the 2D. Optimization of GC×GC working parameters most often involves finding ways to adjust the 2D column phase and its retention (2tR) for compounds eluted on the 1D column. PT coupled columns in the 2D (GC×PTGC) experiment have been reported recently to help in understanding the opportunities and limitations of 2D PT (19). As in 1D, the tunable residence time arising from differential pressure drop in each 2D column (2D1 and 2D2) results in a tunable fractional contribution of each column in the 2D separation. However, the very short and fast retention times expected for the 2D makes PT of the 2D difficult.
Unknown Identification by PT Coupled Columns
Retention index data relate the retention of a solute to a reference series of homologous compounds, such as alkanes, on a specific stationary phase and at a given temperature, although temperature programming indices are often also used. A number of sources include I data on commercial stationary phases. In PT, a first-dimension index-1I-means that data for alkanes and the solute must be collected from two different phases at a given PT setting. This might be considered a difficult process to interpret, although the alkane and solute retentions are easily measured, just by noting their elution times from the ensemble. It is necessary to find a strategy to align the retention index data for the coupled column system, in order to apply the index system to solute identification. By using isothermal data from individual columns and then fitting PT data, it is possible to align PT retention index data for the identification of library data of the analytes (20).
The On-Line Process of Selectivity Change
The PT process allows online selectivity changes in GC×GC. An investigation of first dimension selectivity by changing the 1D composite column length (1D1 and 1D2) has been reported in the literature (21). The authors used two contrasting columns (nonpolar and polar) to measure the effect of 1D column selectivity on overall separation and orthogonality. They showed that the 2D separation is affected by, and can be interpreted based on, the 1D Te to the 2D column; data were simulated and agreed with the experiment. Changes in 1D and corresponding 2D retention changes closely followed the isovolatility curve of most compounds. The PT process simplifies this experiment by adjusting the selectivity of 1D ensembles simply by changing the midpoint pressure setting as described above. In a similar vein, PT can tune the selectivity of the coupled column as discussed in that previous study, but without physically changing the column length.
Conclusion
Pressure tuning is apparently a straightforward process, effected by a midpoint pressure adjustment that is able to swap or alter peak positions in a chromatogram. In the GC×GC context, PT offers useful conceptual and potentially practical opportunities because of the tuning capability and consequent change of orthogonality in the 2D space, offered simply by changing PT settings for many types of samples. The 1D PT ensemble probably has little attraction, particularly for complex samples, because it alters the relative retentions somewhat randomly. However, for GC×GC, PT of the 1D column offers a number of advantages largely based on the benefits of modulation and resultant 2D separation. The 2D plot quickly illustrates how PT alters separation; for example, by their overlay, and how by comparison of different PT settings a best result can be found. It might be, of course, that a non-PT arrangement is best for a specific sample. Ideally, the advantages of PT-GC×GC could be: (i) shorter downtime of the system because in cases where a (1D1–1D2)×2D column arrangement allowed acceptable tuned separation performance for a range of different samples, then dedicated column sets might not have to be installed and equilibrated for every different sample; (ii) extended column lifetime from less frequent column removal and installation; (iii) flexibility of operation because of online selectivity change and optimization, and (iv) reduced labor as a result of simpler column management. At this moment, PT-GC×GC is still a curiosity in terms of its full potential and application boundaries for practical process in GC×GC. Hopefully, effective control of instrument performance, selection of suitable column chemistries, and demonstrated applications that are readily tuned through PT, and which offer fast screening of sample analytes, will be realized. A centralized laboratory relying on GC×GC to analyze many different samples might take advantage of this process by being able to provide tunable separations in GC×GC without having to frequently change column sets, simply by using PT to give suitable 2D separation.
References
(1) Z.-Y. Gu, C.-X. Yang, N. Chang, and X.-P. Yan, Acc. Chem. Res. 45, 734–745 (2012).
(2) X. Han and D.W. Armstrong, Acc. Chem. Res.40, 1079–1086 (2007).
(3) K.B. Mogensen and J.P. Kutter, Lab Chip12, 1951–1958 (2012).
(4) J.H. Purnell, J.R. Jones, and M.H. Wattan, J. Chromatogr. A 399, 99–109 (1987).
(5) M. Akard and R. Sacks, Anal. Chem.66, 3036–3041 (1994).
(6) H. Smith and R. Sacks, Anal. Chem.69, 5159–5164 (1997).
(7) R. Sacks, C. Coutant, and A. Grall, Anal. Chem. 72, 524A–533A (2000).
(8) Z. Liu and J.B. Phillips, J. Chromatogr. Sci. 29, 227–231 (1991).
(9) H.-Y.J. Chow and T. Górecki, Anal. Chem. 89, 8207–8211 (2017).
(10) K.M. Sharif, S.-T. Chin, C. Kulsing, and P.J. Marriott, TrAC, Trends Anal. Chem.82, 35–54 (2016).
(11) K.M. Sharif, C. Kulsing, S.-T. Chin, and P.J. Marriott, J. Chromatogr. A1455, 156–162 (2016).
(12) K.M. Sharif, C. Kulsing, and P.J. Marriott, Anal. Chem.88, 9087–9095 (2016).
(13) J. Mommers, J. Knooren, T. Dutriez, E. Ritzen, and S. van der Wal, J. Chromatogr. A 1270, 305–309 (2012).
(14) J. Mommers, G. Pluimakers, J. Knooren, T. Dutriez, and S. van der Wal, J. Chromatogr. A 1297, 179–185 (2013).
(15) B. Savareear and R.A. Shellie, Anal. Chim. Acta803, 160–165 (2013).
(16) N.E. Watson, H.D. Bahaghighat, K. Cui, and R.E. Synovec, Anal. Chem.89, 1793–1800 (2017).
(17) Y. Hirata, K. Tsuda, and E. Imamura, J. Chromatogr. A1062, 269–273 (2005).
(18) M. Pursch, P. Eckerle, B. Gu, J. Luong, and H.J. Cortes, J. Sep. Sci.36, 1217–1222 (2013).
(19) K.M. Sharif, C. Kulsing, A.I. da Silva Junior, and P.J. Marriott, J. Chromatogr. A1536, 39–49 (2017).
(20) K.M. Sharif, S.-T. Chin, and P.J. Marriott, Unpublished.
(21) D. Ryan, P. Morrison, and P. Marriott, J. Chromatogr. A1071, 47–53 (2005).
Mohammad Sharif Khan is a postdoctoral researcher at Dartmouth College, Hanover, New Hampshire.
Philip J. Marriott is a professor at the School of Chemistry, Monash University, Australia. Direct correspondence to: philip.marriott@monash.edu

New Method Explored for the Detection of CECs in Crops Irrigated with Contaminated Water
April 30th 2025This new study presents a validated QuEChERS–LC-MS/MS method for detecting eight persistent, mobile, and toxic substances in escarole, tomatoes, and tomato leaves irrigated with contaminated water.

.png&w=3840&q=75)

.png&w=3840&q=75)


.png&w=3840&q=75)


.png&w=3840&q=75)


