Instrument Considerations in the Transfer of Chromatographic Methods, Part III: Aligning Performance of Modules
LCGC North America
In method transfer, carefully aligning the modules of the two systems is essential.
Many laboratories spend a large amount of time and effort transferring chromatographic methods. This is the final installment of a three-part series describing the challenges and solutions commonly associated with this activity. Part I dealt with the method itself. In part II, the characterization of the system was emphasized. In part III, the techniques for bringing the individual modules of the two systems into alignment so that equivalent results are obtained. As expected, the pumping system requires much attention, but the injector, the column temperature control, and the detector must also be carefully managed.
Transfer of chromatographic methods is a fundamental and critical activity This is the third installment of a series describing issues and challenges that are often encountered in the duplication of results of the established methods. Parts I and II have been published (1,2). They described the method itself (1), and the characterization of the chromatographic systems (2). In this final installment, we will consider techniques for aligning the performance of the individual modules of the originating and the target systems, so that essentially identical chromatographic results can be obtained.
Solvent Delivery
In part II of this discussion, the characterization of differences between systems was described in detail. Particular emphasis was placed on the solvent delivery system, and the effects of system dwell volume. Several references have been made to applying corrections to the target system. There are essentially three ways to make these corrections. One approach is to program the delivered gradient to exactly match the gradient of the originator system. The second technique is to physically modify the target system by adding or removing volume. The third option is to adjust the start time of the gradient relative to the actual injection.
Duplicating Gradient Formation
One approach to corrections is to program the delivered gradient to exactly match the gradient of the originator system. Using detailed knowledge about the system behavior of the originator's LC instrument and the target system, an algorithm creates an emulation function, that delivers similar gradient conditions as the selected instrument. The results are similar retention times and similar chromatographic resolution. An example is shown in Figure 1 (4).
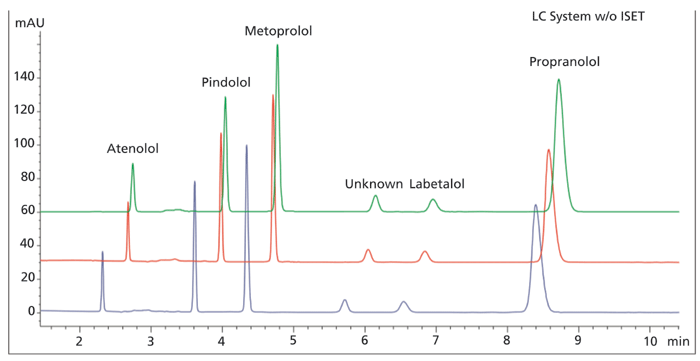
Figure 1: Example showing the duplication of gradient formation using an emulation function algorithm. Reprinted with permission from Agilent Technologies, Inc. 2013-2014.
This approach combines careful measurements of the systems involved with the operating characteristics of the method (4). The measurements are based on the system dwell volume and the geometry of the mixing volume, as well as imperfections in solvent composition. This information is combined with the operating functions of the solvent delivery system that control the effects of solvent compressibility and non-additive mixing volumes. The software creates the transfer functions to generate a timetable.
This is an uncommon solution because it is quite difficult to implement. It also requires the most information about the two systems involved in the transfer. It has been suggested that this general approach deviates from the guidelines found in Chapter 621 of the current United States Pharmacopeia (3), since a new gradient table is written, often with more lines or time points. The guidelines specify no changes to the gradient. A reasonable counterargument can be made that this technique is based on exact and accurate characterization of the established gradient, and implies that the same, unmodified gradient will be delivered on the target system.
Physical Changes to System Volume
The second technique is to physically modify the target system by adding or removing volume, usually upstream from the injector. This usually means replacing mixers with a different size device, or simply adding or removing mixers. Such mixer alternatives are usually available from the instrument manufacturer, as well as third party vendors of chromatographic accessories. Since the shape of the gradient that is delivered depends on the shape of the mixer, it may be necessary to empirically test several choices to establish the best chromatographic match. Multiple devices can be installed in series, so that the system to be used closely approximates the volume of the originator system. By matching the gradient offsets, the retention times observed on the two systems can closely agree as shown in Figure 2 (5). Physical modification of the system is generally regarded as consistent with USP guidelines.

Figure 2: Alternative mixers for adjustment of system volume (Slide 13; Steiner HPLC Tutorial) Reprinted with permission, Dr. Habil. Frank Steiner, Thermo Scientific.
Adjusting Gradient Start Time
The third technique is to adjust the start time of the gradient relative to the actual injection. Historically, systems have defaulted to starting the gradient clock simultaneously with the injection. For many years, chromatographers have inserted a hold line at the start of the gradient table to create the effect of a larger system volume. Recently, it has become commonly possible in system control software to hold the injection for a period after the gradient clock has started. This is the equivalent of a smaller system dwell volume. Thus, this approach can effectively increase or decrease system volume to match the originator system. Because the gradient slope and duration are unaffected in this approach, it is considered compliant with the USP guidelines. The successful use of this approach is shown in Figure 3 (5).
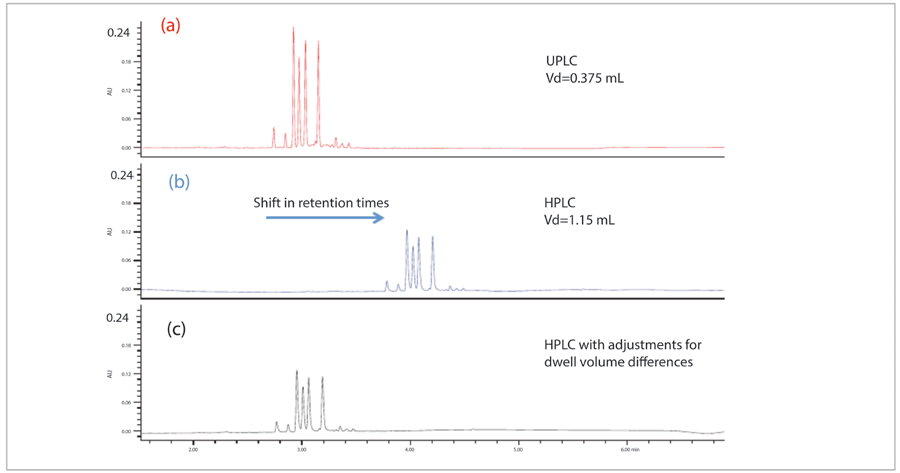
Figure 3: Adjustment of gradient start relative to injection for matching system volume; Reprinted with permission of Waters Corporation (6). Reprinted with permission, Eric Grumbach, Waters Corporation.
It is possible to combine both the physical options and method control functions. This substitution of a device with a different volume essentially provides a coarse adjustment of system volume that is combined with fine tuning using the specification of gradient start relative to the injection. The successful use of this technique is shown in Figure 4 (6).
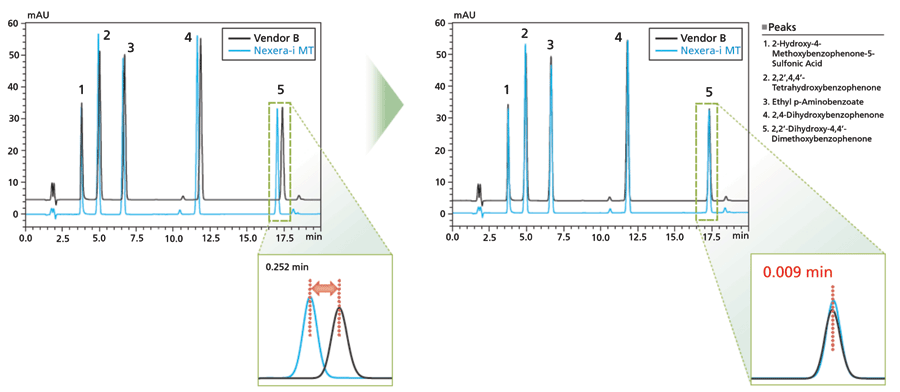
Figure 4: Transfer of method originated on low pressure mixing system; Reprinted with permission of Shimadzu Corporation (7).
Autosampler
We expect that the autosampler of our chromatographic system will introduce a specified volume of sample into the fluid stream leading to the column. The volume is to be measured with the accuracy and precision required by the method. The transfer must occur with a minimum of band-broadening. Finally, the steps in the injection and analysis must prevent carryover from one injection to the next. The engineering solutions that are developed to meet these objectives create differences between systems that may affect the method transfer.
We begin by comparing the two systems involved in the transfer. There are some distinct basic designs of autoinjectors. In one design, often called a fixed loop injector, a sample needle acts as a transfer device. The sample is drawn from a vial, and moved to a sample loop. The sample loop is moved in and out of the fluid path with the injector valve. The needle must be cleaned, inside and out, between injections. The other design, called a flow through needle or split loop injector, also brings the sample into a needle. The needle itself is placed into a high-pressure port, and becomes part of the fluid path leading to the column. In this design, the entire volume of the mobile phase, including the gradient, passes through the inside of the needle. In this design, the inside of the needle is cleaned by the mobile phase, but the outside of the needle and the passages in the valve still require attention to prevent carryover. There are also two common modes of injector operation. In partial loop mode, a metering syringe controls the volume of liquid introduced into the fluid path. In full loop injection, the entire physical volume of a length of tubing is filled with sample. That tubing volume is the amount injected. In general, a full loop injector gives the best precision, while a partial loop injection gives the most flexibility and convenience. A flow through needle injector cannot be used in full loop mode while a fixed loop device can be used in either way.
For method transfer, it is, of course, preferred for the target instrument to use the same injector design and mode. In that case, all operating parameters can be held the same. There are, however, some volumetric details that can add complication. There must be sufficient sample liquid present in the vial for the required number of injections. The required volume is dependent on the total volume in the vial, whether the needle opening is on the side or the tip of the needle, and how far above the bottom of the vial the needle is placed. In addition, injectors, especially fixed loop type, draw more liquid than just the required injection amount. This volume can be especially large in fixed loop mode, where the needle must be overfilled by a factor of 3 to 5. These volumes can easily exceed 50 µL in making a single 5 µL injection. Where multiple injections are required from a single sample vial, it is possible to draw the liquid level down to the point where the needle orifice is no longer covered. This problem can be most easily recognized by examining the peak areas over a series of injections. If the first few injections have constant area followed by a drop to a lower value, consider the possibility that the sample level is too low.
When using a flow through needle type injector, it is important to be sure that the sample holding path has sufficient volume to accommodate the required range of injection volumes. The standard guideline is that an injector needle or loop should not be filled to more than half its capacity to ensure quantitative transfer.
When transferring from one full loop injection system to another, both with fixed loop injectors, it is expected that the peak size, both height and area, will be different. The volume specified for the sample loop has a modestly broad tolerance, so the absolute volume is different from one loop to another. This does not affect the use of the loop in the actual assay since the volume of standard and sample is the same. Injections from a single instrument are consistent, but it is not reasonable to compare absolute areas from one instrument to another, because the tolerances on tubing internal diameter (i.d.) give a significant range of absolute volume for a given sample loop size. Some methods and standard operating procedures (SOPs) are written with specification of a minimum peak area or height. If that specification is too close to the tolerance limit of injector loops, it may be necessary to select a loop on the higher edge of the specified volume tolerance.
Transfers from one partial loop injection to another, when both are either fixed loop or flow through needle, is usually fairly straight forward, as long as each is operated within that instrument's recommended best operating practices. Special attention should be paid to matching wash solvents and syringe draw rates.
There is one additional, somewhat surprising, complication that can be rooted within the injector. It is regarded as important that the injection minimize dispersion for the best resolution and minimum peak volume. The trend, over many years, in instrument design and development, has been to engineer reduced dispersion into the injector at every opportunity. All the major instrument manufacturers have been successful in this effort, so as to take advantage of smaller volume columns packed with smaller particle packing materials. At the same time, however, chromatographers have used dispersion during the injection, seldom with intentional manipulation, to blend the sample with the initial strength mobile phase. For some samples, moving to a system with reduced dispersion can result in distorted peak shape and reduced retention, as shown in Figure 5 (8). The problem is more apparent for analytes with low retention dissolved in relatively strong solvent. This phenomenon can be diagnosed by comparing the injection of one-half the volume. If the reduced volume improves peak shape and retention, the quality of the assay can be recovered by adding some small dispersion to the system, also shown in Figure 5 (8). A variety of devices have been used for this increased dispersion, such as in-line particle filters, or 10-50 µL injector loops. Some experimentation may be required to identify the best device for the required dispersion on any given instrument.
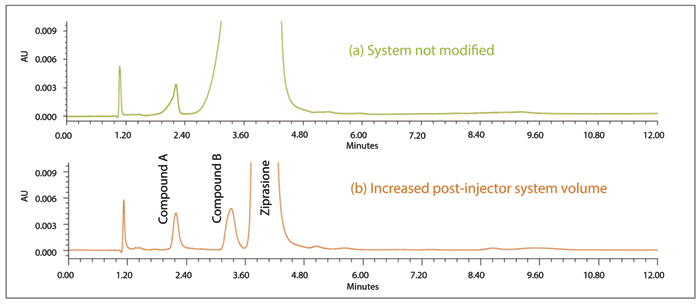
Figure 5: Effect of adding dispersion to injection. Sample blended with initial strength mobile phase. Reprinted with permission Waters Corporation, 2016 (8).
Temperature Control
The next instrumental factor that affects the method transfer is the temperature control during the separation. It would seem that this factor should be the easiest element to control consistently from one system to another, but it has, in fact, proven to be the most difficult over the years. In general, commercial column heaters do provide a very stable and consistent thermal environment. The programmed and delivered column temperature is very consistent among ovens of the same brand and model, and the chromatographic results will be consistent with all the heaters of the same brand and model maintaining the same effective column temperature. It is, however, usually observed that two heaters of different design, even different models from the same manufacturer, will have a different effective column temperature reflected in altered retention and selectivity. The factors that create differences among ovens include placement of the sensor and heating elements, insulation and sealing of the chamber, circulation of air in the oven, venting associated with any drain, pre-heating of solvent, susceptibility to environmental influences, and other less obvious factors. The various temperature gradients and distortions are summarized schematically in Figure 7. It is most commonly found that a series of empirical trials will be necessary to identify the correct temperature setting on the target system to duplicate the retention and selectivity of the originator system. The magnitude of the difference in proper temperature setting between two systems is difficult to predict, and will depend on properties of the method under study. Often, the observed difference is only 2 to 3 °C, but there are many good examples of well-controlled transfers that required as much as 7 to 10 °C difference in temperature settings between systems.
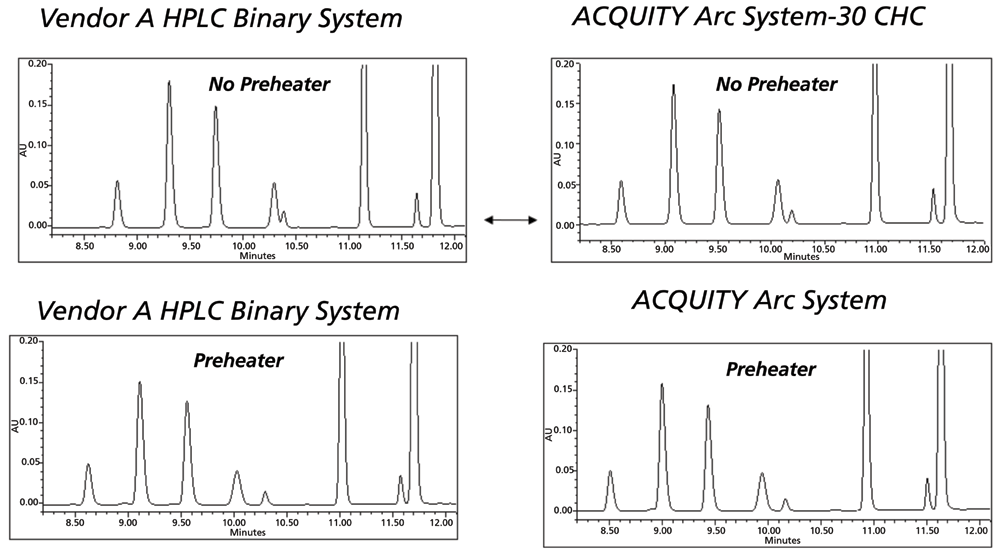
Figure 6: Effect of mobile phase pre-heating in method transfer; Reprinted with permission Waters Corporation, 2014 (6).
When executing the empirical screen for the effective matching temperature setting, the separation quality is judged by both retention and selectivity. It will be recognized, however, that both of those characteristics are affected by both temperature and by solvent profile. The final conditions must match both parameters, so the experimental design must include some matrix that tests each in a single variable experiment. As a guide to interpreting the results, it is usually observed that the solvent profile has its largest effect on retention, while temperature can have more influence on selectivity. This is not universal. Particular samples and methods may have different most significant influences.
There is one important consistent aspect of temperature control that has always been common in method transfer. Pre-heating of the mobile phase has the largest impact of any part of the heating system. As a first step in establishing the correct temperature setting, the target system should match the originator system with respect to whether the mobile phase is pre-heated on entering the oven prior to the column. This effect is illustrated in Figure 6 (9). With this starting point, the analysis can proceed to screening small steps in temperature both above and below the temperature used in the original method.
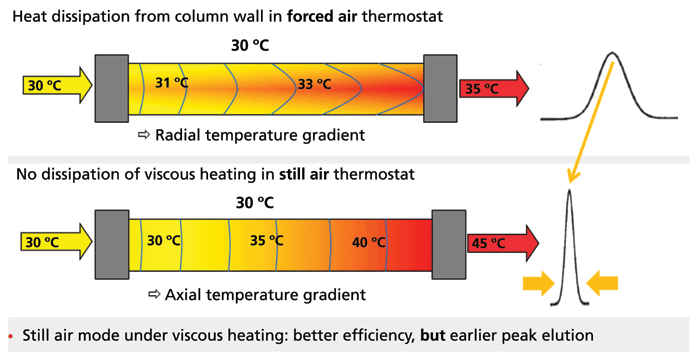
Figure 7: Effect of forced air and still air on effective column temperature; F. Steiner; Thermo Fisher Scientific; Understanding instrumental parameters that affect method transfer in UHPLC separations, PowerPoint presentation at HPLC 2017; Reprinted with permission, Dr. Habil. Frank Steiner, Thermo Scientific.
Detector
The final module of the instrument that can affect the method transfer is the detector. Most often, a tunable/variable ultraviolet-visible (UV-Vis), or a photodiode array (PDA) detector, will be used, so we will limit our comments to those devices. Specialized detectors with different sensitivity, such as fluorescence, evaporative light scattering, and so on, are outside the scope of this general paper. Both UV-Vis and PDA detectors typically have adjustable bandwidth or resolution. There is also typically a time constant or filter. These parameters should be matched between the two systems. An increase in bandwidth typically gives less optical noise, but a smaller linear range. A longer time constant yields wider and less intense chromatographic peaks at a slightly longer retention time. Different models or brands of detectors may also differ in the amount of band-broadening or dispersion in the detector cell. Finally, some commercial detectors have cells with different path lengths; this can affect peak height. For those methods that specify a minimum peak height, the only solution may be to choose a different brand or model of detector.
Conclusions
Transfers of chromatographic methods seem at first glance to be straight forward and simple exercises. In practice, such efforts often prove much more difficult than expected. In this discussion, we have described some critical details in executing a successful transfer of a liquid chromatographic method. We have emphasized the details of the laboratory facilities and activities surrounding the instrument. Each instrument module has been considered with the adjustments that are possible in methods transfer. We have summarized some diagnostic experiments and the adjustments that can be made to bring the target system into alignment with the originator system. Further studies are required to extend this discussion to improving existing methods while preserving analytical quality.
References
(1) T.E. Wheat, LCGC North Am. 36(9), 693–696 (2018).
(2) T.E. Wheat, LCGC North Am. 36(11), 824–829 (2018).
(3) General Chapter <621> "Chromatography" in United States Pharmacopeia 40 National Formulary 35 (USP 40-NF 35, United States Pharmacopeial Convention, Rockville, Maryland, 2017), pp. 508-520.
(4) A. G. Huesgen; Agilent 5991-1603, Copyright Agilent Technologies, Inc. 2013-2014.
(5) F. Steiner; Thermo Fisher Scientific; Understanding instrumental parameters that affect method transfer in UHPLC separations, PowerPoint presentation at HPLC 2017; Slide 13; 2017. Copyright Thermo Fisher Scientific Inc.
(6) P. Hong and P.R. McConville; Waters Corporation White Paper; 720005204en. Copyright Waters Corporation (2014).
(7) Shimadzu Corporation; i-Series Method Transfer System brochure 3655-06616-25ANS, Copyright Shimadzu Corporation (2016).
(8) M. Maziarz, M.D. Jones, S.M. McCarthy, W.B. Potts, and F. Forini; Waters Corporation White Paper; 720004697en. Copyright 2013 Waters Corporation (2013).
(9) F. Steiner; Thermo Fisher Scientific; Understanding instrumental parameters that affect method transfer in UHPLC separations, PowerPoint presentation at HPLC 2017; Slide 28. Copyright Thermo Fisher Scientific Inc. (2017).
Thomas E. Wheat is a principal scientist with Chromatographic Consulting, LLC in Hopedale, Massachusetts. Direct correspondence to: chromatographic.consulting@gmail.com.

New Method Explored for the Detection of CECs in Crops Irrigated with Contaminated Water
April 30th 2025This new study presents a validated QuEChERS–LC-MS/MS method for detecting eight persistent, mobile, and toxic substances in escarole, tomatoes, and tomato leaves irrigated with contaminated water.
Accelerating Monoclonal Antibody Quality Control: The Role of LC–MS in Upstream Bioprocessing
This study highlights the promising potential of LC–MS as a powerful tool for mAb quality control within the context of upstream processing.
University of Tasmania Researchers Explore Haloacetic Acid Determiniation in Water with capLC–MS
April 29th 2025Haloacetic acid detection has become important when analyzing drinking and swimming pool water. University of Tasmania researchers have begun applying capillary liquid chromatography as a means of detecting these substances.

.png&w=3840&q=75)

.png&w=3840&q=75)


.png&w=3840&q=75)


.png&w=3840&q=75)


