Peptide Mapping of Monoclonal Antibodies and Antibody–Drug Conjugates Using Micro-Pillar Array Columns Combined with Mass Spectrometry
Special Issues
The structural complexity of monoclonal antibodies (mAbs) challenges the capabilities of even the most advanced chromatography and mass spectrometry techniques. This study examines the use of micro-pillar array columns in combination with mass spectrometry for peptide mapping of both mAbs and antibody–drug conjugates (ADCs).
Monoclonal antibodies are becoming a core aspect of the pharmaceutical industry. Together with a huge therapeutic potential, these molecules come with a structural complexity that drives state-of-the-art chromatography and mass spectrometry (MS) to its limits. This article discusses the use of micro-pillar array columns in combination with mass spectrometry for peptide mapping of monoclonal antibodies (mAbs) and antibody–drug conjugates (ADCs). Micro-pillar array columns are produced by a lithographic etching process creating a perfectly ordered separation bed on a silicon chip. As a result of the order existing in these columns, peak dispersion is minimized and highly efficient peptide maps are generated, providing enormous structural detail. Using examples from the author's laboratory, the performance of these columns is illustrated.
The discovery of monoclonal antibodies (mAbs) in the 1970s and the realization of their therapeutic potential in the following decades has been a key milestone in medicine (1–3). Today, over 70 mAbs have received regulatory approval in the US and Europe, of which over 20 display blockbuster status, and over 50 are in late-stage clinical development (4–6). With the top-selling mAbs evolving out of patent, there has been a growing interest in the development of biosimilars (5,7,8). In 2013, we witnessed the European approval of the first mAb biosimilars and in 2016, the first mAb biosimilar also reached marketing authorization in the US. Since then, a growing number of mAb biosimilars have reached approval in both Europe and the US. The successes of mAbs have furthermore triggered the development of various next-generation formats. In oncology, antibody–drug conjugates (ADCs) are particularly promising, because they synergistically combine a specific mAb linked to a biologically active cytotoxic drug via a stable linker. The promise of ADCs is that highly toxic drugs can selectively be delivered to tumor cells, thereby substantially lowering side effects as typically experienced with classical chemotherapy. Currently two ADCs are marketed and over 30 are in clinical trials.
Together with a huge therapeutic potential, mAbs come with an enormous structural complexity. Opposed to small-molecule drugs, mAbs are large (ca. 150 kDa) and heterogeneous (as a result of the biosynthetic process and subsequent manufacturing and storage) making their analysis very challenging. Despite the fact that only a single molecule is cloned, hundreds of possible variants differing in post-translational modifications (N-glycosylation, asparagine deamidation, aspartate isomerization, methionine oxidation), amino acid sequence, and higher order structures may coexist, all contributing to the safety and efficacy of the product. Compared to naked mAbs, ADCs further add to the complexity because the heterogeneity of the initial antibody is superimposed with the variability associated with the conjugation. Conjugation typically takes place on the amino groups of lysine residues or on the sulphydryl groups of interchain cysteine residues. With 80 to 100 lysine and only eight interchain cysteine residues available, lysine conjugation yields a more heterogeneous mixture of species compared to cysteine conjugation.
Peptide mapping is particularly powerful for the detailed structural characterization of these products and has proven to be of enormous value in demonstrating comparability, for example, between mAb originator and biosimilar. Characteristics such as amino acid sequence and modifications like N- and O-glycosylation, glycation, N- and C-terminal processing, deamidation (asparagine, glutamine), aspartate isomerization, succinimide, oxidation (methionine, tryptophan), clipping, sequence variants, cysteine variants (S-S bridges, thioether, free cysteine), and drug conjugation sites can readily be extracted out of the generated peptide map data and at low levels.
Looking back to the peptide mapping of the first monoclonal antibodies in the late 1980s and early 1990s, one will notice a substantial leap forward in technical capabilities. Chromatography and mass spectrometry were at that time of modest performance compared to the current state-of-the-art technology. High performance liquid chromatography (HPLC) separations were performed on columns packed with 5–10 µm porous particles and pumps were operated at 400 bar. Fast atom bombardment (FAB) was used to introduce peptides into low resolution mass spectrometers and peptide identity was further confirmed using Edman degradation following peak collection (16). Today, columns packed with sub-2-µm porous and superficially porous particles operated at system pressures up to 1500 bar and electrospray ionization (ESI) can be used to introduce peptides into high resolution mass spectrometers equipped with a variety of fragmentation modes.
A more recent addition to the chromatographers toolbox are micro-pillar array columns. The origin of this technology dates back to the late 1990s when Regnier et al. addressed the problem of miniaturizing capillary electrochromatography (CEC) columns and introduced microfabricated supports as an alternative for the conventional packed beds (17,18). The theoretical benefit (reduction of the van Deemter A-term) of such supports was elucidated only a few years later by Knox (19). In the years to follow, Desmet et al. conducted several quantitative studies on Knox's argumentation, taking a column filled with an array of pillars as a representative example (20). In 2007, the first micromachined LC columns operated by pressure-driven liquid flow, later termed micro-pillar array columns, were reported (21). The inherent high permeability and low "on-column" dispersion obtained by the perfect order of the separation bed makes micro-pillar array-based chromatography unique and offers several benefits for chromatographers. The peak dispersion originating from heterogeneous flow paths in the separation bed is eliminated (no A-term contributions) and therefore components remain more concentrated (sharp peaks) during separation. The freestanding nature of the pillars also leads to much lower backpressure allowing the use of very long columns. These properties result in excellent chromatographic performance with high resolution and high sensitivity.
This article describes the use of micro-pillar array columns in the characterization of mAbs and ADCs for the first time.
Materials and Methods
Materials
Water and acetonitrile were purchased from Biosolve. Trifluoroacetic acid, dithiothreitol (DTT), and 2-iodoacetamide (IAA) were from Sigma-Aldrich. Tris-HCl pH 7.5 was purchased as a 1 M solution (Thermo Fisher Scientific). Porcine sequencing-grade modified trypsin was acquired from Promega and Rapigest from Waters. Herceptin and Kadcyla were obtained from Roche, Remicade from Johnson & Johnson, Adcetris from Seattle Genetics, and the candidate biosimilars from a local biotechnology company.
Sample Preparation
To a volume corresponding to 100 µg of protein, 105 µL of 0.1% Rapigest in 100 mM Tris-HCl pH 7.5 was added followed by the addition of 100 mM Tris-HCl pH 7.5 to a final volume of 192.5 µL. The sample was subsequently reduced at 60 °C for 30 min by the addition of 5 mM DTT (2.5 µL of 400 mM DTT in 100 mM Tris-HCl) and alkylated at 37 °C for 1 h by adding 10 mM IAA (5 µL of 400 mM IAA in 100 mM Tris-HCl). Digestion proceeded for 16 h at 37 °C using trypsin as protease added at an enzyme to substrate ratio of 1/25 (w/w). Lyophilized trypsin (20 µg) dissolved in 100 mM Tris-HCl (50 µL) was added in a volume of 10 µL giving rise to a final sample volume of 210 µL.
LC–MS
An Ultimate 3000 RSLCnano system (Thermo Fisher Scientific) was used for LC–ultraviolet (UV)–MS measurements. Tryptic digests were analyzed on a 200 cm C18 µPAC column (PharmaFluidics) at 50 °C. Elution was performed with a linear gradient of (A) 0.1% TFA in H2O and (B) 0.1% TFA in 80:20 (v/v) acetonitrile–water, from 2% B to 70% B in 120 min. The flow rate was 500 nL/min. An injection program allowed the introduction of 100-nL sample in between two plugs of mobile phase A. Loop size was 1 µL and samples were kept at 10 °C in the autosampler tray while waiting for injection. UV detection was performed at 214 nm using a 3 nL detection cell.
High-resolution accurate mass measurements were obtained on a 6530 QTOF mass spectrometer (Agilent Technologies) equipped with a dual nano-ESI source operated in positive electrospray ionization mode. The micro-pillar array column was connected via a 30-µm internal diameter (i.d.), 280-µm outside diameter (o.d.) fused silica capillary to a PicoTip emitter (8-µm tip i.d. [New Objective]) via a true zero dead volume conductive union (UH-634 stainless steel adapter from Idex). To connect the PicoTip emitter to the union, an F-330 blind fitting equipped with an M-125 perfluoroelastomer conductive ferrule was used (Idex). Capillary voltage was set at +2.4 kV, drying gas flow rate and temperature were set at 4 L/min and 300 °C, and fragmentor voltage at 175 V. The TOF was calibrated on a daily basis and subsequently operated at high accuracy (<5 ppm) without using reference masses. Data were collected in centroid mode at a rate of 1 spectrum/s in the extended dynamic range mode (2 GHz) offering a resolution of 9000 at mass-to-charge ratio (m/z) 622.0296. MS/MS experiments were performed in the data-dependent acquisition (DDA) mode. One survey MS measurement was complemented with three data-dependent MS/MS measurements. Double, triple, and quadruple charged precursor ions with the Averagine isotope model were selected based on abundance. After being fragmented twice, a particular m/z value was excluded for 30 s. Selecting the same m/z value twice increases the chance of measuring a particular precursor at its maximum intensity while an exclusion time of 30 s allows MS/MS information on chromatographically resolved isomers to be obtained. The quadrupole was operated at medium resolution and the collision energy varied based on the following equation:
(3.6 * m/z)/100 – 4 [1]
All-ions MS/MS experiments were performed at a collision energy of 20 eV. LC data were acquired in Chromeleon (Thermo Fisher Scientific) and MS data in MassHunter (Agilent Technologies). Data analysis was performed in MassHunter Qualitative Analysis with BioConfirm add-on.
Results and Discussion
Characteristics of Micro-Pillar Array Columns
The separation beds of micro-pillar array columns are fabricated by carefully etching the interstitial volumes out of a silicon substrate following lithographic definition of an array of pillars. This creates a stationary phase support structure that is organized in a reproducible and ordered pattern. Concatenation of several of these channels allows long column lengths to be fabricated on a small footprint (22). The most important characteristics of the micro-pillar array separation bed design are: pillar diameter, 5 µm; inter pillar distance, 2.5 µm; pillar length or bed depth, 18 µm; external porosity (Vinterstitial/Vtotal), 59%; bed channel width, 315 µm; and bed length, 200 cm. To increase the retentive surface, the pillars are rendered superficially porous with a typical porous shell thickness of 300 nm and pore sizes in the nanometer range. The porous surface has been uniformly modified with octadecyl alkyl chains to create a hydrophobic stationary phase suited for reversed-phase LC separations. Figure 1 shows some relevant characteristics of the micro-pillar array column.

Figure 1: Micro-pillar array column. From left to right: (left) Top view of two parallel 315-µm wide separation channels that have been interconnected with proprietary flow distributor structures, (middle) SEM image showing a transverse section of a separation channel containing 5-µm diameter cylindrical pillars, (right) HR-SEM image of the 300-nm porous-shell layer incorporated into a 5-µm diameter pillar.
Because of the high permeability, the 200-cm column used in this study can be operated at moderate LC pump pressures (50 to 300 bar) over a wide range of flow rates (100–1000 nL/min). Van Deemter measurements with heptyl-phenyl ketone demonstrated that a total of 400,000 theoretical plates could be generated at the optimal linear solvent velocity, corresponding to a flow rate of 200–250 nL/min and generating a column backpressure of only 70 bar. By increasing the flow rate up to 750 nL/min, efficiencies up to 200,000 theoretical plates could be achieved within 30 min at operating pressures well below 250 bar (mobile phase 50% acetonitrile with 0.1% [v/v] FA).
Peptide Mapping of Herceptin Originator and a Candidate Biosimilar
Herceptin (scientific international nonproprietary names [INN] name trastuzumab) is a humanized IgG1 mAb recombinantly produced in Chinese hamster ovary (CHO) cells and used in the treatment of human epidermal growth factor receptor 2 (HER2) positive breast cancer. Herceptin is open to the European market and evolves out of patent in the US in 2019 (5). Given its market potential (global sales of $6.6 billion in 2015), dozens of companies are actively developing a Herceptin biosimilar. In developing these products, similarity to the originator has to be demonstrated and for that, an enormous weight is placed on analytics; both the biosimilar and originator need to be characterized and compared in great detail. Peptide mapping is a powerful method to characterize and compare mAbs in great detail.
When digesting Herceptin with the enzyme trypsin, which cleaves the protein next to arginine and lysine residues, 62 identity peptides are formed. Taking into account post-translational modifications and incomplete and aspecific cleavages taking place, over 100 peptides with varying physicochemical properties present in a wide dynamic concentration range are to be expected. This is quite a complex sample demanding the best in terms of chromatographic resolution.
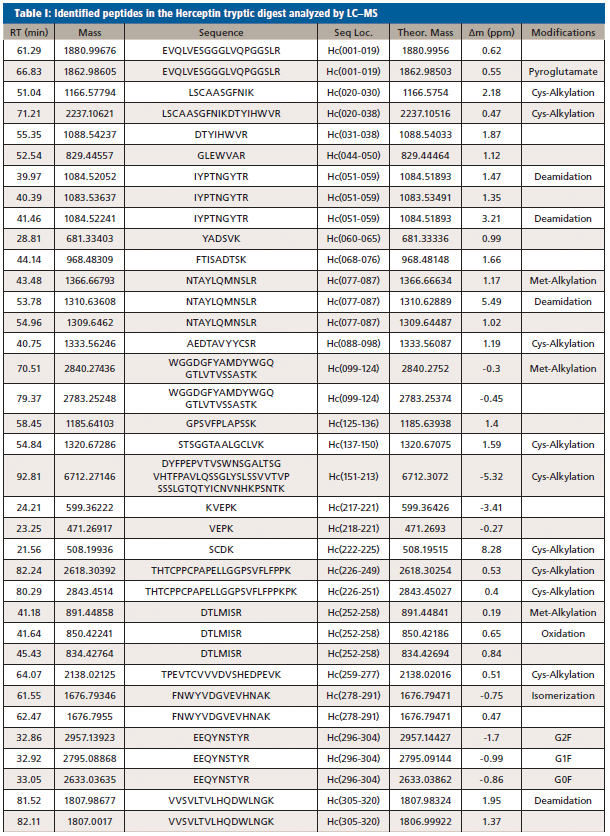
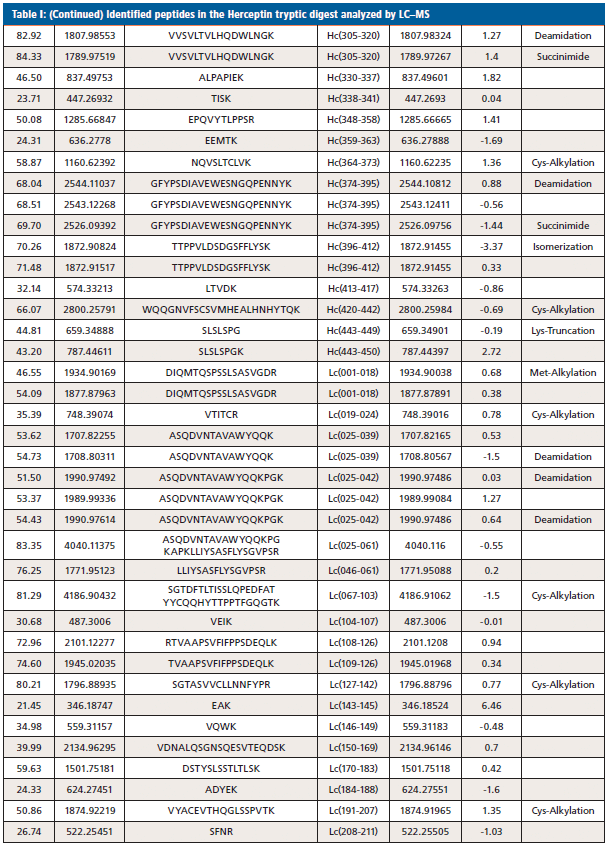
Figure 2(a) shows the LC–MS total compound chromatogram of a Herceptin tryptic digest on a micro-pillar array column. The compound chromatograms corresponding to the identified peptides presented in Table 1 are shown in Figure 2(b). Approximately 95% of the sequence is covered by this peptide map and post-translational modifications such as glycosylation, asparagine deamidation, aspartate isomerization, methionine oxidation, N-terminal cyclization (pyroglutamate), and C-terminal lysine truncation, amongst others, are revealed. Peptides that are not detected are typically small and their signal might be suppressed in the column flow through. The UV 214 nm chromatograms corresponding to replicate analyses (n = 4) of the Herceptin tryptic digest are demonstrated in Figure 3. These measurements are highly precise making this technology attractive to compare different mAb production batches and to compare mAb originator products to biosimilars.
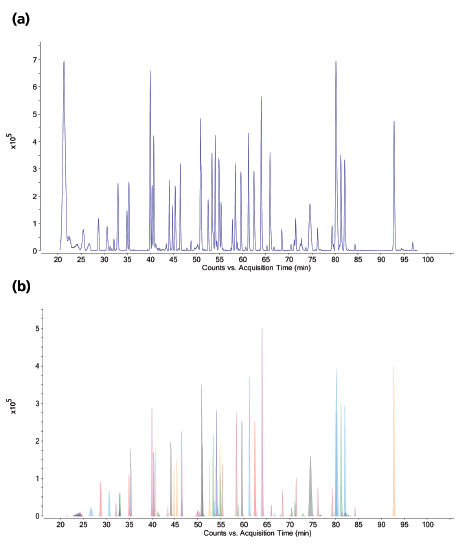
Figure 2: LC-MS chromatograms of a Herceptin tryptic digest. (a) Total compound chromatogram. (b) Compound chromatograms corresponding to the identified peptides presented in Table I.
The LC–MS peptide maps of a Herceptin originator and candidate biosimilar are shown in Figure 4. While both peptide maps are highly comparable, differences in post-translational modifications are detected. This is illustrated in the extracted ion chromatograms presented in Figure 5.
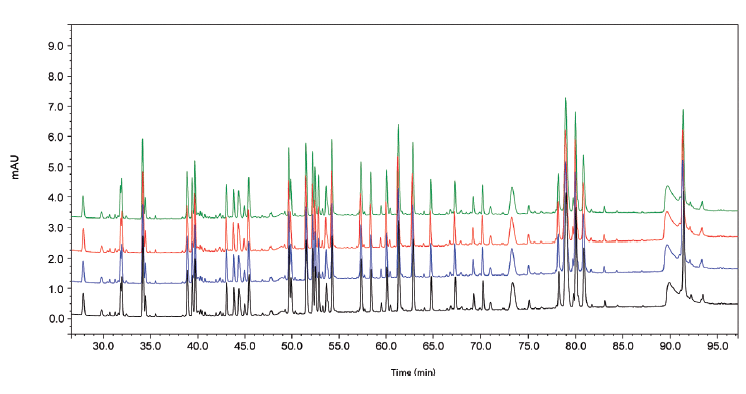
Figure 3: LC-UV 214 nm chromatograms corresponding to the replicate analysis (n = 4) of a Herceptin tryptic digest.
Peptide Mapping of Remicade Originator and Candidate Biosimilar
Remicade (scientific INN name infliximab) is a chimeric IgG1 mAb on the market since 1998 targeting tumour necrosis factor alpha (TNF-α) and consequently used in the treatment of autoimmune diseases. Remicade reached global sales of $8.4 billion in 2015. Several Remicade biosimilars have already been approved both in Europe and the US and many more are in development (8).
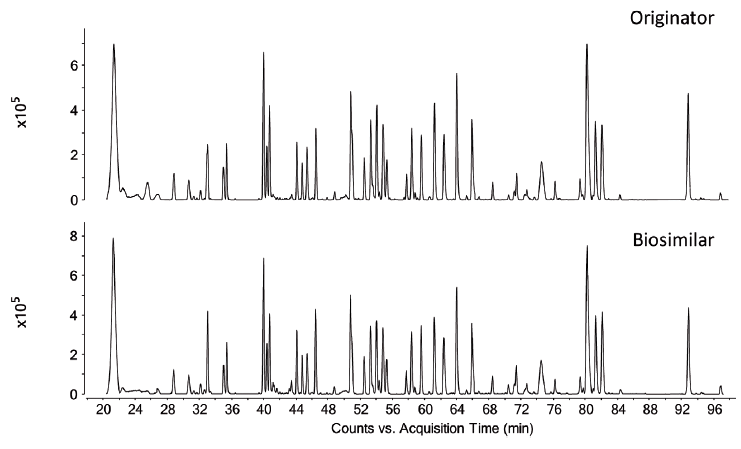
Figure 4: LC-MS total compound chromatograms of a Herceptin originator and candidate biosimilar tryptic digest.
Figures 6 and 7 show the UV and MS total compound chromatograms of a Remicade originator and a candidate biosimilar tryptic digest, respectively. Chromatograms are very similar but some striking differences are noted (peaks 1–5), which can be explained upon consulting the corresponding MS data. Peaks 1 and 2 in the originator chromatogram, corresponding to C-terminal heavy chain peptides SLSLSPGK and SLSLSPG respectively, are replaced by peak 3, corresponding to SLSLSPGI in the biosimilar. The origin of the two peaks SLSLSPG and SLSLSPGK in the originator mAb can be explained by the knowledge that heavy chains are historically cloned with a C-terminal lysine but during cell culture production, host cell carboxypeptidases act on the antibody resulting in the partial removal of these lysine residues. A missense mutation (Lys→Ile) in the CHO clone producing the candidate biosimilar explains peak 3 (SLSLSPGI). Peaks 4 and 5 corresponding to, respectively, heavy chain peptides NYYGSSYDY WGQGTTLTVSSASTK in the candidate biosimilar and NYYGSTYDY WGQGTTLTVSSASTK in the originator again result from a point mutation (Thr→Ser) in the biosimilar CHO clone. The corresponding MS/MS spectra are shown in Figure 8.
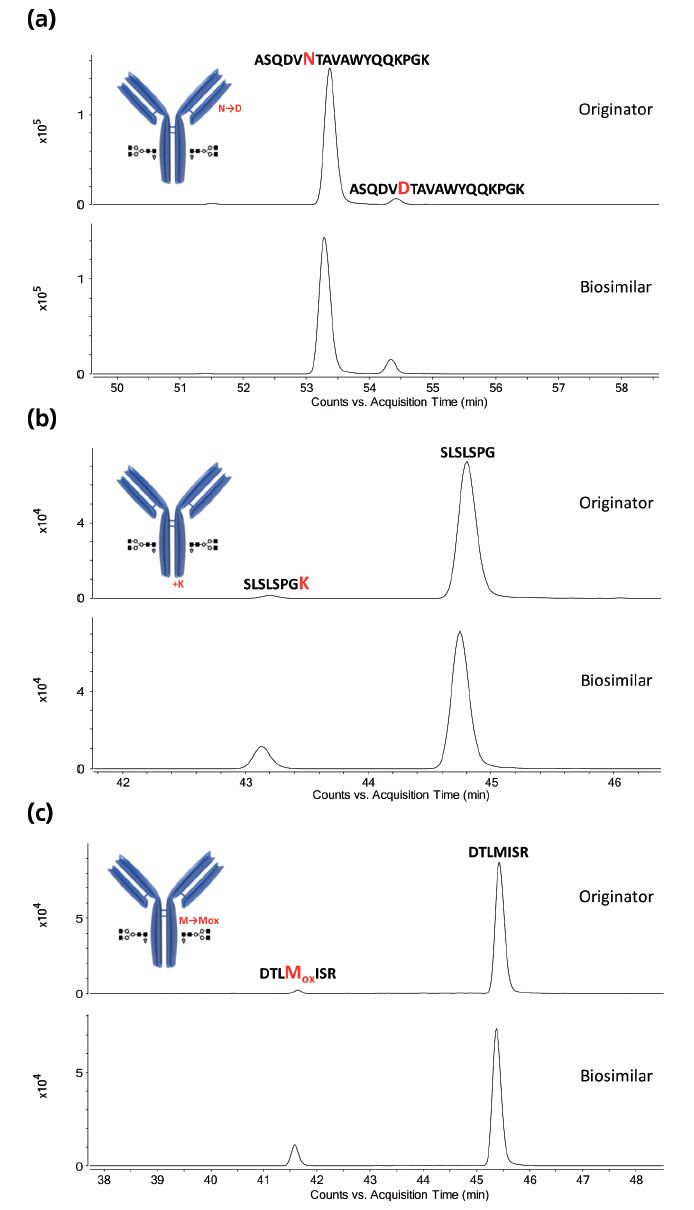
Figure 5: Extracted ion chromatograms of selected modified peptides measured in Herceptin originator and candidate biosimilar. Shown are asparagine deamidation, lysine truncation, and methionine oxidation, which are elevated in the biosimilar compared to the originator. The location of the modifications is highlighted in the antibody structure.
According to US and European regulatory authorities, identical primary sequence is primordial to similarity thereby ruling out this candidate biosimilar from further development.
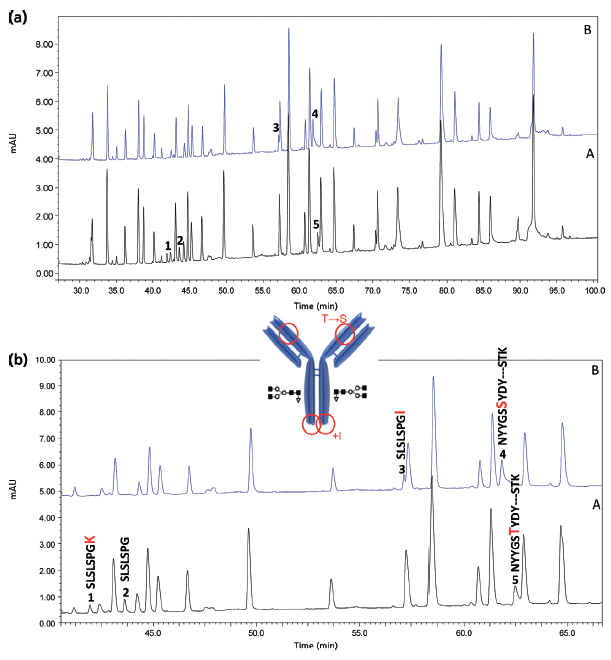
Figure 6: LC-UV 214 nm peptide map of (a) a Remicade originator and (b) a candidate biosimilar tryptic digest. Unzoomed and zoomed views.
Peptide Mapping of the Antibody–Drug Conjugate Kadcyla
The antibody–drug conjugate Kadcyla (ado-trastuzumab emtansine) has been used in the treatment of HER2 positive breast cancer since 2013. It combines the anti-HER2 antibody trastuzumab (Herceptin) with the cytotoxic microtubule-inhibiting maytansine derivative DM1 conjugated to lysine residues via a non-reducible thioether linker. With a drug distribution of 0 to 8, a drug-to-antibody ratio (DAR) of 3.5, and various lysine residues available for conjugation, thousands of species can be generated. To obtain insight in the drug conjugation sites, peptide mapping is the gold standard technology.
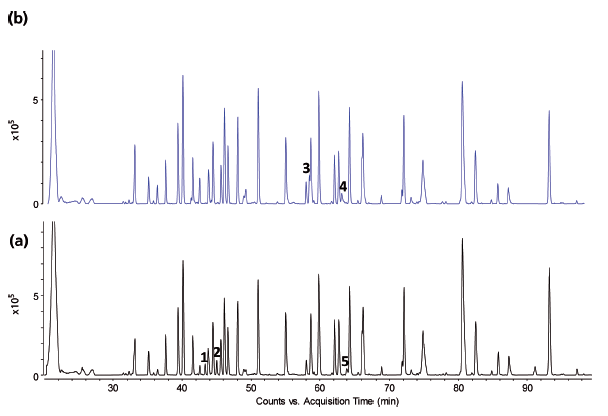
Figure 7: LC-MS total compound chromatograms of (a) a Remicade originator and (b) a candidate biosimilar tryptic digest. MS/MS spectra associated with peaks 4 and 5 are presented in Figure 8.
Figures 9 and 10 show, respectively, the LC–UV and MS total compound chromatograms of a Herceptin and Kadcyla tryptic digest. Since Herceptin and Kadcyla have the same amino acid sequence, the majority of the peptide map is identical. Differentiating peaks, corresponding to the DM1 conjugated peptides, are nevertheless observed and are located in the late eluting part of the chromatogram. Indeed, the conjugation of DM1 makes the peptides more hydrophobic explaining the elution behavior. Upon collision-induced dissociation (CID), DM1 conjugated peptides give rise to specific fragments originating from the cytotoxic drug, for example, at m/z 547.2206. This ion can be used to selectively recognize DM1 conjugated peptides in the LC–MS chromatogram. For that, one can operate the QTOF-MS system in the all-ions MS/MS mode, which means that the quadrupole is operated in the RF only mode, thereby transferring all peptides to the collision cell where CID takes place. As illustrated in Figure 11, when extracting from the data the specific fragment ion at m/z 547.2206 at high mass accuracy, all conjugated peptides are revealed in the chromatogram of Kadcyla compared to Herceptin. The latter chromatogram is virtually empty, illustrating the selectivity that is offered by this all-ions MS/MS functionality.
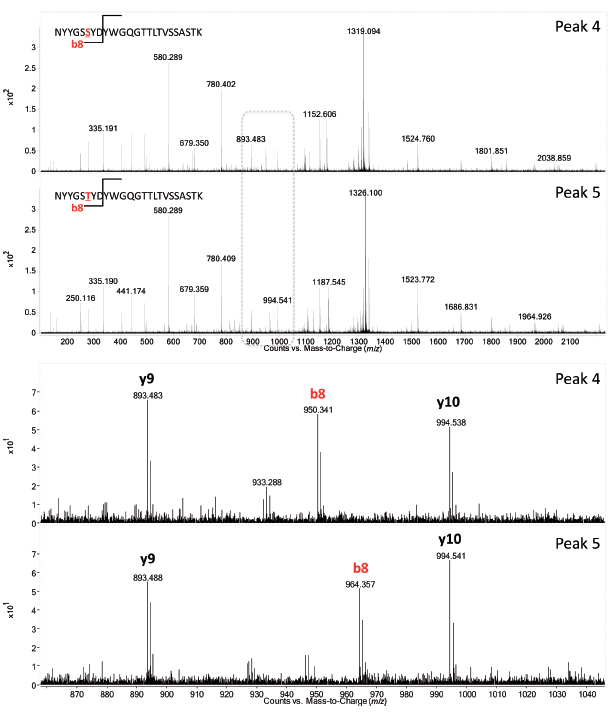
Figure 8: LC-MS/MS spectra of peak 4 and 5 (Figure 7) acquired on the fly in data-dependent MS/MS mode confirming the threonine to serine substitution in the variable part of the heavy chain.
Figure 12 shows the extracted ion chromatograms associated with a selection of identified conjugated peptides. A striking observation is the appearance of isomeric DM1 conjugated peptides, which can be explained by the existence of two stereochemical configurations (diastereomers) of the antibody–drug linkage through maleimide.
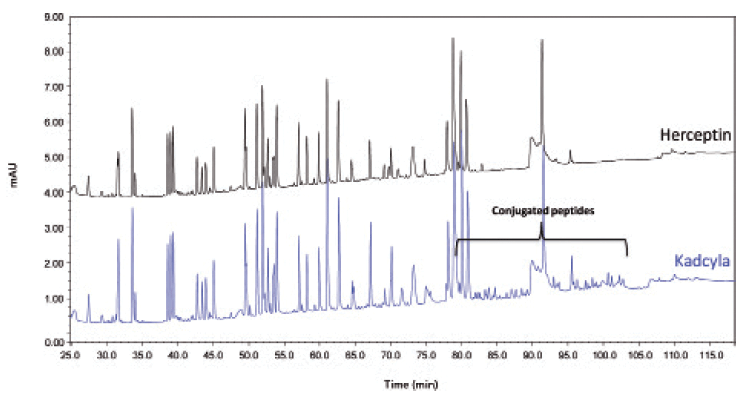
Figure 9: LC–UV 214 nm peptide map of Herceptin and Kadcyla.
Peptide Mapping of the Antibody–Drug Conjugate Adcetris
A similar strategy was applied to reveal the conjugation sites on Adcetris (brentuximab-vedotin). Approved in 2011, this ADC is directed to CD30, a major marker of Hodgkin lymphoma and systemic anaplastic large cell lymphoma (ALCL). Adcetris combines the antibody brentuximab with the antimitotic drug monomethylauristatin E (MMAE) conjugated to interchain cysteine residues via a cathepsin cleavable valine-citrulline linker. With only eight residues (four on each half antibody) available for conjugation, Adcetris is much simpler compared to Kadcyla.
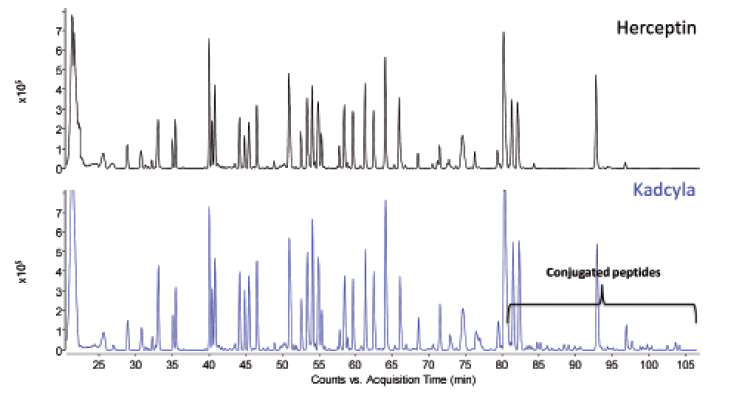
Figure 10: LC-MS peptide map of Herceptin and Kadcyla.
Figure 13 shows the LC–MS total compound chromatogram and the all-ions MS/MS chromatogram of an Adcetris tryptic digest, respectively. In analogy to DM1 conjugated peptides, MMAE conjugated peptides also contain specific fragment ions originating from the cytotoxic molecule, that is, at m/z 718.5113. When extracting the latter ion from the all-ions MS/MS data, the conjugated peptides are revealed. Three intense peaks explaining the full conjugation of MMAE at the four interchain cysteine residues in light chain peptide GEC (peak 2), heavy chain peptides SCDK (peak 1), and THTCPPCPA PELLGGPSVFLFPPKPK (peak 3) are observed. Of particular interest is the detection of isomeric partially conjugated heavy chain peptide THTCPPCPAP ELLGGPSVFLFPPKPK (peaks a and b), in which only one of the two cysteine residues is conjugated.
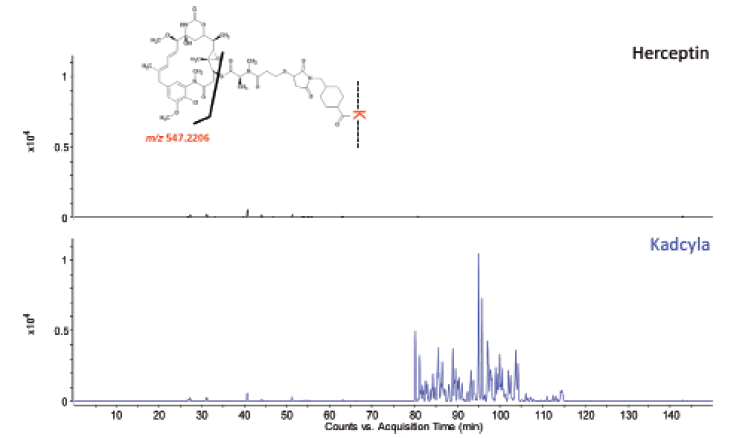
Figure 11: All-ions MS/MS chromatograms of the Herceptin and Kadcyla tryptic digest. The ion at m/z 547.2206 was extracted at high mass accuracy.
Conclusions
In the 21st century, numerous novel developments were made in LC column technology and the best known are columns packed with sub-2-µm porous particles or sub-3-µm superficially particles. Micro-pillar array columns are another novel development offering highly efficient separations. In this article, the use of the micro-pillar array column in mAb and ADC peptide mapping has been illustrated. In combination with high resolution mass spectrometry, high sequence coverage is obtained and post-translational modifications such as glycosylation, deamidation, isomerization, oxidation, N-terminal cyclization, and C-terminal lysine truncation can be elucidated. Its use in assessing comparability between an originator and biosimilar mAb has furthermore been demonstrated. The resolving power offered by a micro-pillar array column allows an in-depth study of ADC conjugation sites and accommodates the separation of isomeric conjugated peptides. In combination with all-ions MS/MS, conjugated peptides can selectively be recognized to assist data interpretation.
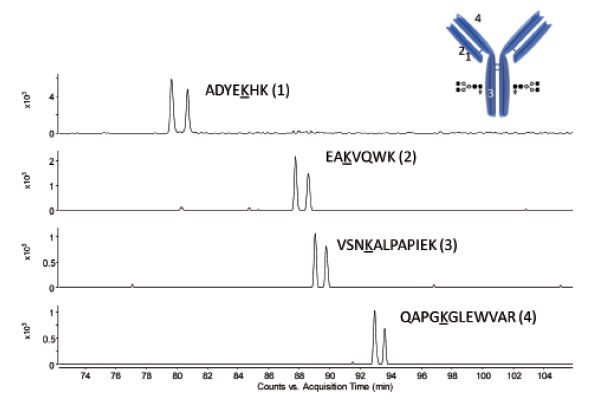
Figure 12: Extracted ion chromatograms of selected peptides showing the appearance of isomeric conjugated peptides. The location of the conjugation site in the mAb structure is shown as well.
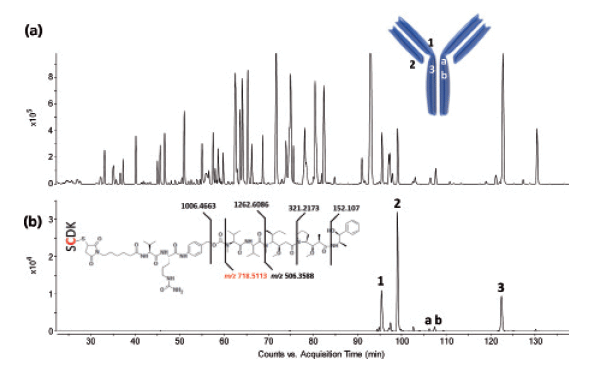
Figure 13: LC-MS peptide map of Adcetris. (a) Total compound chromatogram and (b) all-ions MS/MS chromatogram. The ion at m/z 718.5113 was extracted at high mass accuracy. The location of the conjugation site in the mAb structure is shown as well.
References
(1) G. Kö hler and C. Milstein, Nature 256, 495–497 (1975).
(2) N.A.P.S. Buss, S.J. Henderson, M. McFarlane, J.M. Shenton, and L. de Haan, Curr. Opin. Pharmacol. 8, 620–626 (2012).
(3) J.G. Elvin, R.G. Couston, and C.F. van der Walle, Int. J. Pharm. 440, 83–98 (2013).
(4) D.M. Ecker, S.D. Jones, and H.L. Levine, mAbs 7, 9–14 (2015).
(5) G. Walsh, Nat. Biotechnol. 32, 992–1000 (2014).
(6) H. Kaplon and J.M. Reichert, mAbs 10, 183–203 (2018).
(7) K. Sandra, I. Vandenheede, E. Dumont, and P. Sandra, LCGC Europe 28(s10), 16–23 (2015).
(8) A. Beck and J.M. Reichert, mAbs 5, 621–623 (2013).
(9) S. Panowski, S. Bhakta, H. Raab, P. Polakis, and J.R. Junutula, mAbs 6, 34–45 (2014).
(10) A. Wakankar, Y. Chen, Y. Gokarn, and F.S. Jacobson, mAbs 3, 161–172 (2011).
(11) A. Beck and J.M. Reichert, mAbs 6, 15–17 (2014).
(12) A. Beck, L. Goetsch, C. Dumontet, and N. Corvaia, Nat. Rev. Drug Discov. 16, 315–337 (2017).
(13) A. Beck, E. Wagner-Rousset, D. Ayoub, A. Van Dorsselaer, and S. Sanglier-Cianférani, Anal. Chem. 85, 715–736 (2013).
(14) K. Sandra, I. Vandenheede, and P. Sandra, J. Chromatogr. A 1335, 81–103 (2014).
(15) S. Fekete, D. Guillarme, P. Sandra, and K. Sandra, Anal. Chem. 88, 480–507 (2016).
(16) D.J. Kroon, A. Baldwin-Ferro, and P. Lalan, Pharm. Res. 9, 1386–1393 (1992).
(17) B. He, N. Tait, and F. Regnier, Anal. Chem. 70, 3790–3797 (1998).
(18) F. Regnier, J. High Resol. Chromatogr. 23, 19–26 (2000).
(19) J.H. Knox, J. Chromatogr. A 960, 7–18 (2002).
(20) P. Gzil, N. Vervoort, G. Baron, and G. Desmet, Anal. Chem. 75, 6244–6250 (2003).
(21) W. De Malsche, H. Gardeniers, and G. Desmet, Anal. Chem. 80, 5391–5400 (2008).
(22) W. De Malsche, J. Op de Beeck, S. De Bruyne, H. Gardeniers, and G. Desmet, Anal. Chem. 84, 1214–1219 (2012).
Koen Sandra is the editor of "Biopharmaceutical Perspectives". He is the Scientific Director at the Research Institute for Chromatography (RIC, Kortrijk, Belgium) and the R&D Director at anaRIC biologics (Ghent, Belgium). Jonathan Vandenbussche is an LC–MS Technician at RIC. Isabel Vandenheede is a Project Manager Biologics at RIC. Bo Claerebout is R&D Engineer at PharmaFluidics, in Ghent, Belgium. Jeff Op de Beeck is an Application Development Manager at PharmaFluidics. Paul Jacobs is the Chief Operating Officer (COO) at and co-founder of PharmaFluidics. Wim De Malsche is an Associate Professor at the Department of Chemical Engineering at the Vrije Universiteit Brussel, in Belgium, and the co-founder of PharmaFluidics. Gert Desmet is a Full Professor in Chemical Engineering at the Vrije Universiteit Brussel, Belgium, and a co-founder of PharmaFluidics. Pat Sandra is the President of RIC and Emeritus Professor at Ghent University.

Removing Double-Stranded RNA Impurities Using Chromatography
April 8th 2025Researchers from Agency for Science, Technology and Research in Singapore recently published a review article exploring how chromatography can be used to remove double-stranded RNA impurities during mRNA therapeutics production.


