A New Method for Quality by Design Robust Optimization in Liquid Chromatography
LCGC Europe
A new method to optimize liquid chromatography (LC) methods using a Quality by Design (QbD) approach is presented. This method is based on the use of design of experiments (DOE) and independent component analysis (ICA) to accurately estimate the modeled responses (that is, the retention times at the beginning, the apex, and the end) of each peak, even for coeluted peaks. This method was applied to the optimization of the separation of nine compounds in a mixture, yielding the design space and the demonstration of robustness of the method.
A new method to optimize liquid chromatography (LC) methods using a Quality by Design (QbD) approach is presented. This method is based on the use of design of experiments (DOE) and independent component analysis (ICA) to accurately estimate the modelled responses (that is, the retention times at the beginning, the apex, and the end) of each peak, even for coeluted peaks. The modelling of these responses uses multiple linear regressions, while the propagation of the error affecting the responses and coming from the models is performed by Monte Carlo simulation. The design space is determined as the region of assay factors where the probability to reach baseline-resolved peaks is higher than the desired level of quality. This method was applied to the optimization of the separation of nine compounds in a mixture, yielding the design space and the demonstration of robustness of the method. Finally, the method was validated.
The International Conference on Harmonization (ICH) defined, Quality by Design (QbD) as "a systematic approach to development that begins with predefined objectives and emphasizes product and process understanding and process control, based on sound science and quality risk management" (1). In liquid chromatography (LC) method development, the tools used to set up a QbD-compliant approach should be systematic and should lead to process understanding (that is, the chromatographic behaviour of each compound and therefore the separation) and control. Design of experiments (DoE) is a systematic approach to process development that models LC method responses as a function of pre-defined LC method factors while optimizing some LC method critical quality attributes (CQAs). With its related modelling methodology, DoE is therefore an appropriate systematic approach to perform QbD-compliant LC method development.

ICH further defines design space (DS) as "the multidimensional combination and interaction of input variables (for example, material attributes) and process parameters that have been demonstrated to provide assurance of quality" (1). For an LC method this might be the region in important operating factors which yields optimal separation. The optimal operating conditions should be defined by a zone of assurance of quality, rather than by a single experimental condition.
A major concept in the definition of DS is the multidimensional combination and interaction of input variables. Therefore, the DS is a sub-region of the experimental domain (also known as the knowledge space) where the process is well understood in regards to the effects and interactions of the operating factors and where an LC method CQA achieves an acceptable level of performance. Another concept is the assurance of quality. This can be demonstrated by the computation of the probability that the LC method CQA will fall within a predefined set of acceptance limits. Therefore, it is important to differentiate prediction of quality and prediction of assurance of quality. In the LC framework, to predict a resolution (RS) greater than 1.5 is inadequate alone to be QbD or DS-compliant. In order to include the concept of assurance of quality, the probability for RS to be greater than 1.5 [P(RS> 1.5)] should also be estimated.
In this article, an innovative method development approach based on DoE and predictive probability is illustrated. This approach (2) makes uses of Monte Carlo simulations to compute the predictive probability for a given CQA to be within acceptance limits or to be greater than or less than a desired threshold. The optimization of the separation of a mixture of nine compounds was performed to illustrate the approach and the method was validated.
Methodology
Responses and Critical Quality Attributes: When using DoE, the first critical step is the selection of the response. Responses should be selected based on the impact on LC measurement. Each response is modelled by a linear equation. The retention times at the beginning, the apex, and the end (tB, tR, and tE respectively) of each peak were measured. The logarithm of the retention factor (ktR = (tR- t0)/t0) and the logarithm of the half-widths (wl = ktR - ktB and wr = ktE - ktR) were chosen as the responses to be modelled. RS was not used as a modelled response because it is discontinuous when the elution order of peaks changes. However, RS can be used as a CQA that represents the quality of the separation and which is computed from the modelled retention times. A simpler CQA is the separation criterion (S), defined as the difference between the beginning of the second peak and the end of the first peak of the critical pair (that is, the two most proximate peaks). If S ≥ 0, the peaks are baseline-resolved. S has the advantage of being easy to interpret and to visualize on a chromatogram. Other CQAs such as the analysis time (that is, the retention time of the last peak), the asymmetry of a peak, or other chromatographic properties can also be utilized.
Experimental Factors and their Levels: The choice of the factors is directly related to the choice of the responses and the CQA. The factors need to significantly affect the responses and therefore the CQA to be optimized. For an optimization process, two or three factors can be selected. When more factors could affect the responses, a screening design should be performed to select those that have the most important effects before the optimization. In the present study, the gradient time (tG — from 5% to 95% of methanol) was selected because it is known to affect the separation of the compounds and the analysis time. The pH of the aqueous part of the mobile phase was the second factor of the DoE because it has an important effect on selectivity.
The number of levels for each factor is selected to support the order of the modelling equation. For example, two levels support a first-order linear model, three levels support quadratic modelling, and so on. As the theoretical variation of retention times versus pH is sigmoidal, the number of levels of pH was five (pH 2.6, 4.4, 6.3, 8.1, and 10.0) to support a fourth-order equation and accurately model the retention times. Three levels of tG were selected (10, 20, and 30 min) to support the second-order term and model the quadratic variation of tR versus tG. The experimental domain was deliberately large to minimize the risk of not containing the region of optimal separation.
Experimental Design: Many DoE can be considered such as full or fractional factorial designs, central composite designs, or D-optimal designs. The DoE should have good orthogonality and rotatability properties and allow the estimation of the main effects (that is, tG, tG2, pH, pH2,..., pH4) and the simple-order interactions (tG × pH). A full-factorial design (5 × 3) was selected because it supports the estimation of all potential main effects and interactions. The design is comprised of fifteen operating conditions, and the operating condition at the centre of the design (tG = 20 min and pH = 6.3) was repeated twice to estimate the repeatability of the method.
Independent Component Analysis: As coelution occurred under many of the experimental conditions, the measured tB, tR, and tE for coeluting peaks were biased. To overcome this problem, independent component analysis (ICA) was used (3). ICA is a blind source separation technique which allows the independent components from a ultraviolet–diode array detection (UV–DAD) chromatogram to be estimated. ICA has already been successfully used on this type of chromatogram to numerically separate coeluting peaks and to estimate the number of compounds in an unknown mixture (4). ICA was used to numerically separate coeluting peaks to obtain unbiased estimates of tB, tR, and tE, and to resolve the number of compounds in the mixture. Concretely, the FastICA algorithm was used.
Modelling of the Responses: The responses were modelled by equation 1. A stepwise regression maximizing the adjusted coefficient of determination was performed to obtain one model for each response and each peak.

In equation 1, log(k) represents the response [that is, log(ktR), log(wl) or log(wr)], β0...β7 are the parameters of the model and ε is the estimated error of the model (the residuals). Lack-of-fit tests were carried out on each model. X2 and anova tests were also performed and confirmed the models adequacy (p-values > 0.05).
Error Propagation and Design Space Computation: To predict assurance of quality, the error affecting the predicted responses and coming from the models was propagated to the predicted responses using Monte Carlo simulations (5–8). A zero-centred Gaussian distribution with a variance equal to the variance of the residuals was generated. For each operating condition of the experimental domain, the error distribution was added to the mean predicted responses to obtain the distribution of tB, tR, and tE for all the peaks. A distribution of the CQA (that is, S = tB,2 – tE,1 with 1 and 2, the two peaks of the critical pair) was then obtained for each operating condition of the experimental domain. The probability for S to be greater than 0 was calculated to represent assurance of quality of the studied separation. Responses surfaces (or CQA surfaces) were thus replaced by predictive probability surfaces. The DS is formally defined by equation 2.

In equation 2, x0 is a point of the experimental domain, X. S is the CQA, the separation criterion. λ is the threshold of S (0 in this case), Φ is the set of estimated parameters of the model, and π is the desired quality level (85% in this case). P and E correspond to the operands of probability and mathematical expectation, respectively.
The DS is therefore the region of the experimental domain where the probability of obtaining baseline-resolved peaks (S > 0) is higher than the desired quality level (85%).
Experimental
Chemicals: Methanol was HPLC-grade and purchased from Sigma-Aldrich. Ultrapure water was obtained using a Millipore Milli-Q Academic A10 (Merck Millipore). Formic acid (> 98%) was purchased from the Merck Group, ammonium formate (99%) was purchased from Alfa Aesar, and ammonium hydrogen-carbonate (99.7%) was purchased from VWR. The experimental sample was provided by Eli Lilly & Co., and contained atenolol, pindolol, a licensed compound, warfarin, indoprofen, naproxen, propranolol, an impurity of retinoic acid, and retinoic acid.

Figure 1: Example of numerical separation of coeluted peaks using independent component analysis (ICA). (a) Original recorded chromatogram, (b) corresponding independent components.
Sample Preparation: The sample was provided in solution and was a mixture of water–acetonitrile (50:50, v/v). The solution was filtered with a 0.20 µm PTFE syringe filtration disk (VWR International) into a vial for injection in the HPLC system. The injection volume was 0.5 µL.
HPLC Equipment: The separations were carried out on an Alliance 2695 separation module coupled with an UV–DAD 2996 detector from (Waters). The analytical column was a 100 mm × 2.1 mm, 3.5 µm, XBridge C18 (Waters). The experiments were carried out at a flow rate of 0.25 mL/min at 30 °C. The chromatograms were recorded between 210 nm and 400 nm with a resolution of 1.2 nm and an acquisition frequency of 2 Hz. The peak integration was carried out at 280 nm. The integration of coeluting peaks was performed on the respective independent components obtained by FastICA [see example on Figure 1(b)].
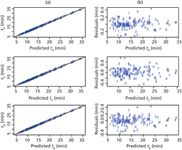
Figure 2: Results of modelling for the nine compounds. (a) Experimental versus predicted retention times for tR, tE, and tB. (b) Corresponding residuals plots. Compounds assignation: 1 = atenolol, 2 = pindolol, 3 = a licensed compound, 4 = warfarin, 5 = indoprofen, 6 = naproxen, 7 = propranolol, 8 = an impurity of retinoic acid, 9 = retinoic acid.
Validation: The validation was performed at five concentration levels: 30, 40, 50, 60, and 70 µg/mL. Atenolol (98%) and indoprofen standards (99%) were purchased from Sigma. Propranolol (99.4%) was purchased from Merck. Pindolol (99.5%) was purchased from Dr. Ehrenstorfer GmbH. Naproxen (99%) and warfarin (100%) were purchased from Cayman Europe.

Figure 3: (a) Chromatogram predicted at pH 3.1 and tG = 30 min. (b) Chromatogram recorded at pH 3.1 and tG = 30 min. Compounds assignation: 1 = atenolol, 2 = pindolol, 3 = a licensed compound, 4 = warfarin, 5 = indoprofen, 6 = naproxen, 7 = propranolol, 8 = an impurity of retinoic acid, 9 = retinoic acid.
Results and Discussion
Independent Component Analysis: ICA was performed on each chromatogram and the nine compounds were automatically detected even if coeluting. An example of ICA numerical separation for non-separated peaks is shown in Figure 1.

Table 1: Adjusted coefficient of determination (R2adj) and residuals standard deviation (Ï) for the logarithm of the retention factors [log(ktR)], for the left half-width [log(wl)] and for the right half-width [log(wr)].
Responses Modelling: The responses were modelled by equation 1 using stepwise regression. The final adjusted coefficient of determination and the standard deviation for the three responses are summarized in Table 1. The retention times are well fit by the final model, with coefficients of determination (R2) above 0.99. For half-widths, some coefficients of determination are lower (for example, 0.372 for the logarithm of the right half-width of retinoic acid). These low values do not indicate a poor fit but rather that these half-widths are weakly influenced by the modification of the gradient time and the pH (that is, a weak effect of the factors on response). Plots of experimental versus predicted retention times and the corresponding residuals are presented in Figure 2. A Shapiro-Wilk test was performed on the residuals of each fit to ensure the normality of the residuals. There was no evidence of lack of normality of the residuals for any of the fits (p-values > 0.05).
Optimal Separation: A grid search was performed to identify the levels of pH and tG predicted to yield optimal separation. A grid of 2091 points (51 levels of pH from 2.6 to 10.0 and 41 levels of tG from 10 min to 30 min) was used to compute the probability that the separation criterion is greater than 0, P(S > 0). The optimal predicted separation was found at pH 3.1 with a gradient time of 30 min with P (S > 0) = 89%. The predicted and the experimental chromatograms are shown in Figure 3.
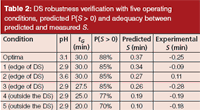
Table 2: DS robustness verification with five operating conditions, predicted P(S > 0) and adequacy between predicted and measured S.
Design Space and Robustness: The design space was defined with a quality level of 85% (that is, the probability that the separation criterion is greater than 0 is greater than or equal to 0.85). Figure 4 presents the predictive probability surface based upon P(S > 0), over the all experimental domain. The DS is circled in white. To verify the robustness defined by the DS, three operating conditions were selected on the edge of the DS and two outside the DS. These operating conditions are summarized in Table 2. The predicted and measured S are presented. Predicted values were higher than experimental values. These differences may be because the beginning and end of each peak have an error which has a double origin. tB and tE were computed from the logarithm of the corresponding half-width with their respective errors, and from tR which also comes with this respective error. Therefore, in the present study, S was slightly overestimated. Nevertheless, the predictions were, on average, accurate and the optimal separation was very good.

Figure 5: (a) Chromatogram recorded at pH 2.9 and tG = 30 min (at the edge of the DS). (b) Chromatogram recorded at pH 2.9 and tG = 27.5 min (at the edge of the DS). (c) Chromatogram recorded at pH 2.9 and tG = 20 min (outside the DS). Compounds assignation: 1 = atenolol, 2 = pindolol, 3 = a licensed compound, 4 = warfarin, 5 = indoprofen, 6 = naproxen, 7 = propranolol, 8 = an impurity of retinoic acid, 9 = retinoic acid.
Two peaks were slightly coeluting at the operating conditions outside the DS. The chromatograms of three conditions (numbered 1, 3, and 5 in Table 2) are shown in Figure 5. These results show that within the DS the separations are acceptable and comparable to the optima. The chromatograms recorded outside the DS (numbered 4 and 5 in Table 2) show poor separation.
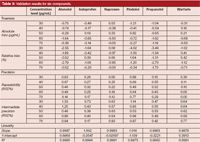
Table 3: Validation results for six compounds.
Validation Results: The method validation was performed following the ICH Q2 requirements (9) using the accuracy profile approach based on β-expectation tolerance intervals for the total error measurement (10–12). The method was validated for six compounds. The calibration models were simple linear regressions for atenolol, indoprofen, naproxen, pindolol, and warfarin; a linear regression through 0 fitted with the highest concentration level of the calibration standard for propranolol only. The results of the validations are presented in Table 3. The trueness was good because the absolute value of the relative bias (%) never exceeded 5%. The precision is expressed in terms of relative standard deviations (RSD) for the repeatability and the intermediate precision. The RSD were all lower than 1.5%. The accuracy is presented as accuracy profiles (13,14). To remain concise, the accuracy profile of indoprofen only is presented in Figure 6. For the six compounds studied during validation, the 95% β-expectation tolerance interval limits were all comprised within the ±5% acceptance limits meaning that the chromatographic method is valid for the quantification of these six drugs.
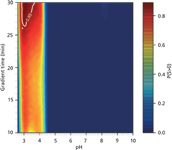
Figure 4: Predictive probability surface to have S > 0. The design space (DS) is circled in white for a quality level of 85%.
Conclusions
The optimization of chromatographic separation is a critical step in the development of chromatographic methods. In the present study, DoE, ICA, multiple linear regression, error propagation, and DS methods were successfully applied to optimize separation of a mixture of nine compounds. The method identifies conditions for optimal separation and the corresponding DS based on predictive probability. Follow-up experiments demonstrate the robustness of the method within the DS. Finally, the validation of the optimized method was successful.
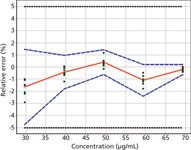
Figure 6: Accuracy profile obtained for the validation of indoprofen. The red line represents the relative bias. The dashed blue lines correspond to the 95% β-expectation tolerance interval and the black dotted lines present the ±5% acceptation limits.
Benjamin Debrus is a postdoctoral researcher at the University of Geneva in Switzerland. He carried out his Ph.D. in pharmaceutical sciences at the University of Liège (ULg), Belgium, where he specialized in analytical chemistry and chemometry.
Pierre Lebrun studied computer science and statistics at the University of Louvain-la-Neuve, Belgium, where
he is now a lecturer. He gained his Ph.D. in biostatistics from the Laboratory of Analytical Chemistry at ULg. He now works for Arlenda, a company specialized in advanced statistics, developing software and related tools.
Eric Rozet is a postdoctoral researcher at the Laboratory of Analytical Chemistry at ULg. His experience lies in the statistics applied to the different steps of the lifecycle of an analytical method: Robust optimization, validation, transfer, inter-laboratories studies, and uncertainty assessment.
Timothy Schofield is a senior fellow and head of regulatory sciences in the Analytical Biochemisty Department at MedImmune (Washington D.C. Metro, USA) and co-chair of the Statistics Expert Committee at USP. He was the managing director at Arlenda Inc. in the USA, and the director of US Regulatory Affairs at GlaxoSmithKline Biologicals.
Jérémie Mbinze Kindenge is a Ph.D. student of Professor Hubert at the Laboratory of Analytical Chemistry at ULg. He is a senior assistant in the Department of Drug Analysis and Galenic of Faculty of Pharmaceutical Sciences at the University of Kinshasa in the Democratic Republic of Congo.
Roland Marini Djang'eing'a is a postdoctoral research fellow at the University of Liege, Belgium. He has conducted several scientific works on the development of analytical LC and CE methods, submitting them to international collaborative studies (ISO-5725) and applying them to fight against drug counterfeiting.
Serge Rudaz is a professor at the University of Geneva, Switzerland. His interests lie in UHPLC, HPLC, CE coupled to MS, analysis of pharmaceuticals, chiral substances, biological matrices, clinical studies, doping and toxicological analysis, validation and regulation of standards (GLP, ISO), and various chemometrics aspects including experimental design and data mining for metabolomics.
Bruno Boulanger is CEO of Arlenda, Belgium, and a senior lecturer at the Université of Liège, Belgium. He holds a Ph.D. in experimental psychology from the University of Liège and carried out his post doctoral research in statistics applied to simulation of clinical trials at the Université Catholique de Louvain in Belgium, and the University of Minneapolis in the USA.
Philippe Hubert is a professor of analytical chemistry and head of the Department of Pharmaceutical Sciences at ULg. His research focuses on separation sciences for the determination of active ingredients in various matrices, vibrational spectroscopy (near-infrared and Raman spectroscopy) in the framework of the United States Food and Drug Administration's (FDA's) Process Analytical Technology (PAT), and validation and chemometrics aspects including experimental design and quality by design.
References
(1) International Conference on Harmonization (ICH) of Technical Requirements for Registration of Pharmaceuticals for Human Use, Topic Q8 (R2): Pharmaceutical Development (ICH, Geneva, Switzerland, 2009).
(2) P. Lebrun, B. Govaerts, B. Debrus, A. Ceccato, G. Caliaro, Ph. Hubert, and B. Boulanger, Chemom. Intell. Lab. Syst. 91(1), 4–16 (2008).
(3) A. Hyvärinen, J. Karhunen, and E. Oja, Independent Component Analysis (Wiley, New York, USA, 2001).
(4) B. Debrus, P. Lebrun, A. Ceccato, G. Caliaro, B. Govaerts, B.A. Olsen, E. Rozet, B. Boulanger, and Ph. Hubert, Talanta, 79(1), 77–85 (2009).
(5) J.J. Peterson and K. Lief, Stat. Biopharm. Res. 2(2), 249–259 (2010).
(6) J.J. Peterson, J. Qual. Technol. 36(2), 139–153 (2004).
(7) J.J. Peterson and M. Yahyah, Stat. Biopharm. Res. 1(4), 441–449 (2009).
(8) R. Rajagopal and E. del Castillo, J. Oper. Res. Soc. 58(6),
779–790 (2007).
(9) International Conference on Harmonization (ICH) of Technical Requirements for registration of Pharmaceuticals for Human Use, Topic Q2 (R1): Validation of Analytical Procedures: Text and Methodology (Geneva, Switzerland, 2005).
(10) P. Chiap, Ph. Hubert, B. Boulanger, and J. Crommen, Anal. Chim. Acta 391(2), 227–238 (1999).
(11) A. Bouabidi, E. Rozet, M. Fillet, E. Ziemons, E. Chapuzet, B. Mertens, R. Klinkenberg, and Ph. Hubert, J. Chromatogr. A 1217(19), 3180–3192 (2010).
(12) J. Mantanus, E. Ziémons, P. Lebrun, E. Rozet, R. Klinkenberg, B. Streel, B. Evrard, and Ph. Hubert, Talanta 80(5), 1750–1757 (2010).
(13) B. Boulanger, E. Rozet, F. Moonen, S. Rudaz, and Ph. Hubert, J. Chromatogr. B 877(23), 2235–2243 (2009).
(14) E. Rozet, R.D. Marini, E. Ziemons, B. Boulanger, and Ph. Hubert, J. Pharm. Biomed. Anal. 55(4), 848–858 (2011).

Extracting Estrogenic Hormones Using Rotating Disk and Modified Clays
April 14th 2025University of Caldas and University of Chile researchers extracted estrogenic hormones from wastewater samples using rotating disk sorption extraction. After extraction, the concentrated analytes were measured using liquid chromatography coupled with photodiode array detection (HPLC-PDA).
Polysorbate Quantification and Degradation Analysis via LC and Charged Aerosol Detection
April 9th 2025Scientists from ThermoFisher Scientific published a review article in the Journal of Chromatography A that provided an overview of HPLC analysis using charged aerosol detection can help with polysorbate quantification.
Removing Double-Stranded RNA Impurities Using Chromatography
April 8th 2025Researchers from Agency for Science, Technology and Research in Singapore recently published a review article exploring how chromatography can be used to remove double-stranded RNA impurities during mRNA therapeutics production.


