Minimizing Method-Induced Deamidation and Isomerization During Antibody Characterization to Ensure Optimal Understanding of Product Quality Attributes
Special Issues
A new peptide mapping method was developed specifically for mAb characterization that employs optimal enzyme pH for robustness, but with short digestion times and time-course elements to minimize and monitor deamidation–isomerization, respectively, enabling a more accurate assessment of potential CDR sequence liabilities.
Accurate evaluation of chemical modifications such as asparagine deamidation and aspartic acid isomerization is an essential component of comprehensive characterization of therapeutic monoclonal antibodies (mAbs). When located in the complementarity determining regions (CDRs), these modifications can cause a loss of function, impacting product efficacy and safety, and resulting in the designation of the modification as a critical quality attribute. However, artifactual modifications can be introduced by analytical procedures, and distinguishing modifications as either critical quality attributes or method-induced artifacts is an important objective for product development. Conventional peptide mapping coupled with ultrahigh-resolution mass spectrometry offers advanced capabilities for definitive characterization of protein therapeutics. However, experimental conditions such as digestion time and pH can influence the observed level of chemical modifications, usually leading to over-estimation. In this work, a new peptide mapping method was developed specifically for mAb characterization that employs optimal enzyme pH for robustness, but short digestion times and time-course elements to minimize and monitor deamidation–isomerization, respectively, allowing a more accurate assessment of potential CDR sequence liabilities.
Monoclonal antibodies (mAbs) comprise a significant number of biotherapeutics with indications for cancer, inflammatory disease, organ transplantation, cardiovascular disease, infection, respiratory disease and more (1). The advantages of the mAb modality include a high level of specificity and an affinity to their target with low adverse events (1). In addition, mAbs are relatively stable because they have large stretches of constant region sequences. However, mAbs may be susceptible to physical and chemical degradation in the variable region sequences and complementarity determining region (CDR) loops during manufacturing, storage, and in vivo administration (2). Chemical modifications such as asparagine (Asn, N) deamidation (3–6) and aspartic acid (Asp, D) isomerization (6–9) typically involve formation of a cyclic succinimide intermediate and subsequent hydrolysis to Asp or iso-aspartate (iso-Asp), or both. These modifications have been found to occur in the CDRs of mAbs, with some instances resulting in the loss of target binding affinity and function (10,11). In addition, glutamine (Gln, Q) deamidation can also occur but is known to proceed at a slower rate than Asn deamidation (12).
During early process and product development, experimental detection and identification of an elevated Asn deamidation or Asp isomerization sequence liability in the variable region and CDRs of the mAb would initiate a stability and structure-function study to determine if the particular chemical modification constitutes a critical quality attribute (CQA). CQAs are defined in the Quality by Design ICH Q8(R2) guidance documents as physical, chemical, biological, or microbiological properties or characteristics that should be within an appropriate limit, range or distribution to ensure the desired product quality (13). Discriminating modifications as potential CQAs from method-induced artifacts is an important distinction with regard to project timelines and costs because further development efforts would be needed to understand the criticality of the quality attribute and determine the appropriate control strategy (14).
From a drug discovery and predevelopment perspective, detection and elimination of sequence liabilities at the molecular design and selection stage (before the early process and product development stage) is a current best practice. It is prudent that process and product development groups share detected Asn deamidation and Asp isomerization sites for particular mAbs with the molecular design and drug discovery groups to ensure sequence liabilities are systematically trended and engineered out of future constructs. This practice helps ensure that only well-behaved therapeutic molecules will enter the product and process development stage, minimizing the product’s risk of failure in clinical trials (5).
Deamidation and isomerization are traditionally detected by peptide mapping analysis. A monoclonal antibody is enzymatically digested with an endoprotease such as trypsin, which selectively cleaves peptide bonds C-terminal to lysine and arginine residues (but not before proline). The resulting proteolytic peptides typically are separated and identified by liquid chromatography–mass spectrometry (LC–MS) using accurate mass determinations. For enhanced characterization of sequence liabilities, liquid chromatography with on-line tandem mass spectrometry (LC–MS/MS) is required to provide site localization of chemical modifications, as well as direct, confirmatory sequencing for peptide identification. Proteolytic digests are commonly conducted overnight at the pH optimum of the enzyme to ensure complete protein digestion. However, digestion parameters with high pH, long digestion times, high temperatures, and specific buffer types (15–17) have been shown to influence the degradation propensity of particular Asn-X and Asp-X sequence motifs. As a result, these peptide mapping variables can artificially impact the observed level of existing deamidation and isomerization, potentially leading to an over-estimation of abundance, or worse, cause a new “method-induced” chemical modification where a proteolytic peptide spontaneously deamidates or isomerizes during the mAb digestion process.
Several studies have minimized method-induced deamidation by lowering the pH to 6.0 for trypsin digests (18–20). However, because trypsin works optimally between pH 7.5 and 8.5, these low pH experiments may require longer digestion times (12–120 h) to ensure complete protein digestion. Ren and colleagues (22,23) were able to shorten the trypsin digestion time to 30 min at pH 7.5 with removal of guanidine hydrochloride (GdnHCl) from the digestion buffer (21). The GdnHCl functions as a chaotropic agent and is used for protein denaturation before digestion, but it also inhibits trypsin activity (21). Others have used 18O-water and the resulting mass differences at deamidated Asn (+3 Da) or isomerized Asp (+2 Da) residues to discern the level of deamidation or isomerization incurred during sample preparation (22,23).
In this work, we present a new low-artifact peptide mapping characterization method that can be coupled to LC–MS and LC–MS/MS to accurately evaluate Asn deamidation and Asp isomerization. This method, based on the work of Ren (21) and Rogers (24), includes extensive removal of denaturant (GdnHCl), reductant, and alkylant, as well as short digestion times. However, a commercially available Lys-C/trypsin enzyme combination is employed using optimum pH for more complete digestions and robust quantitation. Furthermore, a time-course element for distinguishing real versus method-induced deamidation and isomerization also was instituted, in addition to a high-resolution chromatographic method for separating the modified and unmodified proteolytic peptides for improved identification and quantitation. With this method, site-localization and more-accurate relative quantification of chemical modifications in the CDRs of mAbs is possible during product characterization, especially when combined with forced degradation–stability studies. It also leads to increased product knowledge as well as providing greater awareness to guide process development and formulation activities.
Experimental
Materials
Trastuzumab (marketed as Herceptin) and an IgG1 mAb produced and purified by Pfizer were used in this study. The IgG1 mAb was stressed by incubation in 100 mM sodium phosphate at pH 8.0 at 25 °C and 37 ËC for 4 weeks. Tris, GdnHCl, and dithiothreitol (DTT) were purchased from Sigma-Aldrich. Formic acid, trifluoroacetic acid, iodoacetic acid, and ZebaSpin desalting columns (0.5 mL) were obtained from Thermo Scientific. Sodium phosphate monobasic and sodium phosphate dibasic were obtained from JT Baker. Mass spectrometry grade Lys-C/trypsin mix was obtained from Promega. Bio-Spin 6 (Tris) columns were purchased from BioRad and Illustra NAP-5 columns were obtained from GE Healthcare.
Denaturation–Reduction, Alkylation, Desalting, and Lys-C/Trypsin Digestion
Antibody samples were diluted to 10 mg/mL using 100 mM Tris-HCl pH 8.2. Samples (8 µL) were denatured by adding 100 µL of 7 M GdnHCl in 100 mM Tris-HCl pH 8.2. Reduction was accomplished with the addition of 5 µL of 0.2 M DTT followed by a 30-min incubation at 37 °C. Alkylation was achieved by adding 20 µL of 200 mM iodoacetic acid followed by incubation in the dark for 30 min at room temperature.
Following denaturation, reduction and alkylation, the samples were buffer-exchanged into 100 mM Tris, pH 8.2 digestion buffer using Bio-Spin 6 columns (BioRad) and the subsequent concentration was determined by a NanoDrop fluorospectrometer. Lyophilized Lys-C/trypsin mix was reconstituted to 1 mg/ mL with water. Digestions were initiated with the addition of 1 mg/mL Lys-C/trypsin solution to the reduced, alkylated, desalted antibody samples resulting in a 1:10 enzyme-protein (w/w) ratio at 37 ËC. Aliquots (40 µL) of the digest at three time-points (30, 60, and 120 min) were transferred into three separate autosampler vials and quenched with 4 µL of 10% trifluoroacetic acid. Samples can be frozen at -20 °C before LC–MS/MS analysis.
Peptide Mapping by LC–MS and LC–MS/MS
Chromatographic separation of peptides was carried out on a Waters Acquity UPLC system equipped with a 150 mm × 2.1 mm, 2.5-µm Waters XSelect XP CSH C18 column with UV detection at 214 nm. Mobile-phase A consisted of 0.1 % aqueous formic acid (v/v) and mobile-phase B was acetonitrile with 0.1 % formic acid (v/v). A stepwise gradient was used starting at 100% mobile-phase A. Mobile-phase B was elevated to 30% from 5 to 140 min, and then to 90% from 140 to 155 min. Column temperature was maintained at 40 °C with a flow rate of 0.2 mL/min. An 11-µL volume of the protein digest was injected onto the column. Better quality UV chromatograms are obtained over the first 10 min of the analysis if mobile-phase B is 95% acetonitrile with 0.1 % formic acid (v/v) and the gradient is started at 0.5% B.
LC–MS and LC–MS/MS experiments were performed using a Thermo Fisher Scientific Orbitrap Fusion Tribrid mass spectrometer operated in the positive ion mode. Peptide accurate masses and sequences were obtained by MS and MS/MS, respectively. Full-scan mass spectra were collected using a mass range of 300–2000 and a resolving power of 60,000. The spray voltage was 3.75 kV, the ion transfer tube temperature was 325 °C, and the sheath and auxiliary gas flow rates were 40 and 10, respectively. Data-dependent fragmentation for peptides with 2–7 charge states was induced by low-energy collision-induced dissociation (CID) using collision energy of 35% in the ion trap. Additional parameters were as follows: a minimum signal threshold of 5000; 1 microscan per spectrum; 2 m/z precursor isolation window; MS injection time of 50 ms; and MS/MS automatic gain control (AGC) of 1.0 × 10⁴ with maximum MS/MS injection time of 35 ms.
Targeted electron-transfer dissociation (ETD) of peptides was also acquired when differentiation of aspartic acid (D) and iso-aspartic acid (iso-D) residues was needed. Low resolution ETD MS/MS spectra were obtained in the ion trap under the following conditions: scan range m/z 250–2000; 1 microscan per spectrum; 2 m/z precursor isolation window centered at the [M+4H]4+ charge state of peptide; Full scan AGC of 2 x 10⁵ with a maximum injection time of 50 ms; and AGC of 1.0 × 10⁴ with a maximum MS/MS injection time of 200 ms.
Data Analysis
Post-acquisition data processing was performed using XCaliber software from ThermoFisher Scientific. Extracted ion chromatograms (EICs) were obtained manually for each expected (unmodified) and modified peptide using the m/z value (monoisotopic value) from the most abundant charge state, assuming the charge state profiles were similar. The relative percentages of modified and unmodified peptides were determined using the respective manually integrated peak areas (MS ion intensities). The relative abundance of a chemically modified peptide was estimated by dividing the peak area of the modified peptide peak by the sum of the peak areas for the modified and unmodified peptide peaks (and multiplying by 100). In-house, automated software was used to highlight potential sequence liabilities in the mAb light chain and heavy chain CDRs. More advanced peptide mapping bioinformatics software is emerging from Thermo Fisher Scientific and Protein Metrics that will integrate the signal from all m/z charge states, permitting more accurate relative abundance values in an automated manner.
Results and Discussion
Antibodies contain three CDRs in the light chain (L-CDR1, L-CDR2, and L-CDR3) and three in the heavy chain (H-CDR1, H-CDR2, and H-CDR3) that bind target antigens. These CDR loops represent flexible, surface-exposed polypeptides that are more likely to degrade upon manufacture, forced stress studies, specified product shelf life, and in vivo administration. From the literature and in-house experience, degradation hotspots are common in the L-CDR1, H-CDR2, and H-CDR3 loops, with the latter having a known negative impact to antibody binding when a residue becomes deamidated or isomerized (5).
Asn deamidation commonly occurs at particular sequence motifs, namely Asn-Gly (NG), Asn-Ser (NS), Asn-Thr (NT) (6,25), or Asn-Asn (NN) (26). However, in our hands, many different Asn-X motifs in CDRs (for example, NY, ND and NF) have been observed to deamidate making prediction difficult-essentially all Asn-X motifs need to be considered. Chemical degradation of Asn residues usually results in Asp, iso-Asp, and succinimide, the cyclic imide intermediate product. Asp isomerization also is dependent on amino acid sequence. Common sequence motifs are: Asp-Gly (DG) (8,27), Asp-Ser (DS) (6,28), Asp-Thr (DT) (6,28), Asp-Asp (DD) (29,30), and Asp-His (DH) (31). Chemical degradation of Asp residues typically results in iso-Asp and succinimide.
To properly study deamidation and isomerization hotspots, minimal method-induced modifications should be generated during the peptide mapping procedure while at the same time, confirming complete protein digestion. For mAbs, the endoprotease used for peptide mapping should cleave between each CDR. Such cleavage affords shorter proteolytic peptides where the unmodified and modified forms are baseline separated and are eluted in separate peaks, permitting easier detection, identification, and quantitation of potential hotspots. The ideal peptide map ought to be robust and easy to perform, enabling both single-sample product characterization, as well as side-by-side, multi-sample forced degradation and comparability exercises. The peptide mapping method should provide complete or near complete sequence coverage for comprehensive characterization of the mAb. High quality, robust peptide separations (in a MS-friendly solvent) are also required. Ideally, the characterization peptide map would be fitted with the latest column and HPLC system technologies to chromatographically resolve Asn deamidation and Asp isomerization peaks for accurate relative quantitation. In addition, the method is expected to provide a high quality UV chromatogram with good signal-to-noise characteristics and a clean baseline for product identification, primary sequence monitoring, and reports and regulatory filings. Buffer-related peaks should be minimized, in addition to digestion-related artifacts such as auto-digestion species, alternative enzymatic cleavages, and miscleavages.
Trypsin is an ideal endoprotease for mAbs because it is readily available from multiple vendors, cleaves each light and heavy chain CDR into a separate proteolytic peptide, and typically provides complete digestion under ideal conditions. A commercial endoprotease mix of both trypsin and the lysine-specific protease lysyl endopeptidase (Lys-C) from Promega was used in the new low-artifact peptide mapping method to ensure more efficient proteolytic cleavage at lysine (K) residues followed by acidic residues, such as Lys-Asp and Lys-Glu (32). The addition of Lys-C also allows for supplemental cleavage at other lysine residues (for example, K/P) that may not cleave efficiently from trypsin alone resulting in more complete digestion in less time with less digestion-related artifacts. This enzymatic mixture has been shown to improve overall proteolytic efficiency, protein quantitation, digestion reproducibility, and tolerance to denaturants (32,33).
Several buffer cleanup strategies were evaluated to remove the protein denaturant (GdnHCl), as well as the excess reductant (DTT) and alkylant (iodoacetic acid) before digestion. It has been shown that thorough removal of GdnHCl, a known trypsin inhibitor, can dramatically improve tryptic activity (21). Evaluation of commonly used cleanup columns, including NAP-5, Bio-Spin 6 and ZebaSpin desalting columns (0.5 mL, Thermo Scientific), revealed the NAP-5 and Bio-Spin 6 columns to be the most efficient at removing the denaturation, reduction and alkylation reagents, based on complete proteolysis at 30 min. It was further determined that the small volume and easy-to-use spin-column format of Bio-Spin 6 columns (BioRad) provided the fastest and most efficient salt and denaturant removal (24).
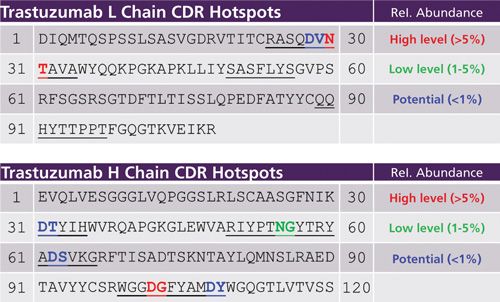
The recombinant IgG1 antibody trastuzumab was used to establish the initial low-artifact peptide map, as well as to optimize the method performance and usability thereafter. Figure 1 shows the light and heavy chain variable region amino acid sequence of trastuzumab, including the three CDRs in each respective subunit and the corresponding CDR hotspots and levels: red indicates >5%, green 1–5%, and blue <1%. Chemical modification sites in the CDRs of trastuzumab have been well-studied (5,9,20) with known deamidation sites in the light chain at N30T (L-CDR1) and heavy chain at N55G (H-CDR2). In addition, an Asp isomerization site in the heavy chain at D102G (H-CDR3) has previously been detected (5,9). As a result, the analysis of trastuzumab allows us to benchmark our method for hotspot detection and precise assessment of relative abundances.
Figure 1: Known and predicted CDR deamidation and isomerization hotspots for trastuzumab.
The sites and relative abundances of deamidation and isomerization in trastuzumab published by two previous groups in the literature agree well (5,9), as shown in Table I. Harris and colleagues (9) observed ~15% deamidation at N30T (L-CDR1) in light chain, as well as ~1% deamidation at N55G (H-CDR2) and ~9% isomerization D102G (H-CDR3) in heavy chain, via characterization of the enriched trastuzumab charge isoforms by cation-exchange chromatography and subsequent trypsin peptide mapping. Sydow and colleagues (5) used an overnight trypsin peptide map without alkylation and a digestion pH of 6.0. Here, the deamidation at N30T (L-CDR1) and N55G (H-CDR2) was 11% and 4%, respectively, while isomerization at D102G (H-CDR3) was 7%.
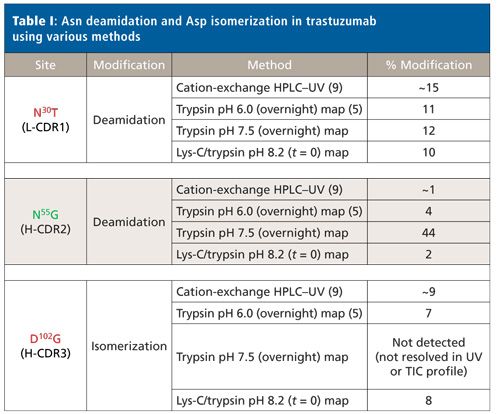
Also shown in Table I are the deamidation and isomerization results from our platform trypsin peptide map analytical method (reduced and alkylated, ZebaSpin desalt step, and overnight digestion at pH 7.5) as quantitated by LC–MS. Platform analytical methods are developed and established for modalities such as mAbs to provide an efficient, consistent set of analyses for each new mAb entering development, thereby avoiding repetitive method development. Values are relatively consistent for N30T (L-CDR1) deamidation between our platform method and the literature results. However, the deamidation site at N55G (H-CDR2) exhibited a much higher relative abundance (44%) compared to reported values from cation-exchange HPLC (1%) and the pH 6.0 overnight trypsin map (4%). Furthermore, the D102G (H-CDR3) isomerization site was not chromatographically resolved from the unmodified peptide in the platform trypsin peptide map, making identification and quantitation not possible.
To understand the artificially high level of deamidation at N55G in the overnight pH 7.5 platform trypsin peptide map, a time course was performed at both pH 7.5 (pH of Pfizer platform digest) and pH 8.2 (optimal pH for trypsin digest) using a new peptide mapping method with Lys-C/trypsin as shown in Figure 2. Relative modification levels were determined by comparing the manually integrated peak areas (MS ion intensities) for each modified and unmodified peptide. A significant increase in deamidation level at N55G in the heavy chain was observed with increasing digestion time at both pH values (see center graph of Figure 2). These data confirm the susceptibility of N55G to method-induced deamidation with longer trypsin digestion times at slightly basic conditions (pH 7.5). In contrast, a stable level of deamidation (at N30T in the light chain) and isomerization (at D102G in the heavy chain) were observed over the course of digestion, indicating they are not influenced by the digestion method.
Figure 2: Relative percent (%) deamidation and isomerization versus digestion time. In the top graphs, the purple diamond and blue box represent the Lys-C/trypsin digest at pH 7.5 and pH 8.2, respectively. The light blue triangle represents the platform antibody trypsin digest at 7.5 at 18 h (overnight). The bottom graphs highlight the deamidation and isomerization levels at 30, 60, and 120 min of proteolytic digestion.
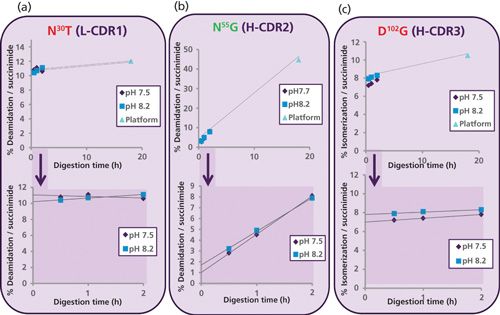
The bottom graphs in Figure 2 highlight the deamidation and isomerization levels using time-course measurements at 30, 60, and 120 min. By graphing the modification levels, the intrinsic modification level in the protein can be estimated by back-extrapolating to the y-axis. This intrinsic modification level essentially mimics zero digestion time (t = 0) and provides a more accurate representation of the baseline modification level in a given molecule (19). In the case of N55G deamidation in H-CDR2 (Figure 2b), the y-intercept value was approximately 2% for the Lys-C/trypsin pH 8.2 (t = 0) peptide map. This extrapolated value is now in line with other methods for N55G deamidation in trastuzumab (Table I). The Lys-C/trypsin digest performed at pH 8.2 with shortened digestion times and the time-course element constitutes our new low-artifact peptide map format for mAbs.
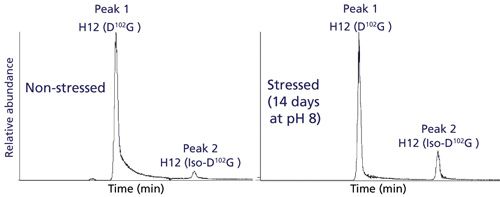
To determine the relative quantitation of these modified peptides, a high-resolution separation of tryptic peptides was needed. This was accomplished using a charged-surface hybrid (CSH) C18 column that is capable of unique peptide selectivity with little dependence on trifluoroacetic acid ion-pairing (34). As a result, this column is well suited for chromatographic separation of modified peptides in a formic acid-only LC–MS/MS method. Figure 3 shows full chromatographic resolution of trastuzumab’s H12 peptides that contain D102G and iso-D102G via use of the CSH C18 column. Because isomerization of Asp to iso-Asp does not change the overall mass or charge of the peptide, chromatographic separation is particularly important for detection and quantitation. In our previous trypsin platform peptide map, a Waters BEH C18 column could not resolve the D and iso-D forms of this peptide so isomerization at this site was not detected. Comparative peptide map analysis of unstressed and stressed trastuzumab generated different levels of iso-D, allowing for method optimization and preliminary peak assignments, as shown in Figure 3.
Figure 3: EICs for the [M+3H]3+ ion of H12 trastuzumab peptide containing D102G. Left panel: EIC for nonstressed trastuzumab H12 peptide. Right panel: EIC for the trastuzumab H12 peptide stressed for 14 days at 37 °C and pH 8.
The low-artifact peptide map was analyzed on a Thermo Fisher Scientific Orbitrap Fusion Tribrid mass spectrometer capable of performing multiple dissociation techniques including CID and ETD. The fast MS/MS scan rates and high sensitivity of this instrument can frequently provide rapid determination of Asn deamidation sites by CID. However, fragmentation of larger peptides and differentiation of Asp and iso-Asp residues in a peptide can be challenging. With ETD, it is possible to gain orthogonal, information-rich fragmentation for larger, highly charged peptides, as well as discriminate Asp and iso-Asp residues due to the generation of fragment ions (c+57 and z-57) specific for iso-D [7,35]. These diagnostic c and z fragments stem from the additional methylene group in the peptide backbone of iso-Asp residues (See Figure 5).
Figure 5: Zoomed view of the low mass range of ETD spectra for the (a) D-containing H12 and (b) iso-D-containing H12 peptide. The c3 and c4 fragment ions are common to the H12 peptide containing both D and iso-D. However, the c3+57 fragment ion allows differentiation of iso-D from D.
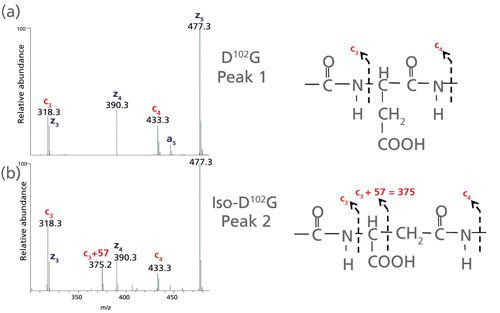
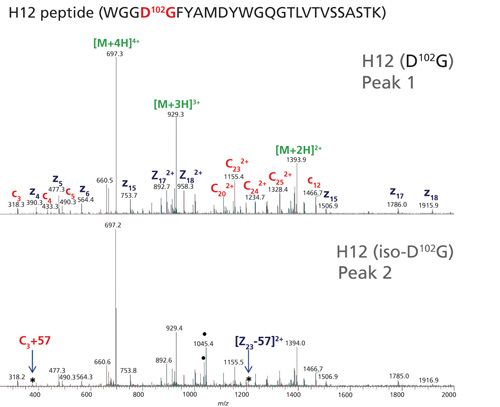
A second chromatographic peak with the same mass as the H12 trastuzumab peptide increased in abundance (18%) following stressed conditions of 14 days at pH 8 (see Figure 3, right panel). Using this stress sample, a targeted ETD experiment was performed on the two isomeric H12 peptides (peaks 1 and 2) and the data are shown in Figure 4. Peak 2 contains the signature fragments for iso-Asp (c3+57 at m/z 375.2 and z23-57 at m/z 1206.1) confirming its presence at position 102 in H-CDR3, whereas peak 1 does not contain the diagnostic fragments with +/-57 Da species. Figure 5 shows a zoomed view of the lower mass range of the ETD spectra with a distinct c3+57 fragment ion for peak 2. Consequently, for the H12 peptide in trastuzumab, the iso-Asp-containing form was eluted after the Asp-containing form. Others have also reported a similar elution order and attribute it to chromatographic conditions (36,37).
Figure 4: ETD spectra for the Asp-containing H12 and iso-Asp-containing H12 peptides. The asterisk (*) in the bottom mass spectrum represents ETD fragments (c+57 and z-57) consistent with iso-Asp detection.
Case Study: Analysis of Forced Deamidation
The low-artifact Lys-C/trypsin peptide mapping method was applied to a therapeutic IgG1k mAb stressed by incubation in sodium phosphate, pH 8.0, at 25 °C and 37 °C for up to 4 weeks. These stress conditions are known to induce deamidation in proteins as well as emulate the physiological conditions that a monoclonal antibody will encounter after administration. This IgG1k mAb contains a possible light chain Asn deamidation site at N33G (L-CDR1), two potential, closely spaced heavy chain Asn deamidation sites in the H-CDR2 (N55F and N57T) as well as a potential Asp isomerization site at D100G (H-CDR3).
Figure 6 shows the EICs of the unmodified and deamidated forms of the light chain L2 tryptic peptide 25SSQSLVHSN33GNTFLYWYLQKPGQSPQ50LLIYR55 in L-CDR1 before and after forced deamidation. Very low levels of N33G deamidation (0.7% Asp and 2.1% iso-Asp) were detected at time zero (t = 0, back-extrapolated from time-course plot) with only modest increases at longer digestion times, indicating little protein or method-induced deamidation (see Figure 6 insert). The well-resolved chromatographic separation of the modified peptides permitted fragmentation (CID and targeted ETD) to confirm the deamidation site at N33G and not N35T, and distinguish the Asp- and iso-Asp-containing peptides (data not shown). This deamidation example shows three times more iso-Asp than Asp, consistent with the traditional NG motif (6). Figure 6 also demonstrates that the deamidation levels at N33G increased significantly (13.0% Asp and 30.0% iso-Asp) under stressed conditions, indicating this site’s susceptibility to degradation.
Figure 6: EICs of the unmodified and deamidated forms of an IgG1k antibody light chain L2 tryptic peptide 25SSQSLVHSN33GNTFLYWYLQKPGQSPQ50LLIYR55 in L-CDR1 before and after forced deamidation. The top panel shows the relative abundance at time zero (t = 0), the middle panel represents the peptide after 4 weeks at 25 °C and the bottom panel after 4 weeks at 37 °C. The unmodified peptide (N33G) as well as the deamidated (D33G and iso-D33G) species are shown. Deamidation at trace levels was also detected at Q50L, which remained unchanged under stress conditions.
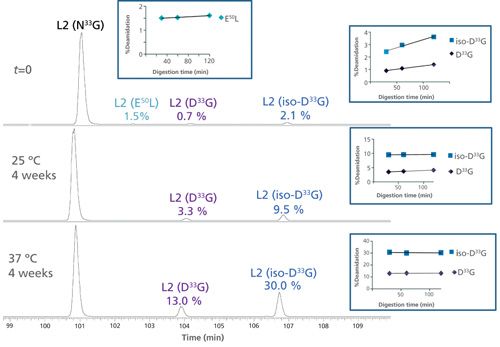
Moreover, a well-resolved, low-level (1.7%) peak corresponding to glutamine (Gln, Q) deamidation to glutamic acid (Glu, E) at position 50 (E50L) was also detected at time zero (t = 0). The level of this deamidated species stayed steady with digestion time (inset figure) as well as under stressed conditions. This observation is consistent with Gln deamidation proceeding at a slower rate than Asn deamidation (12).
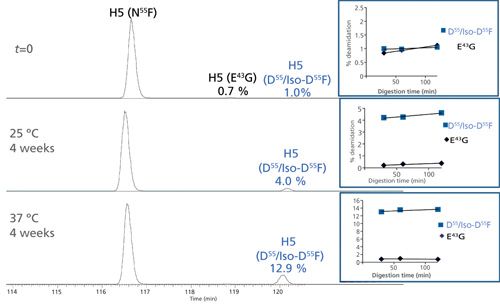
Figure 7 shows the EICs of the unmodified and deamidated forms of the heavy chain H5 tryptic peptide 39QAPGQ43GLEWMGWIYPGN55FN57TK59 in H-CDR2 before and after forced deamidation. In this case, only one low-level peak (1.0%) was detected with Asn deamidation products. Deamidation levels at N55F increased considerably (12.9%) under stressed conditions, indicating this site’s susceptibility to degradation. Fragmentation (CID and ETD) data indicated that N55F was the site of modification and not the expected N57T sequence motif. In addition, a low-level z5-57 fragment was detected in the ETD experiment indicating the presence of the iso-Asp species. However, the possibility of a mixture of Asp and iso-Asp under one peak could not be eliminated. A trace, consistent level of deamidation was also detected at Q43G for the H5 peptide.
Figure 7: EICs of the unmodified and deamidated forms of an IgG1k antibody heavy chain H5 tryptic peptide 39QAPGQ43GLEWMGWIYPGN55FN57TK59 in H-CDR2 before and after forced deamidation. The top panel shows the relative abundance at time zero (t = 0), the middle panel represents the peptide after 4 weeks at 25 °C, and the bottom panel after 4 weeks at 37 °C. The unmodified peptide (N55F) as well as the deamidated (D55F and iso-D55F) species are shown. Deamidation at trace levels was also detected at Q43G, which remained unchanged under stress conditions.
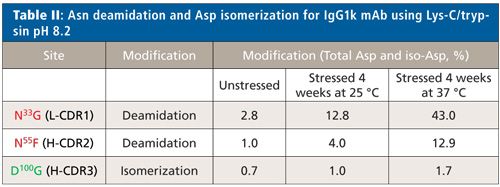
Very low levels of D100G isomerization (0.7%) were detected by low artifact peptide mapping at time zero (t = 0, back-extrapolated from time-course plot) with a small increase at longer digestion times (1.7%), indicating little protein or method-induced isomerization at D100G in the heavy chain H12 peptide after forced stress conditions for 4 weeks. For this IgG1k mAb, we detect a very different behavior than was seen previously with trastuzumab. For all three sites, a stable level of deamidation (at N33G in the light chain and N55F in the heavy chain) and isomerization (at D100G in the heavy chain) were observed over the course of digestion, indicating they are not readily influenced by the digestion method. However, two sites (N33G in L-CDR1 and N55F in H-CDR2) do show a stable but increased level of degradation under stressed conditions signifying that they are true degradation hotspots. This data shows that comparative peptide mapping analysis of unstressed and stressed material is a best practice for probing CDR hotspots. Table II summarizes the total Asn deamidation and Asp isomerization level for each site. Despite significant deamidation in L-CDR1 and H-CDR2, the target binding results (enzyme-linked immunosorbent assay [ELISA]) for this antibody showed a minor decreasing trend (-20%) over time at 37 °C but remained within the variability of the method. These results indicate that degradation hotspots do not always affect the function of the molecule.
Conclusion
A novel, low-artifact peptide mapping digestion method using dual endoproteases (Lys-C and trypsin), shortened digestion times, and time-course elements was developed for recombinant mAbs. This method detects and minimizes potential method-related deamidation and isomerization. Outfitted with the latest column technology, the peptide mapping method effectively separates Asn deamidation and Asp isomerization products from unmodified peptides, permitting decisive detection and more accurate determination of relative abundances. This new peptide mapping method allows analysts to systematically confirm potential CDR hotspots, as well as confidently report accurate relative abundances. In addition, this new method has triggered heightened awareness to potential Asn deamidation and Asp isomerization, which both can potentially go undetected if not properly resolved from the unmodified peptide or blindly attributed to method-induced modification phenomenon without investigation. Application of this low-artifact, “multi-attribute” heightened characterization method enhances product understanding in terms of forced degradation and real-time stability assessments, structure–function relationships, and comparability exercises following manufacturing site and process changes. Going forward, the new low-artifact Lys-C/trypsin peptide map with time-course elements will be used to systematically analyze the entire Pfizer portfolio of mAbs for the creation of CDR hotspot database (training set) for the development of an in silico sequence liability prediction algorithm. This database and prediction algorithm will enable the advancement of well-behaved mAb constructs into clinical development.
Acknowledgment
The authors gratefully acknowledge the scientific assistance of Jamie Lee and Jennifer Ide and valuable discussions with Thomas Porter, Laura Lin, Sandeep Kumar, Eric Bennett, James Apgar, Tao He, Eric Sousa, Amy King, and Satish Singh.
References
- M. Suzuki, C. Kato, and A. Kato, J. Toxicol. Pathol.28, 133–139 (2015).
- P. Bults, R. Bischoff, H. Bakker, J.A. Gietema, and N.C. van de Merbel, Anal. Chem.88, 1871–1877 (2016).
- N.E. Robinson, Proc Natl Acad Sci U S A99, 5283–5288 (2002).
- J. Vlasak, M.C. Bussat, S. Wang, E. Wagner-Rousset, M. Schaefer, C. Klinguer-Hamour, M. Kirchmeier, N. Corvaia, R. Ionescu, and A. Beck, Anal. Biochem.392, 145–154 (2009).
- J.F. Sydow, F. Lipsmeier, V. Larraillet, M. Hilger, B. Mautz, M. Molhoj, J. Kuentzer, S. Klostermann, J. Schoch, H.R. Voelger, J.T. Regula, P. Cramer, A. Papadimitriou, and H. Kettenberger, PLoS One9, e100736 (2014).
- T. Geiger, and S. Clarke, J. Biol. Chem.262, 785–794 (1987).
- C.M. Eakin, A. Miller, J. Kerr, J. Kung, and A. Wallace, Front. Pharmacol.5, 87 (2014).
- J. Cacia, R. Keck, L.G. Presta, and J. Frenz, Biochemistry35, 1897–1903 (1996).
- R.J. Harris, B. Kabakoff, F.D. Macchi, F.J. Shen, M. Kwong, J.D. Andya, S.J. Shire, N. Bjork, K. Totpal, and A.B. Chen, J. Chromatogr., Biomed. Appl.752, 233–245 (2001).
- B. Yan, S. Steen, D. Hambly, J. Valliere-Douglass, T. Vanden Bos, S. Smallwood, Z. Yates, T. Arroll, Y. Han, H. Gadgil, R.F. Latypov, A. Wallace, A. Lim, G.R. Kleemann, W. Wang, and A. Balland, J. Pharm. Sci.98, 3509–3521 (2009).
- Y. Yan, H. Wei, Y. Fu, S. Jusuf, M. Zeng, R. Ludwig, S.R. Krystek Jr., G. Chen, L. Tao, and T.K. Das, Anal. Chem.88, 2041–2050 (2016).
- H. Liu, G. Gaza-Bulseco, and C. Chumsae, Rapid Commun. Mass Spectrom.22, 4081–4088 (2008).
- International Conference on Harmonization of Technical Requirements for Registration of Pharmaceuticals for Human Use. ICH harmonized tripartite guideline, pharmaceutical development, August 2009.
- N. Alt, T.Y. Zhang, P. Motchnik, R. Taticek, V. Quarmby, T. Schlothauer, H. Beck, T. Emrich, and R.J. Harris, Biologicals 44(5), 291–305 (2016).
- A.L. Pace, R.L. Wong, Y.T. Zhang, Y.H. Kao, Y.J. Wang, J. Pharm. Sci.102, 1712–1723 (2013).
- O.V. Krokhin, M. Antonovici, W. Ens, J.A. Wilkins, and K.G. Standing, Anal. Chem.78, 6645–6650 (2006).
- P. Hao, Y. Ren, A. Datta, J.P. Tam, and S.K. Sze, J. Proteome Res.14, 1308–1314 (2015).
- A.J. Barrett, and J.K. McDonald, Mammalian Proteases: A Glossary and Bibliography (Academic Press, London, 1980).
- S.D. Stroop, Rapid Commun. Mass Spectrom.21, 830–836 (2007).
- K. Bomans, M. Haberger, L. Bonnington, K. Wagner, T. Kailich, H. Wegele, M. Molhoj, D. Reusch, and P. Bulau, Am. Pharm. Rev. (2016). http://www.americanpharmaceuticalreview.com/Featured-Articles/331529-Multi-Attribute-Monitoring-of-Antibody-Modifications-by-Semi-Automated-Liquid-Chromatography-Mass-Spectrometry-Peptide-Mapping/
- D. Ren, G.D. Pipes, D. Liu, L.Y. Shih, A.C. Nichols, M.J. Treuheit, D.N. Brems, and P.V. Bondarenko, Anal. Biochem.392, 12–21 (2009).
- G. Gaza-Bulseco, B. Li, A. Bulseco, and H.C. Liu, Anal. Chem.80, 9491–9498 (2008).
- I. Terashima, A. Koga, and H. Nagai, Anal. Biochem.368, 49–60 (2007).
- R.S. Rogers, N.S. Nightlinger, B. Livingston, P. Campbell, R. Bailey, and A. Balland, mAbs7, 881–890 (2015).
- N.E. Robinson and A.B. Robinson, J. Pept. Sci. 63, 437–448 (2004).
- Y.T. Zhang, J. Hu, A.L. Pace, R. Wong, Y.J. Wang, and Y.H. Kao, J. Chromatogr. B: Anal. Technol. Biomed. Life Sci.965, 65–71 (2014).
- A.A. Wakankar, R.T. Borchardt, C. Eigenbrot, S. Shia, Y.J. Wang, S.J. Shire, and J.L. Liu, Biochemistry 46, 1534–1544 (2007).
- D.W. Aswad, M.V. Paranandi, and B.T. Schurter, J. Pharm. Biomed. Anal.21, 1129–1136 (2000).
- L. Yi, N. Beckley, B. Gikanga, J. Zhang, Y.J. Wang, H.W. Chih, and V.K. Sharma, J. Pharm. Sci.102, 947–959 (2013).
- G. Xiao, and P.V. Bondarenko, J. Pharm. Biomed. Anal.47, 23–30 (2008).
- K.J. Reissner, and D.W. Aswad, Cell. Mol. Life Sci.60, 1281–1295 (2003).
- S. Saveliev, M. Bratz, R. Zubarev, M. Szapacs, H. Bugamgunta, and F.D. Macchi, Nature Methods, Promega Application Note, 10 (2013). http://www.nature.com/search?journal=nmeth&q=Saveliev
- W.H. McDonald, R. Ohi, D.T. Miyamoto, T.J. Mitchison, and J.R. Yates, Int. J. Mass Spectrom.219, 245–251 (2002).
- M.A. Lauber, S.M. Koza, S.A. McCall, B.A. Alden, P.C. Iraneta, and K.J. Fountain, Anal. Chem.85, 6936–6944 (2013).
- J.J. Cournoyer, J.L. Pittman, V.B. Ivleva, E. Fallows, L. Waskell, C.E. Costello, and P.B. O’Connor, Protein Sci. 14, 452–463 (2005).
- W. Ni, S. Dai, B.L. Karger, and Z.S. Zhou, Anal. Chem.82, 7485–7491 (2010).
- D.S. Rehder, D. Chelius, A. McAuley, T.M. Dillon, G. Xiao, J. Crouse-Zeineddini, L. Vardanyan, N. Perico, V. Mukku, D.N. Brems, M. Matsumura, and P.V. Bondarenko, Biochemistry47, 2518–2530 (2008).
Lisa A. Marzilli, Elaine Stephens, A. Michelle English, and Jason C. Rouse are with Pfizer, Inc. in Andover, Massachusetts. Shibu Philip is with Pfizer, Inc., in Pearl River, New York. Direct correspondence to: lisa.marzilli@pfizer.com

New Method Explored for the Detection of CECs in Crops Irrigated with Contaminated Water
April 30th 2025This new study presents a validated QuEChERS–LC-MS/MS method for detecting eight persistent, mobile, and toxic substances in escarole, tomatoes, and tomato leaves irrigated with contaminated water.

.png&w=3840&q=75)

.png&w=3840&q=75)


.png&w=3840&q=75)


.png&w=3840&q=75)


