Appropriate Use of Mass Spectrometry in Clinical and Metabolic Research
Special Issues
When adhering to sound analytical principles, the inclusion of mass spectrometry in the clinical laboratory can lead to accurate, selective, and precise quantitative methods by detecting new classes of compounds with greater efficiency and sensitivity than is possible with older, established technologies.
Using examples from our analysis of L-carnitine and acyl-L-carnitines, we give specific guidance for the use of mass spectrometry (MS) in quantitative analysis, as applied to clinical research and clinical pharmacology. We focus on quantitative accuracy and analytical selectivity as keys to successful implementation of MS methods in clinical applications.
From the perspective of more than 40 years’ experience and 80 peer-reviewed publications concerning analytical methods development and application in clinical research and clinical pharmacology, we believe that the use of mass spectrometry (MS) in clinical methods is an extremely important development in analyte detection technology. However, we also are concerned that MS has led many to ignore concepts that preceded the use of MS in clinical applications, concepts that have served us well in the past and which remain valid today. We divide our discussion of this topic into two subjects: quantitative analysis and analytical selectivity.
Quantitative Analysis
The FDA’s “Analytical Procedures and Methods Validation for Drugs and Biologics: Guidance for Industry” (1), along with other such guidelines (2,3), defines approaches that are proven to provide excellent accuracy and precision when quantifying analytes in biological matricies. Conforming procedures include standardized calibrants and internal standards used to construct multiple-point calibration curves, and concurrent analysis of quality control samples to monitor and validate method performance. Methods with these features are capable of generating accurate values (within ±15% of the actual value for medium and high values, and within ±20% for the lowest values) for absolute quantitation, while exhibiting consistently precise results when analyzing many samples over an extended period of time. It is our experience that clinical research and pharmacology assays require this degree of accuracy and robustness, and that procedures that are less rigorous are incapable of generating consistently accurate values. An example of what we see as confusion on this point is the use of tandem MS “profiles” outside of expanded newborn screening programs.
The widespread implementation of expanded newborn screening programs using tandem MS “profiling” of amino acids and acyl-L-carnitines has been effective and beneficial (4). However, “profiles” are not quantitative: neither standardized calibrants nor multiple-point calibration curves are used. For a few acyl-L-carnitines, the tandem MS “profile” values are generated using single-point calibrations with labeled, standardized internal standard compounds. The calculation of these values assumes the accuracy of the internal standard concentration, and that the relative responses of each acyl-L-carnitine and its internal standard are proportional and linear throughout the entire detected range. This situation is unlikely due to chemical noise, which contributes to signal response, and mass spectral linear response limitations. However, most reported acyl-L-carnitine values are actually response ratios, since analogous labeled internal standards are not available for most acyl-L-carnitines. Because acyl-L-carnitine mass spectral responses are variable and compound specific, quantitation results using response ratio-derived values are unacceptably inaccurate. Widely variable quantitative performance of acyl-L-carnitine “profiling” has been documented using proficiency test samples (5,6), and specific problems with dicarboxylic acyl-L-carnitines (7) and free L-carnitine (8) have been reported. Although “profiling” can be appropriately used in expanded newborn screening programs to flag patients with possible diseases, the poor quantitative accuracy in tandem MS “profiles” is unacceptable for standard clinical uses. The term “profile” essentially concedes the inaccurate, variable, and qualitative nature of these analyses.
The use of acyl-L-carnitine “profiles” outside of expanded newborn screening, with claims that the analysis is quantitative, is an example of reliance on mass spectrometer response without the appropriate procedural refinement required to generate accurate results (standardized calibrants and internal standards used to construct multiple-point calibration curves, and concurrent analysis of quality control samples to monitor and validate performance). To test whether acyl-L-carnitine “profiles,” despite not using sound analytical principles for quantitative assays, are nevertheless accurate, researchers (5,6) studied the quantitative accuracy of acyl-L-carnitine “profile” results for malonyl-L-carnitine and HOC5 acyl-L-carnitine by distributing to different laboratories identical samples for analysis. The researchers hoped to demonstrate that through the use of correction factors, any analytical biases among the results could be “corrected,” and quantitatively accurate values could then be generated. Instead, the experimental values showed wide variations in quantitative results that were not amenable to simple arithmetic correction. These authors, some of whom were associated with the Newborn Screening Quality Assurance Program, U.S. Centers for Disease Control and Prevention, thus definitively demonstrated that acyl-L-carnitine “profile” results for malonyl-L-carnitine and HOC5 acyl-L-carnitine were neither accurate nor precise, and were best characterized as pseudo-quantitative.
In contrast, we developed accurate, precise, and robust methods for the quantitation of L-carnitine beginning 40 years ago, first using the selective radioenzymatic conversion of L-carnitine to labeled acetyl-L-carnitine, followed by detection with scintillation counting (9). Standardized calibrants and multiple-point calibration curves ensured quantitative accuracy. We next developed high performance liquid chromatography (HPLC)–UV methods (with derivatization for sensitivity enhancement) for quantification of L-carnitine, butyrobetaine (10–12), and acyl-L-carnitines (13,14). These methods were further enhanced using fluorescent derivatization, and we quantified L-carnitine and acyl-L-carnitines in plasma and tissues by HPLC with fluorescence detection (15,16). We later purchased an ion-trap mass spectrometer, modified our derivatization scheme and HPLC conditions, and quantified L-carnitine, butyrobetaine, and acyl-L-carnitines by HPLC–MS (17,18). Most recently, we incorporated ultrahigh-pressure liquid chromatography (UHPLC) and triple-quadrupole mass spectrometers, and we currently quantify L-carnitine, butyrobetaine, and acyl-L-carnitines in patient samples using UHPLC–MS/MS (19, 20). Regardless of the detection method used for the analysis (scintillation counting, UV, fluorescence, ion-trap MS, or triple-quadrupole MS), we always quantitated in relation to standardized calibrants and multiple-point calibration curves. One result of our adherence to sound analytical principles is that the patient values we generate from our L-carnitine determination today (with UHPLC–MS/MS) are indistinguishable from those values we generated 10 (using HPLC–ion-trap MS), 20 (using HPLC–fluorescence), 30 (using HPLC–UV), or even 40 years ago (using radiolabeled scintillation counting).
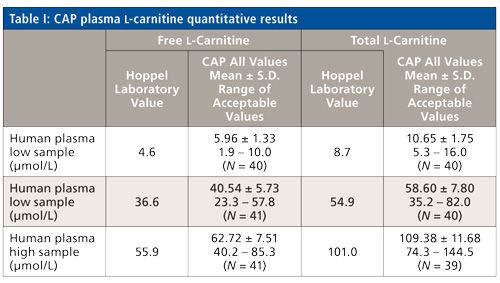
Table I contains quantitative data from our participation in the College of American Pathologists Biochemical Genetics Survey program (21), which distributes identical samples for analysis by participating laboratories. Most (90%) of the participants use tandem MS, and although the mean values from all participants are close to the values we determined using UHPLC–MS/MS (with standardized calibrants and multiple-point calibration curves), the range of acceptable values is enormous. For example, the low free L-carnitine value range is fivefold (1.9–10 µmol/L), the normal free L-carnitine value range is 2.5-fold (23.3–57.8 µmol/L) and the high free L-carnitine value range is twofold (40.2–85.3 µmol/L). Contrast these values with our internal results, which are shown in Table II. Here we combine previously published data generated using our radioenzymatic method in 1981 (9) and our HPLC–ion-trap MS in 2008 (18 19), along with unpublished HPLC–UV data from 1999, using plasma and urine samples from paid volunteers at the VA Medical Center in Cleveland, Ohio. Also shown are previously published data from our radioenzymatic method versus our HPLC–fluorescence method, with values from the analysis for human skeletal muscle as part of an exercise study (15). The plasma values are identical regardless of methodology, and the values from urine and skeletal muscle are only slightly different, probably because of urine sample collection differences and different sections of tissue used for analysis.
Analytical Selectivity
When first applied to biological samples, overconfident, less experienced analysts proposed that since the selectivity of MS was so superior to previously available methodologies, common practices such as predetection sample isolation and chromatography were unnecessary-just “dilute and shoot”! Today, this naive approach has been mostly discredited, having been quantitatively effective only in trivial instances Now most “dilute-and-shoot” protocols rely heavily on predetection HPLC for selectivity, in addition to MS (22). Combining selective sample pretreatment (liquid-liquid extraction, solid-phase extraction [SPE], and so forth), UHPLC and HPLC chromatographic separations, and selective MS techniques (MS/MS, high-resolution accurate mass MS, and so forth) for detection, results in the selectivity and robustness expected from clinical analysis methods. Highly selective methods are part of sound analytical principles and necessary for quantitative analysis; without selective methods, sample interferences will reduce robustness and negatively impact quantitative accuracy.
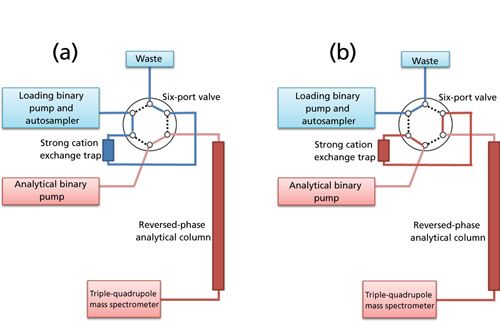
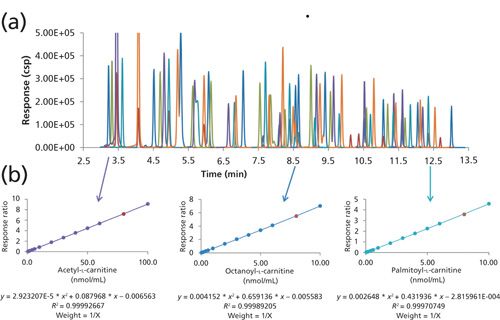
The incorporation of MS detection did not improve the accuracy or precision of our radioenzymatic L-carnitine analysis. Accurate, absolute quantification was always inherent in our methods, and enzymatic selectivity for L-carnitine was available and sufficient. However, acyl-L-carnitine quantitation by enzymatic selectivity was not available, and so another approach was required. Today, we achieve the necessary selectivity for acyl-L-carnitine analysis by sample isolation, derivatization, two-dimensional UHPLC separation, and MS/MS detection. Briefly, internal standards are evaporated to dryness in a microcentrifuge tube (see Figure 1). To the dry tube is added 10 µL of biological sample and 800 µL of 90:10:1 acetonitrile–water–formic acid. The tube is vortex-mixed, centrifuged (5 min, 16,000g), and the supernatant is applied to a 96-well mixed-mode reversed-phase-strong cation-exchange SPE plate. Acyl-L-carnitines are eluted with 500 µL of 90:10:1:2 acetonitrile–water–formic acid–pyridine into a 96-well collection plate. Following evaporation of the solvents and sublimation of the pyridine salts, acyl-L-carnitines are derivatized with pentafluorophenacyl trifluoromethanesulfonate (Figure 2). UHPLC separation with sequential ion-exchange and reversed-phase chromatography (Figure 3) is followed by MS/MS detection (Figure 4). The assay has a high level of quantitative accuracy, precision, selectivity, and robustness, and the entire procedure was submitted to validation studies to document the assay performance (19). Over the past 5 years, we have used this method to analyze and report acylcarnitine values for thousands of clinical and research samples.
Figure 1: Isolation of acyl-L-carnitines from biological samples using mixed-mode reversed-phase and strong cation-exchange solid-phase extraction. The average QC-medium recovery (N = 6 for the 65 acyl-L-carnitines) was 84% ± 9%, with a range of recoveries of 68–105%.
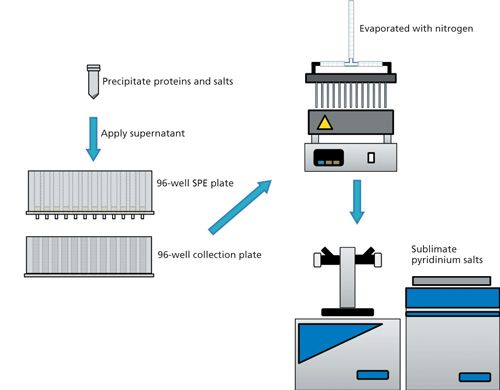
Figure 2: Derivatization of acyl-L-carnitines with pentafluorophenacyl trifluoromethanesulfonate. The reaction of pentafluorophenacyl trifluoromethanesulfonate with acyl-L-carnitines was performed at room temperature and was complete within seconds. Unlike the tandem MS “profile” derivatization using HCl in n-butanol with heating at 65 °C for 15 min, acyl-L-carnitine derivatization with pentafluorophenacyl trifluoromethanesulfonate results in no hydrolysis of acyl-L-carnitines.
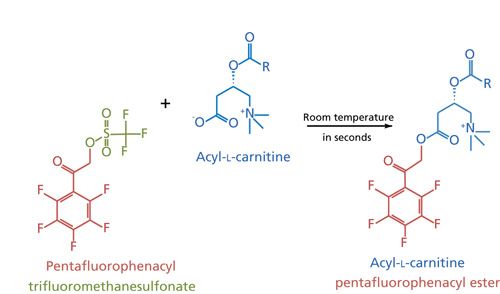
Figure 3: Instrument configuration for sequential ion-exchange–reversed-phase chromatography. (a) Acyl-L-carnitine pentafluorophenacyl esters are loaded onto the strong cation exchange trap using the loading binary pump following an autosampler injection. (b) After removal of excess derivativation reagent, the six-port valve is triggered and acyl-L-carnitine pentafluorophenacyl esters are forward flushed onto the analytical column using the analytical binary pump. We employed this strategy for two reasons: on-line removal of excess derivatization reagent before detection of the acyl-L-carnitine pentafluorophenacyl esters, and the ability to solubilize the whole range of acyl-L-carnitines (from acetyl- to stearoyl-L-carnitine) while maintaining good chromatographic selectivity for the short-, medium-, and long-chain acyl-L-carnitines, in a single 14-min chromatogram.
In contrast, we are concerned that tandem MS “profiling” of acyl-L-carnitines is not selective enough for clinical samples. Acyl-L-carnitine constitutional isomers are indistinguishable by tandem MS. This lack of selectivity from “profiling” has led to false positive results in clinical samples because of contributions from species other than the intended acyl-L-carnitine species (23–27). In addition, with selectivity based only on precursor ion scans, false negative and false positive values have been reported in clinical samples because of MS signal contributions from isobaric chemical contaminants (28–31). Both of these problems could be alleviated by incorporating predetection HPLC, as we demonstrated. Several other groups have also shown this to be true (32–34).
Figure 5 contains chromatograms, extracted from Figure 4a, showing separation of groups of isomeric acyl-L-carnitines. Our routine separation of isomeric acyl-L-carnitines means that our procedure, unlike tandem MS, can differentiate clinically relevant acyl-L-carnitine isomeric forms, correct false positives, and resolve ambiguous diagnoses. For example, we can easily differentiate short-chain acyl-CoA dehydrogenase deficiency from isobutyryl-CoA dehydrogenase deficiency (C4 isomers), 3-methyl-crotonyl carboxylase deficiency from β-ketothiolase deficiency (HO-C5 and C5:1 isomers), isovaleric acidemia from pivaloate contamination (C5 isomers), and medium-chain acyl-CoA dehydrogenase deficiency from valproate treatment (C8 isomers) (19,20).
Figure 4: UHPLC–MS/MS chromatographic separation of acyl-L-carnitines, and quantitation using multiple-point calibration curves. (a) A high calibration curve point UHPLC–MS/MS chromatogram, constructed from 66 standardized acyl-L-carnitines and 12 internal standards. Internal standards are colored red. Data were collected using optimized MS/MS transitions for each acyl-L-carnitine pentafluorophenacyl ester. (b) Representative calibration curves constructed from 13 calibration points for a short-chain acyl-L-carnitine (acetyl-L-carnitine; purple arrow pointing from purple colored acetyl-L-carnitine to its purple calibration curve), a medium-chain acyl-L-carnitine (octanoyl-L-carnitine; blue arrow pointing from blue octanoylcarnitine to its blue calibration curve), and a long-chain acyl-L-carnitine (palmitoyl-L-carnitine; aqua arrow pointing from aqua palmitoyl-L-carnitine to its aqua calibration curve). The red calibration curve point on each calibration curve in (b) was derived from the specific calibration curve point in the UHPLC–MS/MS chromatogram shown in (a).
Conclusions
What is quantitation? The literature uses this single term to mean many different levels of quantitative accuracy, precision, and selectivity (in descending order): absolute quantitation (what we are doing with L-carnitine and acyl-L-carnitines), semiquantitation, pseudo-quantitation (tandem MS “profiles”), relative quantitation (for example, what is reported in most metabolomic and proteomic studies), and so forth. We consider that in the analysis of clinical samples, we should not accept anything less than selective, absolute quantitation. Though this is achievable using MS, that detection technique alone does not guarantee good, quantitative, clinical methods. However, when adhering to sound analytical principles (such as standardized calibrants used to construct multiple-point calibration curves, and concurrent analysis of quality control samples to monitor and validate performance), the inclusion of the mass spectrometer (a highly selective analyte detection technology) in the clinical laboratory has led and can lead to new accurate, selective, and precise quantitative methods by detecting new classes of compounds with greater efficiency and sensitivity than is possible with older, established technologies.
References
- FDAs Analytical Procedures and Methods Validation for Drugs and Biologics Guidance for Industry. Available at http://www.fda.gov/downloads/drugs/guidancecomplianceregulatoryinformation/guidances/ucm386366.pdf (accessed Aug. 16, 2016).
- H.T. Karnes, G. Shiu, and V.P. Shah Pharm. Res. 8(4), 421–426 (1991).
- F.T. Peters, O.H. Drummer, and F. Musshoff, Forensic Sci. Int.165(2-3), 216–224 (2007).
- A. Schulze, M. Lindner, D. Kohlmüller, K. Olgemöller, E. Mayatepek, G.F. Hoffmann, Pediatrics111, 1399–1406 (2003).
- D.H. Chace, T. Lim, C.R. Hansen, B.W. Adam, W.H. Hannon, Clin. Chim. Acta402, 14–18 (2009).
- T.H. Lim, V.R. De Jesús, N.K. Meredith, M.R. Sternberg, D.H. Chace, J.V. Mei, W.H. Hannon, Clin. Chim. Acta412, 631–635 (2001).
- Y. Maeda, Y. Nakajima, K. Gotoh, Y. Hotta, Y. Kataoka, N. Sugiyama, N. Shirai, T. Ito, and K. Kimura, Bioorg. Med. Chem. Lett. 26, 121–125 (2016).
- D.W. Johnson, J. Inherit. Metab. Dis.22, 201–202 (1999).
- C.L. Hoppel, in Techniques in Diagnostic Human Genetics: A Laboratory Manual, F. A. Hommes, Ed. (Wiley-Liss, New York, 1991), pp. 309–326.
- S.T. Ingalls, P.E. Minkler, C.L. Hoppel, J.E. Nordlander, J. Chromatogr.299, 365–376 (1984).
- P.E. Minkler, S.T. Ingalls, L.S. Kormos, D.E. Weir, and C.L. Hoppel, J. Chromatogr.336, 271–283 (1984).
- P.E. Minkler, and C.L. Hoppel, Clin. Chim. Acta 212, 55–64 (1992).
- P.E. Minkler, S.T. Ingalls, and C.L. Hoppel, Anal. Biochem.185, 29–35 (1990).
- P.E. Minkler and C.L. Hoppel, J. Chromatogr.613, 203–221 (1993).
- P.E. Minkler, E.P. Brass, W.R. Hiatt, S.T. Ingalls, and C.L. Hoppel, Anal. Biochem.231, 315–322 (1995).
- P.E. Minkler, J. Kerner, K.N. North, and C.L. Hoppel, Clin. Chim. Acta352, 81–92 (2005).
- P.E. Minkler, S.T. Ingalls, and C.L.Hoppel Anal. Chem. 77, 1448–1457 (2005).
- P.E. Minkler, M.S. Stoll, S.T. Ingalls, S. Yang, J. Kerner, and C.L. Hoppel, Clin. Chem.54, 145–162 (2008).
- P.E. Minkler, M.S. Stoll, S.T. Ingalls, J. Kerner, and C.L. Hoppel, Anal. Chem.87(17), 8994–9001 (2015).
- P.E. Minkler, M.S. Stoll, S.T. Ingalls, J. Kerner, and C.L. Hoppel, Mol. Genet. Metab.116(4), 231–241 (2015).
- College of American Pathologists CAP/ACMG Biochemical Genetics Participant Summary, BGL-B 2015, pp. 16–17.
- http://www.sepscience.com/Techniques/Sample-Prep/Articles/639-/Sample-Prep-Solutions-2-Just-Enough-Sample-Preparation. Accessed 2016/03/22.
- J.E. Abdenur, N.A. Chamoles, A.E. Guinle, A.B. Schenone, and A.N.Fuertes, J. Inherit. Metab. Dis.21, 624–630 (1998).
- N. Napolitano, V. Wiley, and J.J.Pitt, J. Inherit. Metab. Dis.27, 465–471 (2004).
- S.E. McCandless, R. Chandrasekar, S. Linard, S. Kikano, and L. Rice, Mol. Genet. Metab.108, 51–55 (2013).
- F. Boemer, R. Schoos, V. de Halleux, M. Kalenga, and F.G. Debray, Mol. Genet. Metab.111, 52–54 (2014).
- K. Yamada, H. Kobayashi, R. Bo, T. Takahashi, Y. Hasegawa, M. Nakamura, N. Ishige, and S. Yamaguchi, Mol. Genet. Metab.116, 192–194 (2015).
- T. Kuster, T. Torresani, P. Kleinert, S. Durka, F. Neuheiser, C.W. Heizmann, and H. Troxler, J. Inherit. Metab. Dis.27, 707–709 (2004).
- S. Malvagia, G. La Marca, B. Casetta, S. Gasperini, E. Pasquini, M.A. Donati, and E. Zammarchi, J. Mass Spectrom. 41, 263–265 (2006).
- B.A. Reindl, D.W. Lynch, M. Ramirez, M. Valbracht, L. Davis-Keppen, K.C. Tams, and S. Groeneveld, Pediatrics130(e),1363–1368 (2012).
- L.E. Kratz and J.S. Albert, Clin. Chim. Acta461, 59–60 (2016).
- Y. Maeda, T. Ito, H. Ohmi, K. Yokoi, Y. Nakajima, A. Ueta, Y. Kurono, H. Togari, and N. Sugiyama, J. Chromatogr. B Analyt. Technol. Biomed. Life Sci.870(2),154–159 (2008).
- S. Forni, X. Fu, S.E. Palmer, and L. Sweetman, Mol. Genet. Metab.101, 25–32 (2010).
- Y. Shigematsu, I. Hata, and G. Tajima, J. Inherit. Metab. Dis.33(S), 283–288 (2010).
Paul E. Minkler, Maria S.K. Stoll, Stephen T. Ingalls, and Charles L. Hoppel are with Case Western Reserve University School of Medicine. Direct correspondence to: charles.hoppel@case.edu

New Study Reviews Chromatography Methods for Flavonoid Analysis
April 21st 2025Flavonoids are widely used metabolites that carry out various functions in different industries, such as food and cosmetics. Detecting, separating, and quantifying them in fruit species can be a complicated process.

.png&w=3840&q=75)

.png&w=3840&q=75)


.png&w=3840&q=75)


.png&w=3840&q=75)


