A Miniaturized Method to Determine Epoxidized Soybean Oil in Baby Food
LCGC Asia Pacific
This article describes the development of a routine method to analyse epoxidized soybean oil (ESBO) in baby food...
Philipp Weller, Martina Herrnreiter and Alfred Donaubauer NQAC Weiding/Nestlé Deutschland AG, Frankfurt Am Main, Germany.
Epoxidized soybean oil (ESBO) is widely used in the polymer industry, among other epoxidized vegetable and seed oils.1 These epoxides of fatty acids are known to be highly effective costabilizers for polyvinyl chloride (PVC) and other polymers.2,3 Such stabilizers are mandatory when using PVC because of its poor thermal stability. As a result of its epoxide moieties, ESBO can function as a scavenger for hydrochloric acid,4 which is released by PVC when thermal stress is applied and also as it ages.
ESBO is used as a plasticizer in gaskets in metal caps.3 Glass jars are often used to contain baby food and are usually sealed by metal caps coated with gaskets, consisting mainly of PVC with high amounts of plasticizers.4 Consequently, these gaskets come into direct contact with the food, particularly during sterilization and, afterwards, during storage. The stabilizers and plasticizers used here may constitute as much as 40% of the overall polymer's weight. Most of the additive formulations used for the production of plasticized PVC gaskets contain ESBO in various concentrations.3 Therefore, there is a potential for the migration of ESBO into foodstuffs (depending on the fat content).
The Scientific Committee for Food (SCF) defined a tolerable daily intake (TDI) of 1 mg/kg body weight for ESBO,6 which is the basis for the maximum tolerated migration level of 60 mg/kg in food. For infant nutrition, however, a lowered specific migration level (SML) of 30 mg/kg was introduced by the Directive 2005/79/EC, which was effective from the 19 November 2006.7
Most commonly, ESBO is determined by GC after solvent extraction of the lipids. Since triacylglycerides themselves are not suitable for GC analysis, the next step is usually the derivatization to fatty acid methyl esters (FAMEs).8–10 The fatty acids usually found in ESBO are composed of around 23% epoxidized oleic acid, 54% epoxidized linoleic acid and 8% epoxidized linolenic acid; the rest distributes mainly on palmitic and stearic acid.2,5
In 1988, Castle et al. published a method, using GC–MS to determine the ESBO content of food.11 The procedure is based on the transmethylation of the triacylglycerides by sodium methoxide and, subsequently, the derivatization of the resulting fatty acid methyl esters using boron trifluoride dietherate to form 1,3-dioxolanes. The target molecule is the diepoxy linoleic acid, which after the derivatization shows two well-separated peaks with almost identical mass spectra, which is believed to be the result of the formation of two stereoisomers. The exact structure of both isomers is actually not known. The internal standard (IS), cis,cis-11,14-diepoxyeicosanoate ethyl ester, shows the same behaviour. The structures and the corresponding mass spectra are shown in Figure 1. ESBO is quantified via the derivatives of the epoxidized linoleic acid by referring to the derivatives of the IS.
The basic principle of this method is a good approach to determine ESBO because of its selectivity and suitability on standard routine equipment.
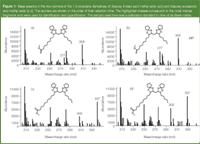
Figure 1
However, this method was not developed for the high sample numbers encountered in routine analysis. Because there is no further clean up of the extracts there is a heavy strain on the analytical equipment, which results in extensive downtimes caused by the need for cleaning. This is a critical issue in terms of cost and time in a routine laboratory.
Consequently, our focus was to develop a rugged, routine method with high selectivity and throughput that would also reduce the strain on the analytical equipment. This would be achieved by developing an appropriate clean-up step before analysis.
One common clean-up technique is gel permeation or size exclusion chromatography (GPC or SEC), which can easily be combined with GC–MS. Today, GPC is standard equipment in most routine laboratories and is highly automatable and simple to use, which are ideal prerequisites for the routine analysis of ESBO in baby food.
Experimental Data
Chemicals: n-hexane, methanol, ethyl acetate and cyclohexane were purchased from J.T. Baker (Griesheim, Germany), isooctane, cyclopentanone, sodium methoxide, boron trifluoride dietherate, anhydrous sodium sulphate and sodium chloride from Sigma-Aldrich (Taufkirchen, Germany). Cis,cis-11,14-diepoxyeicosanoate ethyl ester was purchased from Synphabase (Muttenz, Switzerland) and epoxidized soybean oil was from Cognis (Düsseldorf, Germany). Olive oil was purchased at a local retail store.
Reference standard solutions: For the internal standard (IS) and the ESBO standard solutions, a solution of cis,cis-11,14-diepoxyeicosanoate ethyl ester or ESBO, respectively, was prepared in n hexane [concentration (c) = 1000 mg/L]. An aliquot of the ESBO standard solution was diluted by a factor of 10 with n-hexane (c = 100 mg/L) to obtain a standard solution suitable for calibration purposes.
Sample preparation and extraction: For extraction, 10 g of the homogenized sample (pooled from three jars) were weighed into a 50 mL Sarstedt plastic tube (Sarstedt, Nürnbrecht, Germany). For normal samples, 200 μL of the internal standard (IS) solution were added to the sample (corresponding to 20 ppm). For recovery experiments, 200 μL IS solution and 100 μL ESBO-standard solution (corresponding to 10 ppm) were added. After the addition of 45 mL n-hexane, the plastic tube was shaken vigorously for 2 min. Subsequently, the tubes were placed into a reciprocal shaker and shaken for another 30 min. The tubes were then centrifuged for 10 min at 1000 rpm. The clear supernatant was decanted into a 100 mL conical flask and the solvent was flash-evaporated (300 mbar, 40 °C). The resulting oily residue was redissolved in a small amount of n-hexane, transferred into a 20 mL glass vial with screw cap and the solvent was evaporated in a gentle stream of nitrogen. The residue was subjected to the derivatization procedure.
Transmethylation and derivatization to 1,3-dioxolanes: The transmethylation was performed according to the original Castle method, although the fat residue was smaller (150–200 mg) because of the lower initial sample weight. Furthermore, the concentration of the sodium methoxide solution was increased to 0.04 M and 2.0 g of anhydrous sodium sulphate was added to the residue, followed by 4 mL of the sodium methoxide solution. After cooling down to room temperature in the closed vessel, the residual solvent was evaporated by a gentle stream of nitrogen at ambient temperature. The second derivatization step was performed following the original procedure. Again, the solvent evaporation was performed at room temperature.
GPC clean-up: The apparatus used was a Gilson GPC (Bad Camberg, Germany), consisting of an injector (model 231XL), pump (model 305), manometric module (model 806), dilutor (model 401C) and a fraction collector (model 201). The column used was a 700 × 25 mm i.d. glass column, packed with 50 g Bio Beads S-X3 (300–400 mesh, Bio Rad, Munich, Germany). The solvent system was a mixture of ethyl acetate: cyclohexane 1:1 v/v running at 5 mL/min upward flow. The Gilson Unipoint Software, was used to control the GPC system.
The residue resulting from the derivatization was redissolved in 15 mL of a mixture of ethyl acetate:cyclohexane (1:1 v/v). After filtration through a 0.45 membrane filter, 2.5 mL were subjected to GPC. The fraction eluting at 70–100 mL was collected in a conical flask. The solvent was flash-evaporated at 300 mbar at a maximum temperature of 40 °C to an approximate volume of 2 mL and subjected directly to GC–MS analysis.
GC–MS Detection
Apparatus: All GC–MS analyses were performed on a HP 6890 GC–MS station (Agilent Technologies, Waldbronn, Germany) equipped with a 6890 Autosampler and a 6890 MSD, operating in electrospray ionization (EI) mode. The column was a HP Ultra2 capillary column (HP 19091B-015, Agilent Technologies) the carrier gas was helium. The oven temperature programme was as follows: initial temperature/time: 90 °C/1.00 min; ramp 1: 10 °C/min, final temperature/time: 150 °C/1.00 min; ramp 2: 10 °C/ min, final temperature/time: 300 °C/24.00 min. Front inlet conditions: pulsed splitless mode; initial temperature: 300 °C; pressure: 32.2 kPa; pulse pressure: 100 kPa; pulse time: 2.90 min; purge flow: 29.9 mL/min; purge time: 3.00 min. Injection volume: 1.0 μL. Mass spectra of the two isomers of the ESBO derivative and the IS derivative were acquired in the SIM mode using the following ions: ESBO derivative: m/z 309, 277; IS derivative: m/z 337, 305. The following windows were defined: 5–28 min: m/z 309, 277; 28–49 min: m/z 337, 305. Dwell time was set to 100 ms for each transition. Data were processed with the Enhanced ChemStation software release B.01.00 (Agilent Technologies).
Data processing: All data were processed using Microsoft Excel 2000 (Microsoft, Unterschleissheim, Germany). For the calculation of peak area ratios (PARs), a macro was built.
Calibration: Calibration of ESBO was performed in a blank matrix (olive oil) in the range of 0–3000 ppm using a diluted ESBO standard solution (c = 100 mg/L) and the IS solution (c = 1000 mg/L). Olive oil (1 g) was used for each calibration point and was spiked as follows: 0, 250, 500, 1000, 2000 and 3000 ppm. The IS concentration in the oil was 1000 ppm. For calibration, the peak area ratio (sum of both stereo isomers) of the most intense signals (ESBO derivative: m/z 309; IS derivative: m/z 337) were plotted against the concentration ratios of ESBO: IS. Additionally, peak area ratios of the two isomers within each mass (ESBO: m/z 309, 277; IS: m/z 337, 305) were monitored.
Method Validation: Method validation was performed according to the decision of the European Commission 2002/657/EG at 20 ppm. As a blank matrix, a ready-to-eat product was used (fat content 2%). The decision limit (CCα) and the detection capability (CCβ) were determined, as well as the recovery rate, repeatability (r) and the measurement uncertainty (P = 95%). The measurement uncertainty was calculated based on the intermediate reproducibility (iR).
Results and Discussion
When high sample throughputs are required, several issues arise in employing the procedure according to Castle et al.11 The high sample weights described and the injection of the derivatized extract into the GC–MS system without any further clean-up lead to a very rapid contamination of both the GC system, as well as the mass selective detector (in particular, the ion source), resulting in wear and downtimes not suitable for routine analysis. Furthermore, the solvent volumes used for the extraction are high and, therefore, costly. Consequently, the major aims of the study were to reduce the sample weight to a minimum, but at the same time, retain the necessary sensitivity and simplify the procedure to increase the sample numbers per day.
Extraction Procedure
The original Castle method uses a mixture of n-hexane/acetone (1:1 v/v) for extraction, which carries over significant amounts of water into the organic phase (because of the relatively high polarity), which has to be removed afterwards, for example, by the addition of anhydrous sodium sulphate. It is crucial for the derivatization procedure that excess water is removed completely, as both of the derivatization agents, sodium methoxide and boron trifluoride dietherate, are highly sensitive to water.
The approach was first of all to use pure n-hexane as solvent, because it is immiscible with water. Therefore, additional drying steps should be dispensable and phase separation should be improved significantly. Secondly, the extraction volume was reduced to 45 mL, which corresponds approximately to one fifth of the procedure published.11 A third issue was to evaluate whether a single extraction step is sufficient to extract reasonable amounts of the fat content. In our experiments, the miniaturized single-step extraction method using only n-hexane as extraction solvent yielded 80 ±11% (n = 10) of the lipid content, resulting on average in 120–200 mg fat (depending on the fat content).The extraction efficiency of both ESBO and the internal standard did not show significant discrepancies when a mixture of acetone/n-hexane (1:1 v/v) or pure n-hexane was used. This is an important factor as a discrimination of either ESBO or the internal standard by the extraction solvent would result in false results.
As a result of the reduced sample weight, Sarstedt plastic tubes could be used as extraction vessels, which simplified the extraction procedure drastically. Using this miniaturized extraction technique, the number of extractions per day was easily increased 10-fold.
Transmethylation and Derivatization
It was observed that an increase of the concentration of the sodium methoxide solution to 0.04 M resulted in more reproducible results. It was found to be very important that the temperature of the samples, especially when using a nitrogen stream to evaporate the solvent, was kept below 40 °C after the second derivatization step. It seems that otherwise the intrinsically low-volatile dioxolanes do evaporate almost quantitatively when dissolved in isooctane. Comparative tests were performed with spiked samples, which showed that on application of higher temperatures (>45°C), it was not possible to gain reproducible data.
GPC-clean-up
The central point of this study was to produce cleaner extracts to reduce strain on the analytical equipment. It is, however, difficult to separate substances with highly similar chemical properties and at the same time, keep costs and complexity reasonable. GPC proved to be the method of choice for this task. Because GPC separates according to the molecular mass, it is a prerequisite that the mass differences are high enough, which is not the case for fatty acids and their epoxidized forms. However, the 1,3-dioxolanes selectively formed during the second derivatization step have a significantly higher molecular mass compared with epoxy fatty acids, which eventually allows a satisfactory separation by GPC.
GPC is probably not capable to sharply cut off the dioxolanes, but using this approach, it was at least possible to reduce the content of unwanted substances, such as fatty acid methyl esters, glycerine, carotenoids and other fat-soluble compounds. This resulted in cleaner extracts, as can be seen in the chromatograms presented in Figure 2. Naturally, the total ion current (TIC) shows only the compounds volatile under GC conditions, all other non-volatile compounds, which contaminate the injection system as well, are not visible. It is very likely, however, that the GPC clean-up step also reduces these compounds to a similar degree.
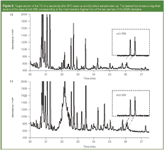
Figure 2
The fraction of interest was determined by reducing stepwise the whole fraction to a volume of 30 mL. This fraction corresponded to 70–100 mL. Nevertheless, adjacent fractions were also collected and subjected to GC–MS analysis. This was done to ensure that parts of the analytes did not remain in another fraction. A measurable discrimination of the analyte (C18 derivative) and the IS (C20 derivative) in the GPC system could not be observed. Therefore, the risk of falsified results through a loss of ESBO or IS should be negligible. As GPC can be automated very easily, the run times of approximately 50 min are in a tolerable range.
GC–MS Analysis
Because cleaner and more diluted extracts are achieved, less contamination of the GC–MS system occurred. The higher dilution required using splitless injection proved to be the method of choice, particularly because it is easily integrated into a routine laboratory where GC–MS-methods for residue analysis using splitless systems are commonly used. The lifetime of the liner was at least doubled (>50 sample runs) and the cleaning intervals were reduced. The injection volume could be increased to 2 μL without any observable long-term effects, which allows an enhancement of sensitivity. An increased injection volumne, however, should not be necessary as the high sensitivity of the method ensures that even with an injection volume of 1 μL, the legislative requirements can be met at any time. This is of particular interest, as the specific migration level (SML) for ESBO in infant formulae has been recently lowered by factor of two.7 Figure 3 shows a section of a chromatogram, obtained from a routine sample, spiked at 5 ppm and demonstrates the ample scope of sensitivity of the method.
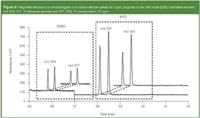
Figure 3
To deal with possible interferences in the mass spectra, peak area ratios (PARs) of the two stereoisomers were monitored at m/z 337, 305, 309 and 277 over a longer time-period as an on-line-control and were used to define thresholds of acceptability. It was observed that the ratios were fairly constant and this would suggest that these data could be used as quality criteria for the analysis (Table 1).

Table 1: PARs and respective standard deviations of the two stereo isomers of the derivative of ESBO (m/z 309, 277) and the IS (m/z 337, 305) at different concentration levels. PARs of multiple routine samples with different ESBO contents were also calculated.
Furthermore, it was demonstrated that upon using extracts without GPC clean-up for GC–MS analysis, these ratios showed stronger deviations, which indicates matrix interferences.
To verify the applicability of this approach, multiple routine samples were also analysed. It seems that the ESBO derivatives are more affected from matrix interferences than the IS because the highest deviations were observed in the PARs of ESBO in samples without GPC clean up. This underlines the need for an adequate clean-up procedure.
An acceptance threshold of ±15% for the peak ratios (referring to a spiked olive oil as a blank matrix) was evaluated and proved to be applicable in all investigated matrices.
This should be of practical use for the verification of the results, as the ratios of the formation of the two stereoisomers are expected to be constant under defined conditions. Matrix interferences were minimized or at least identified when using this additional data for routine purposes.
Method Validation
With regard to the recently lowered SML of 30 mg/kg for ESBO in infant formulae and to provide enough scope for sensitivity, the method was validated at a level of 20 ppm by following the requirements of the directive 657/2002/EG and showed high selectivity and high reproducibility. The decision limit (CCα) and the detection capability (CCβ) were also calculated. (Table 2) The calibration showed high linearity (r2 = 0.999) in the required range. Results from recovery experiments were satisfactory (93 ±5.4%). Recovery rates in spiked routine samples, measured over a longer period of time were also satisfactory (95.0 ±19.9% at 10 ppm level, n = 34). To estimate the measurement uncertainty (u) at the validation level of 20 ppm, the standard deviation (SD) of the intermediate reproducibility (iR) was multiplied by the coverage factor of k = 2 for a confidence level of 95%, which resulted in u = 2.09 mg/kg.
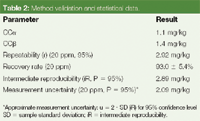
Table 2: Method validation and statistical data.
Conclusions
This study showed the applicability of GPC in the routine analysis of ESBO in baby food and underlines the need for an efficient clean-up to reduce strain on the equipment. It was demonstrated that a miniaturized work-up procedure allowed a sufficient extraction to maintain sensitivity and to simplify the method. Minor modifications of the Castle method yielded in higher reproducibility and facilitated handling significantly, in particular the formerly problematic extraction procedure. The subsequent GPC clean-up step resulted in notably cleaner extracts and, consequently, reduced downtime of the GC–MS system.
Using this method, it is possible to use standard equipment, allowing seamless integration into routine analysis. The study also emphasized the importance of selective techniques such as mass selection detection (MSD) to reduce the risk of inaccurate results. Monitoring of PARs was applicable to routine samples and proved to be a valuable tool for QC. This study showed the potential of miniaturized methods in routine analysis environments and the importance of adequate clean-up procedures. Of course, it should be straightforward to scale down the method further for foodstuffs other than baby food, depending on their fat content.
Philipp Weller, PhD, is a food chemist and has developed and established new measurement methods for the quality control of baby food at the NestlE9 Quality Assurance Center (NQAC) in Weiding. Meanwhile, he works as a laboratory manager for BASF AG in the structure elucidation of agricultural products.
Martina Herrnreiter is a laboratory technician at the NestlE9 Quality Assurance Center (NQAC) in Weiding and responsible for GC–MS analyses and quality management systems.
Alfred Donaubauer is a food chemist and is manager of the residue and contaminants analysis unit of the NestlE9 Quality Assurance Center (NQAC) in Weiding.
References:
1. A. Campanella and M.A. Baltanás, Latin American Applied Research, 35(3), 211–216 (2005).
2. The EFSA Journal, 64, 1–17 (2004).
3. ILSI 2004, New Report on Paper and Board for Food Packaging Applications. Chapter 5: Polyvinyl chloride (PVC) for food packaging applications . ILSI Europe Report Series (2004).
4. L. Fantoni and C. Simoneau, Food Additives and Contaminants, 20(11), 1087–1096 (2003).
5. M. Ash and I. Ash, Epoxidised Soyabean oil. Handbook of Food Packaging Chemicals and Materials: Synapse Information Resources (Endicott, NY, USA) (430) (1999).
6. Scientific Committee for Food, Compilation of the evaluations of the Scientific Committee for Food on certain monomers and additives used in the manufacture of plastic materials intended to come into contact with foodstuffs until 21 March 1997. Reports of the Scientific Committee for Food (42nd series). European Commission, Luxembourg (1999).
7. Commission Directive 2005/79/EC, amending Directive 2002/72/EC relating to plastic materials and articles intended to come into contact with food. Journal of the European Union, L303/25 (2005).
8. P.G. Demertzis, K.A. Riganakos and K. Akrida-Demertzi, European Polymer Journal, 27, 231–235 (1991).
9. L. Castle et al., J. Chrom. A, 657, 261–266 (1994).
10. L.M.T. Han and G. Szajer, J.A.O.C.S., 71, 669–670 (1994).
11. L. Castle, M. Sharman and J. Gilbert, J. Assoc. Off. Anal. Chem., 71(6), 1183–1186 (1988).
Analytical Challenges in Measuring Migration from Food Contact Materials
November 2nd 2015Food contact materials contain low molecular weight additives and processing aids which can migrate into foods leading to trace levels of contamination. Food safety is ensured through regulations, comprising compositional controls and migration limits, which present a significant analytical challenge to the food industry to ensure compliance and demonstrate due diligence. Of the various analytical approaches, LC-MS/MS has proved to be an essential tool in monitoring migration of target compounds into foods, and more sophisticated approaches such as LC-high resolution MS (Orbitrap) are being increasingly used for untargeted analysis to monitor non-intentionally added substances. This podcast will provide an overview to this area, illustrated with various applications showing current approaches being employed.


