Mind the Diluent: Effects of Sample Diluent on Analyte Recovery in Reversed-Phase and HILIC Separations
LCGC Europe
The sample solvent can have a big impact on peak shape in both reversed-phase and hydrophilic interaction liquid chromatography (HILIC) separations, especially when large volumes are injected. Diluting the sample with weak solvent can be an effective solution to mitigate this problem, but we have to be careful to not lose analytes of interest to precipitation or phase separation.
The sample solvent can have a big impact on peak shape in both reversed-phase and hydrophilic interaction liquid chromatography (HILIC) separations, especially when large volumes are injected. Diluting the sample with weak solvent can be an effective solution to mitigate this problem, but we have to be careful to not lose analytes of interest to precipitation or phase separation.
In the August 2019 instalment of “LC Troubleshooting”, I wrote about one of the hot topics that was discussed by several speakers at the HPLC meeting in Milan, Italy, in June-coupling of ion-exchange separations to mass spectrometric (MS) detection (1). This month, I’d like to discuss another topic addressed at the meeting. Anne Mack gave a talk that highlighted some things to consider when deciding whether to use reversedâphase or hydrophilic interaction liquid chromatography, (HILIC) especially when some of the components of the sample mixture at hand are hydrophilic. These considerations included the relative retention of the analytes of interest under reversed-phase and HILIC conditions, the effect of the sample diluent and injection volume and peak shape, and the effect of the sample diluent on apparent recovery of the analyte. The recovery aspect nicely complements the LC Troubleshooting article I wrote in January 2019 on the effects of the diluent on peak shape (2), so I’ve asked Anne to join me in writing this month’s instalment of “LC Troubleshooting”.
Dwight Stoll
Liquid chromatography (LC) is an incredibly versatile analytical tool, enabling quantitative and qualitative analysis of diverse molecule types, ranging from highly hydrophilic and water soluble (for example, inorganic metal ions) to highly lipophilic molecules that are soluble in organic solvents (for example, lipids). The reversed-phase mode of separation is arguably the most versatile single mode of LC separation, and can provide retention and separation of analytes covering a wide range of water solubility. In an extreme case, it could separate molecules as hydrophilic as small organic acids (like succinic acid [3]) and as lipophilic as fat soluble vitamins (like vitamin A [4]). However, a practical problem we run into quickly is that molecules as different in properties as these will not be highly soluble in the same sample solvent. In the worst case, choosing an inappropriate sample solvent or diluent will lead to inaccurate results, particularly for quantitation, because the analytes of interest will not be soluble in the sample solvent, and the sample that is injected into the LC instrument will not be representative of the analytes actually present in the sample vial.
The problem described here is not new by any means. But, as we push the limits of analytical methods in the reach for more speed, simplicity, and sensitivity, we inevitably run into conditions that will “break” the method, leading to inaccurate results. Therefore, we have to be careful not to break our methods, and a deeper understanding of where the limits lie and the basis for them puts us in a better position to be successful in the long run.
Review: Effects of Sample Diluent and Injection Volume on Peak Shape
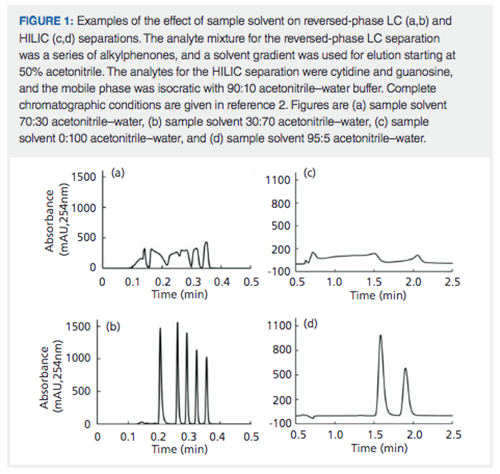
As users of LC, it is common to encounter situations where the samples presented to us from some prior process or step contain a sample solvent that is quite different from the mobile phase associated with the LC method used for the analysis of the sample. For example, when using solid-phase extraction (SPE) to preconcentrate low-concentration analytes from water samples, the last step in the SPE process typically involves elution of the analytes of interest from the SPE adsorbent using an organic solvent like methanol. Frequently, such extracts are subsequently analyzed by reversed-phase LC, with solvent gradient elution that starts with a water-rich mobile phase. On the other hand, we might be interested in analysis of the water-soluble components from a urine sample. In this case, the sample solvent is water, while the HILIC separation will start with a mobile phase containing a high fraction of acetonitrile on the order of 90%. These mismatches between the solvent composition of the sample and the mobile phase of the LC method can lead to trouble. In January of this year, we wrote about how the combination of the volume of sample that is injected and the sample solvent composition can have a dramatic effect on peak shape. As a reminder of the data discussed in that instalment, Figure 1 shows examples of bad results obtained under reversed-phase and HILIC conditions, and how much better separations can be obtained simply changing the sample solvent. In the case of the reversed-phase separation, terrible peak shape is observed (Figure 1[a]) for some simple alkylphenones when the sample solvent contains 20% more acetonitrile than the starting mobile phase used for the solvent gradient elution program. However, simply changing the sample solvent to contain 20% less acetonitrile than the starting mobile phase in the gradient leads to a much nicer separation (Figure 1[b]). Similar effects can be observed in HILIC separations as well. Figure 1(c) shows the terrible peak shapes that are observed when a completely aqueous sample is injected into a HILIC column when the mobile phase contains 85% acetonitrile. However, this separation can also be improved dramatically by simply changing the sample solvent composition to contain 95% acetonitrile, as shown in Figure 1(d).
Recognizing the importance of the sample solvent composition, particularly when the injection volume is large relative to the column volume, several different groups have developed a number of approaches to address this issue. The simplest approach is to adjust the sample solvent composition offline-that is, by addition of “weak solvent” (for example, water in reversed-phase, or acetonitrile in HILIC separations) as part of the sample preparation process prior to the LC separation. For example, in the case of the SPE extract in methanol described above, one could simply dilute this extract with some amount of water prior to analysis.
Other approaches described over the years include:
- On-line dilution of the sample with weak solvent in the autosampler needle; this is sometimes referred to as “sandwich injection” (5).
- On-line dilution of the sample with weak solvent by deliberately adding a mixer between the sample injection point and the column inlet (6).
- On-line dilution of the sample with weak solvent during injection into the LC column-this is sometimes referred to as at-column dilution, and requires an auxiliary pump to deliver the diluent (7).
- On-line dilution of the sample with weak solvent during injection by splitting the mobile phase flow path to achieve in-line mixing of the sample and diluent (8).
While these approaches have been used with conventional oneâdimensional LC (1D-LC), this issue is also very important in twoâdimensional (2D)âLC, and a variety of approaches have also been developed to address the problem in the context of 2D-LC specifically (9–12).
As with most challenges in chromatography, there is no perfect solution to this sample solvent matrix issue, and all of these approaches have advantages and disadvantages. Common to all of them, however, is the question, How much dilution is enough? This is obviously a very practical question that must be confronted in method development. Unfortunately, there is no universal answer that is suitable for all types of separation and analyte. Most often, the answer for a particular situation is determined by experiment, and typically the primary focus of such experiments is the effect of the sample solvent on peak shape. In this instalment we address a secondary, but still important concern-analyte recovery.
Effect of Sample Diluent on Analyte Recovery: HILIC Separations
As discussed above, one straightforward approach to address the effect of the sample solvent mismatch relative to the mobile phase is to simply dilute the sample with weak solvent, mix, and inject. However, we have to be careful that when the diluent is added the sample solution remains homogeneous. Two mechanisms that can result in a heterogeneous solution are: 1) precipitation of some analytes or matrix components such that solids and liquids are present in the sample; and 2) phase separation of some analytes or matrix components such that two or more liquid phases are present after adding the diluent. Both of these outcomes are undesirable because the material sampled from these heterogeneous solutions will not be representative of the entire sample, and will lead to inaccurate quantitative results. For samples that contain analytes with similar physicochemical properties, these outcomes can easily be avoided by doing a few scouting experiments to see when or if precipitation or phase separation occurs. However, avoiding these outcomes can be more challenging when the components of the sample are more diverse in terms of their solubilities in the sample solvent, particularly when the diluent is added.
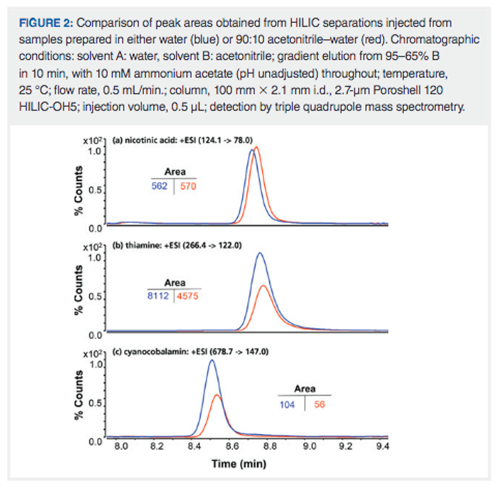
Figure 2 shows an example of this problem in the context of use of a HILIC method for the analysis of a sample containing water-soluble vitamins. For nicotinic acid (Figure 2[a]) the observed peak area is nominally the same whether the sample is prepared in a matrix of 100% water, or 90:10 acetonitrile–water. However, for thiamine and cyanocobalamin (Figures 2[b] and 2[c], respectively), the observed peak areas in the 90:10 acetonitrile–water matrix are roughly 50% of the area observed when the sample is prepared in 100% water and all other conditions are the same. This suggests that thiamine and cyanocobalamin are not fully soluble in 90:10 acetonitrile–water, and some of the analyte precipitates from the sample matrix before it is sampled for analysis. In a case like this, the effect of the diluent on analyte recovery must be studied, and taken into consideration when deciding what sample solvent composition will be used for the final method.
Effect of Sample Diluent on Analyte Recovery: Reversed-Phase Separations
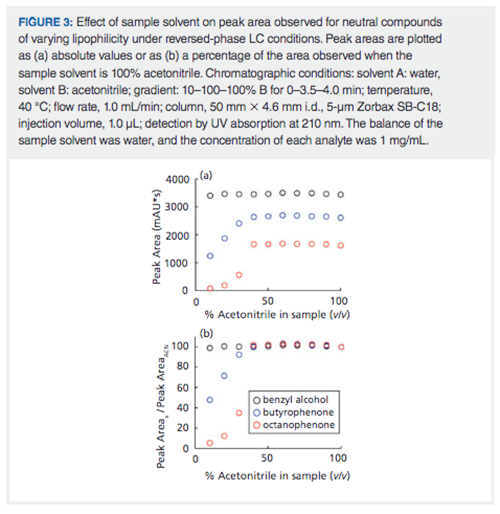
The sample diluent can adversely affect analyte recovery in reversed-phase LC separations as well. To illustrate this effect, we prepared an analyte mixture of benzylalcohol, butyrophenone, and octanophenone-all at 1 mg/mL-in different sample solvents ranging from 10:90 acetonitrile–water to 100% acetonitrile. The predicted water solubilities for these compounds are 15, 0.34, and 0.0037 mg/mL, respectively (www.chemicalize.com). Based on this, we would expect to see consistent peak areas over the full range of sample solvent compositions for benzyl alcohol. On the other hand, we would expect to see consistent peak areas for the lipophilic butyro- and octanophenones in the samples with high levels of acetonitrile, but lower areas in the waterârich samples, because of the low water solubilities of these molecules. Figure 3(a) shows the absolute peak areas measured for the three compounds at each solvent composition; Figure 3(b) shows the same data, but normalized to the area observed with the sample prepared in 100% acetonitrile. As expected, we see consistent peak areas for benzyl alcohol across the entire range of sample solvents. Note that the areas for intermediate sample solvent mixtures are slightly greater than 100%. This is most likely due to the volume contraction of acetonitrile–water mixtures, given the way the samples were prepared (for example, for the 50% acetonitrile sample, 500 µL of water was added to 500 µL of acetonitrile, and this results in a mixture that has a volume of about 970 µL). However, for butyro- and octanophenone we see that consistent peak areas are observed down to 40% acetonitrile, but then there is a precipitous decrease in the peak area, with the decrease more dramatic for octanophenone than for butyrophenone. This results from the formation of two phases in the samples with 30% acetonitrile or less because of the very low water solubilities of these compounds. Given that their densities are lower than that of water, there is probably a top layer of the solution in the HPLC vial that is enriched in these compounds, but not sampled by the autosampler needle, which samples from well below the liquid surface.
Closing Thoughts
In the everyday practice of LC it is common to encounter samples where the sample solvent composition is very different from the mobile phase used in the LC separation. When injecting volumes of these samples that are large relative to the volume of the column itself, this can lead to poor peak shape. Several approaches have been developed to overcome this challenge, most of which involve dilution of the sample with weak solvent prior to or during the injection step. While this can be an effective remedy for poor peak shapes, we must be careful to avoid analyte precipitation or phase separation of the sample as a result of adding too much of the weak solvent diluent. The level of diluent that is considered too much is compound dependent, but can be determined experimentally through simple screening experiments.
References
- D.R. Stoll, LCGC Europe32(8), 405–409 (2019).
- D.R. Stoll, LCGC Europe32(1), 16–20 (2019).
- D.R. Stoll, LCGC Europe32(4), 190–194 (2019).
- S. Bäurer, W. Guo, S. Polnick, and M. Lämmerhofer, Chromatographia82, 167–180 (2019). doi:10.1007/s10337-018-3615-0.
- D.R. Stoll, D.C. Harmes, G.O. Staples, O.G. Potter, C.T. Dammann, D. Guillarme, and A. Beck, Anal. Chem.90, 5923–5929 (2018). doi:10.1021/acs.analchem.8b00776.
- Z. Breitbach, C. Randstrom, J. Chang, M. Lesslie, G. Webster, and D. Stoll, LCGC Europe32(6), 298–302 (2019).
- U.D. Neue, C.B. Mazza, J.Y. Cavanaugh, Z. Lu, and T.E. Wheat, Chromatographia57, S121–S127 (2003). doi:10.1007/BF02492093.
- A. McKay, M. Perkins, and J.A. Field, LCGC Europe28(5), 265–271 (2015).
- Y. Oda, N. Asakawa, T. Kajima, Y. Yoshida, and T. Sato, J. Chromatogr. A541, 411–418 (1991). doi:10.1016/S0021-9673(01)96013-3.
- C. Doneanu, A. Xenopoulos, K. Fadgen, J. Murphy, St.J. Skilton, H. Prentice, M. Stapels, and W. Chen, MAbs4, 24–44 (2012). doi:10.4161/mabs.4.1.18748.
- D.R. Stoll, K. Shoykhet, P. Petersson, and S. Buckenmaier, Anal. Chem.89, 9260–9267 (2017). doi:10.1021/acs.analchem.7b02046.
- Y. Chen, J. Li, and O.J. Schmitz, Anal. Chem.91, 10251–10257 (2019). doi:10.1021/acs.analchem.9b02391.
Anne E. Mack is an Application Scientist at Agilent Technologies, in Wilmington, Delaware, USA.
Dwight R. Stoll is the editor of “LC Troubleshooting”. Stoll is a professor and co-chair of chemistry at Gustavus Adolphus College in St. Peter, Minnesota, USA. His primary research focus is on the development of 2DâLC for both targeted and untargeted analyses. He has authored or coauthored more than 60 peer-reviewed publications and four book chapters in separation science and more than 100 conference presentations. He is also a member of LCGC’s editorial advisory board. Direct correspondence to: LCGCedit@mmhgroup.com


.png&w=3840&q=75)

.png&w=3840&q=75)


.png&w=3840&q=75)


.png&w=3840&q=75)
