Maximizing Throughput with Optimized Column Lengths and Particle Diameters
LCGC Europe
The throughput of a lab can be optimized with the optimum particle diameter and column length for a specific stationary phase.
The throughput of a laboratory can be optimized by selecting the optimum particle diameter and column length for a specific stationary phase. This selection can be made using a step-by-step method based on the recently established kinetic plot method for gradient separations. An example involving the separation of environmental pollutants demonstrates how this approach worked in practice.
The mailboxes of analysts and laboratory managers are constantly being bombarded with advertisements of new advances in HPLC instruments and stationary phases. Choosing between all these different options is not straightforward because, compared to ten years ago, HPLC instruments can now deliver much higher pressures (up to a threefold increase), leading to dazzling separation speeds. The columns have also improved in performance, particularly with the introduction of sub-2-µm and porous-shell particles (1–9).
This article proposes a straightforward step-by-step method that can be used by analysts to decide on the optimum instrument and column configurations for their typical range of applications. More specifically, the method aims to maximize the throughput of a given instrument or section of the chromatography laboratory by selecting the optimum particle size, particle type and column length to provide the highest possible peak capacity in an allocated time. This approach aims to achieve maximum peak capacity and provides a generic way to maximize the probability of resolving any sample with randomly distributed peaks.
Working under maximum peak capacity conditions increases this probability, as has been elegantly demonstrated by Davis and Giddings (10).
The method is based on the so-called kinetic plot method (11–14) and has a sound physical and mathematical foundation. Until recently, the kinetic plot method was limited to isocratic separations, and was mainly used to compare the intrinsic quality of different column and support types (1,5,9,15–18). Recently, however, the method has been extended to gradient separations (8,19–21), which makes it more useful in the day-to-day practice of chromatographers because it can be used to optimize such separations. It was demonstrated that, as long as the 'mobile phase history' (19) experienced by the components is the same for different columns length and flow-rates, the underlying extrapolations of the kinetic plot method remain valid in gradient separations. This condition can easily be achieved if the gradient time (tG) and system dwell time (tdwell) [the delay before the gradient slope reaches the column], are scaled proportional to the column dead time (t0). For example, if the flow-rate is doubled, the t0-time is halved and therefore tG should also be halved to keep the ratio of tG/t0 constant. Note that a doubling of the flow-rate also halves tdwell , hence no adjustment is necessary for a constant ratio of tdwell/t0. In another case, if the column length is doubled, t0 is doubled and therefore tG should also be doubled. Since tdwell is not affected for a change in column length an additional isocratic hold equal to tdwell should be added before to the gradient, to keep their ratio constant. Fortunately, these are also the conditions needed to keep the same effective retention factor (and hence the same selectivity), and to obtain the same degree of peak compression (19).
In this article, the kinetic plot method is used to select the optimum combination of particle size and column length as a function of the "difficulty" of the samples or separations being run on a given instrument for a specific stationary phase (22). The benefits of this method are illustrated using an example where the column length and the particle size of a specific C18 stationary phase are optimally tuned. It is also demonstrated how the performance of different particle types (i.e., from different vendors) or morphologies (e.g., fully porous and superficially porous particles) can be compared.
Experimental
Uracil (t0-marker), 2-napthoic acid, 2-hydroxyquinoline, quinoline, 1-indanone, 2-naphthalenol, 9-hydroxyfluorene, benzofuran, carbazol, indene, indane, dibenzofuran and fluorene were purchased from Sigma-Aldrich (Steinheim, Germany). Acetonitrile (ACN) gradient grade for HPLC was purchased from Merck (Merck, Darmstadt, Germany) and HPLC-grade water was prepared in the laboratory using a Milli-Q Advantage (Millipore, Bedford, Massachusetts, USA) water purification system. Waters Acquity UPLC BEH C18 2.1 × 50 mm, 2.1 × 100 mm (1.7 µm) and XBridge C18, 2.1 × 150 mm (5 µm) columns were purchased from Waters (Milford, Massachusetts, USA). Xbridge BEH C18 columns, 2.1 × 150 mm, (3.5 µm) were custom-made by Waters. These columns were packed in UPLC hardware designed for use with sub-2-µm packings to withstand 1000 bar operating pressure (23). A second set of columns consisted of four 4.6 × 100 mm columns: XBridge C18 3.5 µm purchased from Waters, ACE C18 3 µm purchased from Advanced Chromatography Technologies (Aberdeen, UK), Kinetex C18 2.6 µm columns purchased from Phenomenex (Torrence, California, USA) and Halo C18 2.7 µm purchased from Advanced Materials Technologies (Wilmington, Delaware, USA).
The measurements were performed on an Agilent 1290 Infinity system with a binary pump and a diode array detector (DAD) with a Max-Light cartridge cell (10 mm path length), an autosampler, a temperature-controlled compartment set at 25 °C for all experiments and operated with the Agilent Chemstation software. The absorbance values were measured at 210 nm with a sample rate of 40 Hz and the peak widths were determined using the width at half height. Samples consisting of 0.04 mg/mL uracil and 0.10 mg/mL for each of the other components were dissolved in 50/50 (v%/v%) ACN/H2O.
The injected sample mixture volume was 0.5 µL for the 2.1-mm i.d. columns and 2 µL for the 4.6-mm i.d. columns. For the 2.1-mm i.d. columns, the separations were performed in gradient mode with a mobile phase ramp from 15% to 70% ACN in H2O with 10 mM ammonium acetate in an optimized gradient time tG with tG/t0 = 12.3 (constant ratio for the different flow-rates), resulting in an elution window between k = 2 and 12. The same gradient conditions were used for the Xbridge 4.6-mm i.d. column. For the other three columns, the value of tG/t0 was kept constant but the initial and final mobile phase compositions were 16% and 75% ACN (ACE), 12.5% and 73.5% ACN (Halo) and 13.5% and 68.5% ACN (Kinetex). The system dwell volume was 120 µL.
Selection of Optimum Particle Size and Column Length for a Specific Stationary Phase
In this section the different steps in the selection of the optimum particle size and column length are described.
Selection of Representative Sample and Test Gradient Conditions: The first, and probably most difficult step in the whole procedure is to define a test mixture representative of the type of samples one expects to run frequently on a given instrument. The test mixture should contain weakly and strongly retained compounds, so that the components elute easily over the entire gradient window. In addition, one should also try to include components that display the broadest possible range of expected band broadening behaviour (e.g., by including components reputed of leading to tailing peaks or being subjected to a strong band broadening, etc (24).
In this example 12 environmental pollutants typically found in groundwater at tar-oil-contaminated sites were selected (see Experimental section). The set of compounds consisted of two- and three-cyclic PAHs, more polar N- and O-heterocyclic aromatic compounds, homocyclic compounds and selected metabolites and represent both neutrals and compounds with acidic and basic functionalities. The gradient conditions were chosen so that the components in the sample were spread over a sufficiently wide elution window, from somewhere around k = 2, up to k = 12. Of the 12 compounds selected initially, four were left out as they were eluting too closely to one of the other compounds, thus preventing an accurate determination of their width and tailing effects. For each co-eluting pair, we retained the compound with the strongest band broadening, in order not to overestimate the expected performance.
Figure 1 shows the chromatogram of the final selection of test compounds. The corresponding gradient conditions are given in the experimental section and the caption of Figure 1. In order not to overemphasize the contribution of any specific part of the elution window, component number 6 and 7 were left out of the peak capacity calculation.
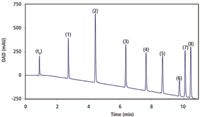
Figure 1
Performance Measurements on a Fixed Column Length: Once the gradient conditions (start and end composition of the mobile phase and the value of tG/t0) are set, the performance of each column should be measured over the full range of available flow-rates or pressures. To keep the ratio of tG/t0 constant, the gradient time tG needs to be changed inversely proportional to the imposed flow-rate or pressure (i.e., tG must be doubled when the flow-rate is halved). In doing so, the selectivity of the separation is maintained and the retention window remains the same, independently of the applied flowrate. The chromatogram obtained for each flow-rate should then be analysed by recording the total analysis time (i.e., the elution time of the last eluting peak, denoted as tR,last) and by determining the peak width (wt,i) for each individual peak to calculate the total peak capacity (np) using:

where σt,i is the standard deviation of the i-th peak in the chromatogram, wt,i is the corresponding peak width (at 13.4% height) and n is the number of peaks in the chromatogram over which the performance is averaged (in our case n = 6). The reader will note that in the definition given in Equation 1, the peak capacity is calculated across an elution window running between the void peak (unretained component peak) and the last eluting peak of the sample. Obviously, one can also prefer to use other peak capacity definitions available in literature (see, for example, Equation 4 in reference 19, or in the overview given in reference 25). Once the peak capacity is recorded for each considered flow-rate, this information can be plotted against the total analysis time tR. In general, a plot of the type shown in Figure 2 (black curve and open symbols) is then obtained.
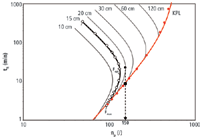
Figure 2
The point obtained for the lowest pressure or flow-rate (Fmin, top data point of the black curve) is the one corresponding to the highest analysis time. Increasing the flow-rate from this point on, subsequently gives rise to a decrease in analysis time and a higher peak capacity, until a flow-rate (Fopt) is established that corresponds to the optimum mobile phase velocity, that is, the flow-rate corresponding to the minimum of the Van Deemter curve. Further increasing the flow-rate and the pressure leads to a further reduction of the analysis time. In this range, however, also the peak capacity reduces because the flowrate has now entered the C-term-dominated regime of the Van Deemter curve, which is the region where the band broadening increases with flow-rate. The flow-rate can be increased until the maximum affordable pressure is obtained (leading to F = Fmax).
The experimental data represented in Figure 2 (open symbols) are the results of measurements at 11 different flow-rates, each in triplicate, of which the average values are reported. Of course, it is not necessary to measure such a large number of flow-rates (as will be explained later) or doing duplicate or triplicate measurements to apply the kinetic method. As in any experimental study, a trade-off has to be made between measurement time and accuracy of the subsequent predictions.
Effect of Column Length: Repeating the experiments on different columns lengths, while maintaining the same gradient steepness (constant tG/t0), would lead to a similar curve, but shifted in the time versus peak capacity plot. This is illustrated in Figure 2 by the added gray curves. Connecting the end points of the different length curves (the points at which the maximum flow-rate, Fmax, is reached), a new curve is obtained (indicated in red). This is the so-called kinetic performance limit curve, or in short KPL-curve (19,26), connecting the best possible kinetic performances one would obtain if examining an array of columns with different lengths, all filled with the same type of particles, and each column used at the maximum pressure.
As shown in reference 19 the kinetic performance limit curve (red curve superposed to Figure 2) cannot only be obtained by connecting the Fmax performance measured on a large set of different length columns, but can also be calculated directly from the performance (tR and np) and pressure drop (Pexp) measured on a single column, using the following set of equations:
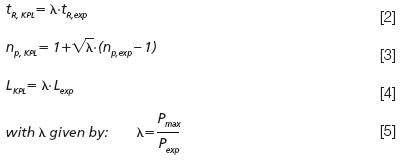
where Lexp is the column length on which the experiments where performed, λ is the column length rescaling factor (19) and the subscript KPL corresponds to values on the kinetic performance limit. In Equation 5, Pexp is the maximum pressure reached during the gradient run and Pmax is the reference pressure for which the kinetic performance limit curve needs to be established (typically Pmax would be the maximum affordable instrument or column pressure). Hence for every value of Pexp, a different point on the KPL-curve is calculated. These equations can easily be implemented in a simple spread sheet (27). The single assumption underlying this extrapolation is that the analytes experience the same relative band broadening process, which is automatically fulfilled by keeping tG/t0 constant (19). Some small exceptions to this rule may arise when viscous heating effects become important, but these effects remain very small when the maximal operating pressure lies in the range of 1000 to even 1500 bar if the columns are not placed in a forced air oven or water bath (19).
The data represented in Figure 2, where the red curve connects the points of maximum pressure, clearly illustrates a paradigm that is well known, that is that the best kinetic performance from a column is achieved when operating the column at its maximum pressure (28). This can be noted from the fact that for each data point on the (gray) fixed length curves, it is always possible to find a point on the red curve that gives a better combination of analysis times and peak capacities. This was already demonstrated for isocratic separations (26) but is reconfirmed here for gradient separations. The dashed arrow added to Figure 2, for example, clearly illustrates that, if one needed a gradient peak capacity of 150, this would be achieved in only 9 min using a 30 cm column at Pmax (see black square positioned at the KPL-curve), whereas it would take about 20 min with a 20 cm column operated at its optimum flow-rate (see black full circle).
Optimizing Particle Diameter and Column Length: The analysis described previously was subsequently repeated for the two other selected particle sizes with the same chemistry, that is 1.7 µm and 5 µm particles, to establish the corresponding kinetic performance limit curves. Figure 3(a) shows the obtained results in an overlay plot. Using Equation 4, it is also straightforward to plot the corresponding column lengths. These are shown in Figure 3(b).
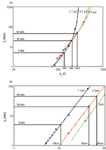
Figure 3
Typically, an analyst will develop a method targeting a certain typical analysis time, depending on the degree of difficulty of the sample under consideration. This classification could go as follows (the mentioned separation times obviously are only indicative and can be replaced by any another desired value). For easy separations (highthroughput), one would typically aim for a 5 min separation. For a more difficult sample, one would rather aim for a 20 min separation, whereas for the most complex samples one would settle for an analysis time of 45 min. The direct use of a kinetic plot data set as shown in Figure 3, is that now the optimum particle size and the corresponding column length, corresponding to each of the three major degrees of separation difficulty, can be readily read-out from the represented curves. In this specific example, the maximal peak capacity for 'easy' separations (5 min of analysis time) would be achieved using a 10-cm-long column packed with 1.7 µm material, whereas the 'medium' difficulty separations (20 min of analysis time) would best be tackled with a 45-cm-long column (obtained by coupling 3 × 15 cm long columns for example) packed with the 3.5µm material. The most difficult separations (45 min of analysis time), finally, can best be solved using a 66-cm-long column (which can be approximated by coupling four 15-cm-long columns for example), also using 3.5-µm particles. The corresponding achievable peak capacities can be directly read out from the x-axis of Figure 3(a).
Note that in the present example we considered 3.5-µm particle columns that could be operated at 1000 bar (23). Obviously these are not commercially available. In addition, ultra-high pressure systems are not always available in a laboratory. However, by using a value of Pmax = 400 bar in Equation 5, the same design exercise can also be repeated for the more classic operating pressure (as illustrated further on in Figure 5). The outcome would be very similar, with the same pattern of overtaking curves, slightly shifted to the upper-left corner however. Because the pressure limit can easily be changed in the plots (Pexp is a design variable in Equation 5), this proposed design strategy can be readily used to assess the potential gain in performance one could achieve when purchasing a new instrument with a higher maximum operating pressure.
As mentioned in the section on "Performance Measurements in a Fixed Column Length" it could be argued that the application of the kinetic plot method as presented in Figure 3 requires a too many experiments for day-to-day practitioners. However, it is not necessary to measure such a large number of data points as described here. For example, if only one data point at the maximum operating pressure, two near the optimum mobile phase velocity and one at an intermediate velocity are measured, roughly the same plots can be established. This is illustrated in Figure 3, where it can be seen that by connecting only these data points (represented by the larger symbols), the same trends and optimum particle size selection can be found as with the extended data set.
Optimized Chromatograms: As an example of the performances that can be obtained with the optimized systems for the three considered degrees of difficulty, the chromatograms of a series of kinetically optimized separations are represented in Figures 4(a)–(c). For these cases, all 12 components were injected. Figure 4(a) illustrates the best possible separation for the chromatographic conditions chosen in roughly 5 min, using 1.7-µm particles. Figure 4(b) and Figure 4(c) show the best separations in 20 and 40 min respectively by using 3.5-µm particles. The closest we could get to the optimum required column length (66 cm) for the 45 min separation was by coupling four 15-cm-long columns, hence the fact that the high-efficiency separation was completed in 40 min rather than in the desired 45 min. The observed peak capacities and analysis time for the performed separations were found to vary only little (< 5%) from those predicted by the KPL-curves constructed in Figure 3(a).

Figure 4
Comparing the Performance of Different Column Types
As mentioned in the introduction, the recent decade has witnessed the introduction of a very wide range of stationary phases from different vendors. The differences in selectivity between these stationary phases make it difficult to make a general comparison of their performance, especially in gradient elution. However it is still possible to illustrate general trends in performance between different particle types. Figure 5, for example, illustrates the kinetic performance of four different columns, two of which contained fully porous particles and two with superficially porous particles for a maximum operating pressure of a classical HPLC system (400 bar). In order to compare the different stationary phases, the ratio of tG/t0 was once again kept constant, but the start and end composition of the mobile phase were slightly adjusted (for actual values, see Experimental section), such that the first and last component of the sample eluted at the same retention coefficient (i.e., k = 2 and 12). As can be clearly seen, the superficially porous particles yield a significantly better kinetic performance for all analyses taking less than 2 h, as is evident from their larger peak capacities. This, once again, illustrates that superficially porous particles achieve superior separation powers, even at classical operating pressures. On the other hand, the differences in performance between the two types of superficially porous or between the fully porous particles is relatively small. A chromatogram of a kinetically optimized separation using a superficially porous particle column is shown in Figure 4(d) (conditions given by the added arrow on Figure 5).
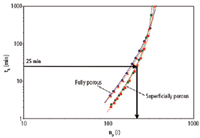
Figure 5
Conclusions
Analysts or laboratory managers wanting to choose the best instrument and column configurations for their typical range of applications can do so by separating a representative test mixture on different particle size columns over a broad range of different flow-rates, running each measurement with the same value of tG/t0. From these data, so-called kinetic performance limit curves can be established for each of the different tested particle sizes that are available for a given type of stationary phase. From these curves, the optimum particle size and column length corresponding to any desired peak capacity (or any typically allowable analysis time) can be directly read-out. This procedure can be repeated for as many different stationary phase types as one wants to include in the method development strategies of the laboratory (29). It can also be used to compare columns from different vendors or with different morphologies.
Acknowledgements
Ken Broeckhoven and Deirdrie Cabooter gratefully acknowledge a post-doc research grant from the Research Foundation – Flanders (FWO Vlaanderen). Waters is kindly thanked for providing the 3.5 µm high pressure columns.
Gert Desmet is a full professor in biochemical and chemical engineering at the Vrije Universiteit Brussel, Brussels, Belgium. His research focuses on the miniaturization of separation methods and investigating flow and mass transfer effects in chromatographic systems.
Deirdre Cabooter is a post-doctoral fellow in Professor Desmet's group. Her current research focuses on the evaluation of new separation systems and the automation of method development.
Ken Broeckhoven is a post-doctoral fellow in Professor Desmet's group. His current research focuses on the effects and (dis)advantages of ultra-high pressure LC and the comparison of the kinetic performance of chromatographic systems.
References
1. D. Cabooter et al., J. Chromatogr. A, 1204, 1–10 (2008).
2. N. Wu, Y. Liu and M.L. Lee, J. Chromatogr. A, 1131, 142–150 (2006).
3. I.S. Lurie, J. Chromatogr. A, 1100, 168–175 (2005).
4. S.A.C. Wren and P. Tchelitcheff, J. Chromatogr. A, 1119, 140–146 (2006).
5. D.T.T. Nguyen et al., J. Chormatogra. A, 1128, 105–113 (2006).
6. X. Wang, W.E. Barber and P.W. Carr, J. Chromatogr. A, 1107, 139–151 (2006).
7. D.V. McCalley, J. Chromatogr. A, 1193, 85–91 (2008).
8. Y. Zhang et al., J. Chromatogr. A, 1216, 4597–4605 (2009).
9. T.J. Causon, R.A. Shellie and E.F. Hilder, J. Chromatogr. A, 1217, 3765–3769 (2010).
10. J.M. Davis and J.C. Giddings, Anal. Chem., 55, 418–424 (1983).
11. G. Desmet, D. Clicq and P. Gzil, Anal. Chem., 77, 4058–4070 (2005).
12. H. Poppe, J. Chromatogr. A, 778, 3–21 (1997).
13. G. Desmet et al., Anal. Chem., 78, 2150–2162 (2006).
14. U.D. Neue, LCGC Europe, 22, 70–77 (2009).
15. S. Eeltink et al., J. Chromatogr. A, 1104, 256–262 (2006).
16. F. Lestremau et al., J. Chromatogr. A, 1138, 120–131, (2007).
17. S. Fekete, K. Ganzler and J. Fekete, J. Pharmac. Biomed. Anal., 51, 56–64 (2010).
18. E. Oláh et al., J. Chromatogr. A, 1217, 3642–3653 (2010).
19. K. Broeckhoven et al., J. Chromatogr. A, 1217, 2787–2795 (2010).
20. D. Guillarme et al., J. Chromatogr. A, 1216, 3232–3243 (2009).
21. T.J. Causon et al., J. Chromatogr. A, 1217, 5063–5068 (2010).
22. P. Sandra, R. Szucs and M. Hanna-Brown, "Present State-of-the-Art and Future Challenges of Fluid-based Separations for the Pharmaceutical and Chemical Industries" presented at the 33rd International Symposium on High Performance Liquid Phase Separations and Related Techniques (HPLC 2009), Dresden, Germany, 28 June–2 July 2007.
23. D. Cabooter et al., J. Chromatogr. A, 1216, 3895–3903 (2009).
24. A. de Villiers, F. Lynen and P. Sandra, J. Chromatogr. A, 1216, 3431–3442 (2009).
25. U.D. Neue, J. Chromatogr. A, 1184, 107–130 (2008).
26. G. Desmet and D. Cabooter, LCGC Europe, 22, 70–77 (2009).
27. http://www.vub.ac.be/CHIS/CONTENT/research/tmas2/kp/kp_template/KP_gradient_template.xls
28. J.H. Knox and M. Saleem, J. Chromatogr. Sci., 7, 614–622 (1969).
29. L.R. Snyder, J.W. Dolan and P.W. Carr, J. Chromatogr. A, 1060, 77–116. (2004)

Understanding FDA Recommendations for N-Nitrosamine Impurity Levels
April 17th 2025We spoke with Josh Hoerner, general manager of Purisys, which specializes in a small volume custom synthesis and specialized controlled substance manufacturing, to gain his perspective on FDA’s recommendations for acceptable intake limits for N-nitrosamine impurities.
University of Rouen-Normandy Scientists Explore Eco-Friendly Sampling Approach for GC-HRMS
April 17th 2025Root exudates—substances secreted by living plant roots—are challenging to sample, as they are typically extracted using artificial devices and can vary widely in both quantity and composition across plant species.
Determining the Serum Proteomic Profile in Migraine Patients with LC–MS
April 17th 2025Researchers used liquid chromatography–mass spectrometry (LC–MS) in their proteomic analysis to compare the serum proteome of migraine patients with healthy controls and to identify differentially expressed proteins as potential migraine biomarkers.


