Matrix Effects on Quantitation in Liquid Chromatography: Sources and Solutions
The “matrix effect” is one of the sticky details that can make the use of liquid chromatography (LC) for quantitative purposes challenging, even though it is conceptually quite straightforward. In this installment, I review what we are referring to when we talk about “matrix effects,” and discuss some of the potential origins of the phenomenon in practice. I then go on to describe some of the commonly-used approaches to mitigate these effects, providing a path to accurate and precise results, even when working with highly complex sample matrices. As with many troubleshooting topics, developing a solid understanding of matrix effects on quantitation and potential strategies for mitigation can be helpful, both during the development of new methods to prevent future problems, and troubleshooting problems with quantitation observed with existing methods.
As part of my preparation for these installments, I generally like to review what has been written about a topic in the past. It is often interesting to see how our approaches to specific aspects of liquid chromatography (LC) troubleshooting evolve over time. In some cases, our approaches change dramatically, frequently in response to new understanding of phenomena or new technology being introduced into the marketplace. In other cases, our approaches don’t change much, usually because there are long-standing causes of problems in the practice of LC for which there simply are not good, foolproof solutions yet. Part of my reading in preparation for this installment included one of John Dolan’s early articles from 1984, which was simply titled “Autosamplers.” I found it strangely comforting to read John’s description of problems related to the “electronics” and “sensors” found in autosamplers, realizing that I too spent a lot of time early in my career troubleshooting problems of this type. Fortunately, I would say that this category of problem has largely been addressed—at least with modern samplers manufactured in the last decade. I simply do not experience many problems with the electronics or sensors in these modules like we used to. That doesn’t mean they never fail—they are sophisticated instruments, after all— we simply spend less time troubleshooting this type of problem than we did in the past.
On the other hand, there are some other sample-related topics Dolan addressed in 1984 that are still generally important, but also relevant to the focus of this installment on matrix e ects. Thus, before diving into the central topic, I think it is worth taking some time to review these long-standing ideas:
- Labeling: In 1984, Dolan wrote that one of the biggest sampler-related problems was mislabeled vials. This is not the sampler’s fault, of course, but it is certainly true that properly labeling vials and telling the chromatography data system which vials are in which locations is a very important (and sometimes overlooked) part of the analytical process. It is striking that, 40 years later, we are still writing on vials by hand, but perhaps this is one area where artificial intelligence (AI) can help us soon.
- Freeze-thaw: Subjecting samples to a freeze-thaw cycle process prior to analysis has the potential to cause a number of problems. For example, proteins may aggregate, leading to results that are very di erent from those that would be obtained if the sample were never frozen. Also, organic or aqueous mixtures may phase-separate, leading to very heterogeneous results depending on which part of the solution is sampled, if the sample is not mixed thoroughly after thawing.
- Evaporation: Analytes or sample solvent components may evaporate if vials are not capped tightly, or following an initial puncture of the septum if the septum is not replaced. Obviously, direct evaporation of the analyte will a ect quantitative results, but evaporation of the solvent can also cause problems, either directly through a reduction in the volume of sample that contains the analyte, or indirectly by affecting the solubility of the analyte in the sample solvent.
This list of reminders is good for preventing problems before they occur, but it also offers a good short list of possible explanations to consider when sample-related problems do occur.
Matrix Effects: A Definition for Our Purposes Here
The conventional definition of the sample matrix is that it is the portion of the sample that is not the analyte—that is, most of the sample. We talk about the matrix potentially affecting different parts of an LC method, including e ects on extraction efficiency and recovery in cases where a sample preparation step precedes the LC separation, apparent retention time, peak shape, and apparent quantity of the analyte (typically measured by peak area). In this installment, I am focusing on potential effects of the matrix on quantitation, so it is helpful here to be precise about what “matrix” is relevant to the part of the LC method where the analyte is actually detected. This certainly includes components of the sample matrix that have retention properties similar to the analyte, and are thus coeluted from the LC column and enter the detector along with the analyte of interest. However, from the point of view of the detection step, the matrix that the analyte is detected in very importantly contains the mobile phase components, including any impurities that might be present in addition to the intended ones (for example, ammonium and acetate ions, water, and acetonitrile). So, for the purposes of discussion here, the “matrix” includes both components of the sample other than the analyte, and the mobile phase components.
The Fundamental Problem with the Matrix Effect on Quantitation
The fundamental problem we have to face is that the matrix the analyte is detected in can either enhance or suppress the detector response to the presence of the analyte. An ideal detection principle would be one in which the matrix components have no effect whatsoever on the detector response to the analyte. This ideal situation rarely occurs in practice; however, some detection principles are less prone to matrix effects than others, to the point where the effect may be too small to measure in the presence of typical measurement noise. In these cases, we could say that there is no measurable matrix effect. Some examples of phenomena that lead to detector response enhancement or suppression are:
- Fluorescence Quenching (Fluorescence Detection): Matrix components can affect the quantum yield of the fluorescence process for the analyte, leading to suppression of the signal observed with fluorescence detection. Readers interested in learning about fluorescence as a detection principle for LC in general, and the quenching phenomenon specifically, are referred to reference (1).
- Solvatochromism (Ultraviolet/Visible [UV/Vis] Absorbance Detection): The absorptivity of analytes can be affected by mobile phase solvents, leading to increases or decreases in the observed absorption of UV/vis light for a given analyte concentration. Readers interested in learning more about the phenomenon of solvatochromism are referred to a recent review article on the topic (2).
- Ionization Suppression/Enhancement (Mass Spectrometric [MS] Detection): Most well-known in the case of electrospray ionization, analytes compete with matrix components for available charge during the desolvation process, leading to enhanced or suppressed ionization of the analyte, depending on other constituents of the matrix present in electrospray droplets (3,4).
- Effects on Aerosol Formation (Evaporative Light Scattering [ELSD] and Charged Aerosol Detection [CAD]): Both ELSD and CAD involve evaporating volatile components of the mobile phase and the formation of aerosol particles that are detected either by the degree of light scattering or particle charging from a corona discharge. Mobile phase additives (for example, buffering agents) can influence the aerosol formation process, resulting in significant enhancement or suppression of the detector response to specific analytes (5).
These are only very brief descriptions of the most common phenomena. Readers interested in learning more about the details associated with these phenomena should refer to the references cited for more information.
The First Step Toward a Solution: Knowing You Have a Problem
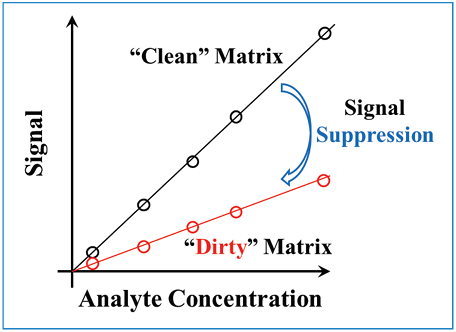
Generally speaking, a simple comparison of detector responses under different conditions is an effective way to determine whether or not we have a matrix effect to deal with. For example, we might compare the detector response to our analyte when using different mobile phase additives, or when the sample is prepared using water as a diluent compared to when phosphate-buffered saline is used as the diluent. In this type of comparison, we are interested in knowing if the slope of the calibration curve we observe depends on these changes in conditions, as shown in Figure 1. If the slopes are different, this tells us the matrix is affecting the detector response, and we should be careful to either systematically study the matrix effect so that we can properly control it over time, or implement one of the solutions described below that are designed to mitigate matrix effects on quantitation.
Figure 1: Comparison of calibration curves obtained using different sample matrices.
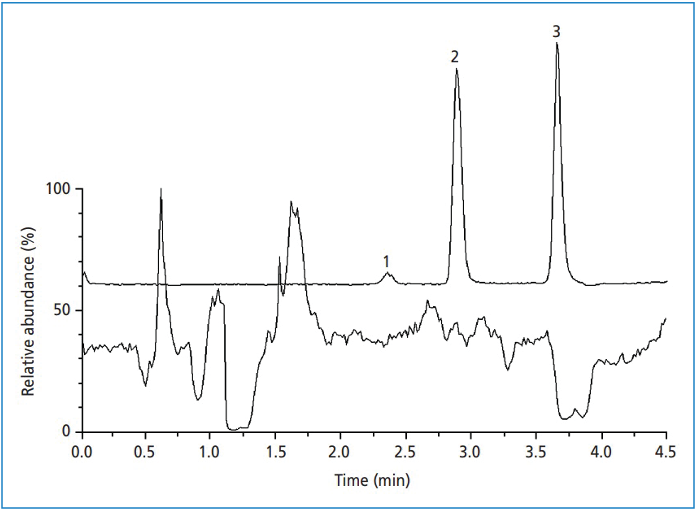
A second approach, which is most commonly used to assess sample-dependent matrix effects when using mass spectrometry (MS) detection, is to add a dilute solution of the analyte of interest to the effluent stream by infusion between the column outlet and the MS inlet. A simple schematic of the setup for this is shown in Figure 2. Figure 3 shows an example of the type of information this approach yields, where we see regions of the chromatogram in which the signal for the analyte of interest is clearly suppressed. These regions correspond to zones of elution of sample matrix compounds. An ideal outcome from this experiment would be one where the analyte signal is constant across the entire chromatogram, indicating no significant suppression or enhancement due to matrix components. Here, we see examples where this is not the case, and we should be mindful of strategies that can be used to mitigate the matrix effect going forward with method development.
Figure 2: Post-column infusion setup. A dilute solution of the analyte of interest is continuously infused into the effl uent stream between the column outlet and the detector inlet.

Figure 3: Results from infusion of target compound while sample matrix components are separated using the LC method conditions. Peaks 1–3 show the locations of peaks of interest injected from a clean sample. Peak #3 in particular elutes in a region where there is suppression of the signal for the target compound by sample matrix components. Reprinted with permission from reference (3).
Commonly Used Approaches Designed to Mitigate Matrix Effects
There are several approaches that can be used to mitigate matrix effects on quantitation, each with their own advantages and disadvantages. In the following sections, I briefly describe the concepts behind the most commonly used approaches, and provide references for those interested in learning about any of them in more detail.
Internal Standard Method of Quantitation
The internal standard method of quantitation is a very potent way to mitigate matrix effects on quantitation. Unfortunately, it is not always practical, but when it can be used, it is one of the most effective tools we have for maintaining good accuracy of quantitation when working with complex sample matrices. The basic concept is as follows: a known amount of an internal standard compound is added to every sample. For example, if our target analyte is toluene, we might choose 13C-labelled toluene as our internal standard, because it will behave very similarly to toluene, yet it can be detected separately from toluene via MS (with a 6-Dalton mass shift if every carbon in the ring is labelled). Then, rather than making a calibration curve for quantitation by plotting the detector signal (for example, peak area) versus analyte concentration, two ratios are plotted. On the y-axis, we use the ratio of the signal for the target analyte to the signal for the internal standard, and on the x-axis, we use the ratio of the target analyte concentration to the internal standard concentration. An example that is often used to illustrate the utility of this approach is a situation where we encounter highly variable sample injection volume, such as with manual injections of small volumes by inexperienced users into a gas chromatograph. When we use a traditional calibration approach using external standards (that is, standards containing only the analyte of interest) an error of 10% in the volume of sample injected (for example, injecting 0.9 µL instead of 1.0 µL) leads to terrible precision and accuracy. In this case, we have no way of knowing that the injection volume was not correct, and thus, we have no way of recovering from the error. However, if we use an internal standard and spike every sample with the same amount of internal standard, this gives us an easy way to observe when something is not right—in this case, measured by highly variable, or outlying, values for the signal due to the internal standard. Moreover, because we ultimately base the quantitation of our target analyte on the ratios of signals and concentrations for the target analyte and internal standard, the approach is self-correcting. If we only inject 0.9 µL instead of 1.0 µL, the signals for both the target analyte and internal standard will be lower than expected, but the ratio will be unaffected. In other words, this type of error is completely cancelled out.
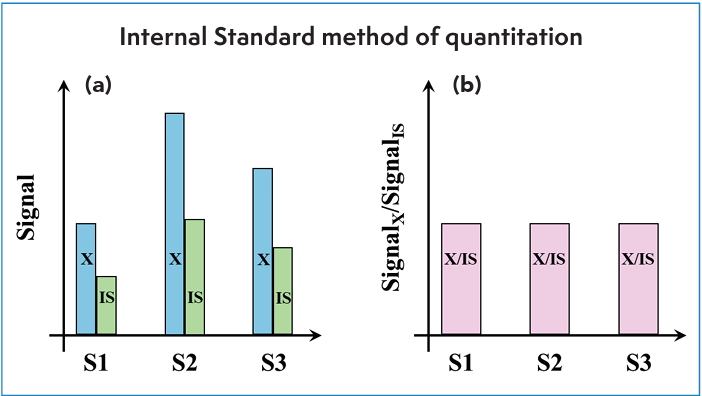
In the case of the incorrect injection volume, it is intuitively obvious that this error should affect both the target analyte and the internal standard in the same way. In the case of sample matrix e ects on quantitation, the extent to which the internal standard approach will help depends largely on the extent to which the sample matrix affects the detector response to the target analyte and internal standard to the same degree. Consider Figure 4, which illustrates the hypothetical effects of the matrices of different samples (S1–S3) on the detector response for the analyte (X) and internal standard (IS). Here we assume that X and IS are spiked into the samples at the same levels in each case, and that the samples did not contain either compound before spiking. Here, we would expect the detector response to be the same for the analyte in each sample, but clearly it is not, because due to the analyte, the signal has been suppressed in Samples 1 and 3 relative to Sample 2. However, we see that the signal due to the internal standard has been a ected in the same way, and thus, when we instead plot the ratio of signals for all three samples, they are the same, as expected.
Figure 4: Illustration of the benefit of the internal standard method for mitigating matrix effects. Hypothetical results for three samples (S1–S3) all spiked with the same levels of analyte (X) and internal standard (IS). (a) In this example, sample S1 exhibits the strongest matrix effect, suppressing the signal relative to that observed for samples S2 and S3. (b) However, using the ratio of the signal for the analyte relative to the signal for the internal standard mitigates the variation in signal due to the matrix effect, improving both the precision and accuracy of quantitation.
The major potential advantage of the internal standard approach is that it can be highly effective, particularly when using stable isotope-labelled internal standards and MS detection, even when working at trace levels, and with complex sample matrices. Among the most significant potential disadvantages are the fact that isotope-labelled standards are not commercially available for many compounds, and when they are, they are often quite expensive.
Once one considers implementing the internal standard approach, we are immediately confronted with a number of practical questions. Exactly what compound should I use for the internal standard? Is the best candidate molecule commercially available at a reasonable cost? Should the internal standard be separated chromatographically from the target analyte, or not? Are there other compounds in the sample matrix that might interfere with my ability to accurately determine the detector response to the internal standard? These questions, while very important, are too numerous to answer here in any detail. Readers interested in learning more about the internal standard approach are referred to a previous installment of “LC Troubleshooting” by Dolan focused on this topic (6).
Standard Addition Method of Quantitation
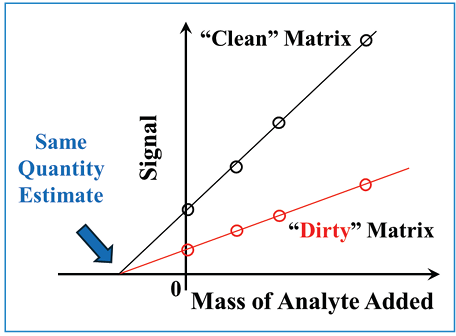
The standard addition method of quantitation can also be very effective for overcoming sample matrix effects on quantitation, but its advantages and disadvantages are quite different from those of the “internal standard” approach. The concept is a bit simpler in this case. Briefly, a sample of interest is divided into multiple portions, and varying but known amounts of the target analyte are deliberately added to each portion prior to analysis (one portion remains unspiked). Then, the detector signal due to the analyte (again, typically peak area) is plotted versus the mass of analyte added to the sample portions. The amount of analyte originally present in the unspiked sample is then estimated by simply dividing the y-intercept of this plot by the slope; the resulting value is the x-intercept of the calibration line. One way of thinking about the meaning of the x-intercept here is that it is the amount of analyte that would have to be removed from the unspiked sample to bring the detector response to zero. Figure 5 illustrates the powerful simplicity of this approach. If the sample matrix a ects the detector response to the target analyte, the slopes of the calibration lines for samples with different degrees of matrix effects will be different, even if the unspiked samples contain exactly the same amount of target analyte. However, these lines will all intersect at the same x-intercept. In other words, we will always get the same analyte concentration estimate if the actual concentration is the same, no matter how large or small the sample matrix effect is. This is the good news about this approach. The major downside is that splitting a single sample into multiple portions and analyzing each of them increases the amount of instrument time dedicated to each sample by approximately a factor of five. Readers interested in learning more about the practical details associated with this approach are referred to reference (7).
Figure 5: Illustration of the benefit of the standard addition method for mitigating matrix effects.
Separating the Analyte of Interest from Interfering Matrix Components
As discussed above, many sample-related matrix effects on quantitation are fundamentally related to the influence of matrix molecules on the detector response of our target analytes. Therefore, anything we can do to reduce the occurrence of interfering molecules entering the detector at the same time as our analytes should reduce the matrix effect. There are a number of strategies to consider here as well. First, selective sample pretreatment prior to the actual LC analysis can be very e ective in this regard. Methods such as solid-phase extraction (SPE) and liquid-liquid extraction (LLE) are commonly used prior to LC analysis for this reason. Readers interested in the benefits and practical application of these and other related approaches are referred to Doug Raynie’s excellent “Sample Prep Perspectives” articles in this magazine (for example, see the overview of different techniques in reference [8]).
Second, the selectivity and elution conditions of the LC separation can be adjusted to move peaks containing analytes of interest away from regions of the chromatogram that are known to contain interfering compounds. Figure 3 shows a good example of this; peak #3 is partially eluted in a region where sample matrix components severely suppress the detector response for the analytes of interest. In his article discussing this and related results, Dolan described the influence of several parameter changes (for example, changing gradient slope or column chemistry) on the location of peak #3 relative to the suppressing region. Ultimately, he concluded that simply changing the gradient delay volume provided the selectivity change needed for this particular application (3).
Second, the selectivity and elution conditions of the LC separation can be adjusted to move peaks containing analytes of interest away from regions of the chromatogram that are known to contain interfering compounds. Figure 3 shows a good example of this; peak #3 is partially eluted in a region where sample matrix components severely suppress the detector response for the analytes of interest. In his article discussing this and related results, Dolan described the influence of several parameter changes (for example, changing gradient slope or column chemistry) on the location of peak #3 relative to the suppressing region. Ultimately, he concluded that simply changing the gradient delay volume provided the selectivity change needed for this particular application (3).
Matrix Compensation (ELSD and CAD)
As discussed above, the composition of the mobile phase used with ELSD and CAD detection can affect the detector response. This can be challenging in the context of gradient elution separations, where the mobile phase composition is changing throughout the analysis, and thus, the detector response may change, even for the same analyte, depending upon where the compound is eluted during the gradient elution program. One approach to mitigate this problem is to use a setup like that shown in Figure 2, but infuse a “counter-gradient” between the column and detector, such that the composition of the e luent arriving at the detector is nominally constant throughout the analysis. For example, if, in a reversed-phase separation, the concentration of organic solvent in the mobile phase is increased as the analysis proceeds, we would program an infusion pump to deliver a solvent gradient that increases in the concentration of water as the analysis proceeds. Readers interested in learning more about this approach are referred to reference (5), which discusses the topic in more detail.
Summary
In the concentration of organic solvent in the mobile phase is increased as the analysis proceeds, we would program an infusion pump to deliver a solvent gradient that increases in the concentration of water as the analysis proceeds. Readers interested in learning more about this approach are referred to reference (5), which discusses the topic in more detail.
References
(1) Dolan, J. W. How Does It Work? Part V: Fluorescence Detectors. LCGC North Am. 2016, 34 (9), 710–719.
(2) Pandian, R.; Burda, H.; Alfurayj, I.; Reichardt, C.; Burda, C. 60 Years of Betaine 30 From Solvatochromic Discovery to Future Frontiers. J. Phys. Chem. B 2024, 128 (29), 6990–7001. DOI: 10.1021/acs.jpcb.4c02813
(3) Nelson, M.; Dolan, J. W. Ion Suppression in LC-MS/MS - A Case Study. LCGC 2002, 20 (1), 24–32.
(4) Volmer, D.; Jessome, L. L. Ion Suppression: A Major Concern in Mass Spectrometry. LCGC North Am. 2006, 24 (5), 498–510.
(5) Chapter 3 - Practical Use of CAD. In Charged Aerosol Detection for Liquid Chromatography and Related Separation Techniques; Gamache, P. H., Ed.; John Wiley & Sons, Inc, 2017; pp 163–190. DOI: 10.1002/9781119390725
(6) Dolan, J. W. When Should Internal Standards Be Used? LCGC North Am. 2012, 30 (6), 474–480.
(7) Harvey, D. Chapter 5 - Standardizing Analytical Methods. In Analytical Chemistry 2.1.
(8) Raynie, D. Origins of Sample Preparation Technologies. LCGC North Am. 2021, 39 (9), 420–423.
(9) Caño‐Carrillo, I.; Gilbert‐López, B.; Montero, L.; Martínez‐Piernas, A. B.; García‐Reyes, J. F.; Molina‐Díaz, A. Comprehensive and Heart‐Cutting Multidimensional Liquid Chromatography–Mass Spectrometry and Its Applications in Food Analysis. Mass Spectrom. Rev. 2024, 43 (5), 936–976. DOI: 10.1002/mas.21845
(10) Stoll, D. R.; Carr, P. W. Two-Dimensional Liquid Chromatography: A State of the Art Tutorial. Anal. Chem. 2017, 89 (1), 519–531. DOI: 10.1021/acs.analchem.6b03506
(11) Simpkins, S. W.; Bedard, J. W.; Groskreutz, S. R.; Swenson, M. M.; Liskutin, T. E.; Stoll, D. R. Targeted Three-Dimensional Liquid Chromatography: A Versatile Tool for Quantitative Trace Analysis in Complex Matrices. J. Chromatogr. A 2010, 1217 (49), 7648–7660. DOI: 10.1016/j.chroma.2010.09.023
About the Author
Dwight R. Stoll is the editor of “LC Troubleshooting.” Stoll is a professor and the co-chair of chemistry at Gustavus Adolphus College in St. Peter, Minnesota. His primary research focus is on the development of 2D-LC for both targeted and untargeted analyses. He has authored or coauthored more than 75 peer-reviewed publications and four book chapters in separation science and more than 100 conference presentations. He is also a member of LCGC’s editorial advisory board.


New Method Explored for the Detection of CECs in Crops Irrigated with Contaminated Water
April 30th 2025This new study presents a validated QuEChERS–LC-MS/MS method for detecting eight persistent, mobile, and toxic substances in escarole, tomatoes, and tomato leaves irrigated with contaminated water.
University of Tasmania Researchers Explore Haloacetic Acid Determiniation in Water with capLC–MS
April 29th 2025Haloacetic acid detection has become important when analyzing drinking and swimming pool water. University of Tasmania researchers have begun applying capillary liquid chromatography as a means of detecting these substances.
Prioritizing Non-Target Screening in LC–HRMS Environmental Sample Analysis
April 28th 2025When analyzing samples using liquid chromatography–high-resolution mass spectrometry, there are various ways the processes can be improved. Researchers created new methods for prioritizing these strategies.

.png&w=3840&q=75)

.png&w=3840&q=75)


.png&w=3840&q=75)


.png&w=3840&q=75)


