A Mass Spectrometry Primer, Part III
LCGC North America
Part III concludes the print version of our three-part series, "A Mass Spectrometry Primer," with the glossary to follow in a fourth and final installment.
Part III concludes the print version of our three-part series, "A Mass Spectrometry Primer," with the glossary to follow in a fourth and final installment. To recap the basis for undertaking this work, technological changes that affect our knowledge, in terms of its depth and our speed of accessing it, spur a couple of observations about print media versus electronic. Anything published must be scholarly because it often serves as a primary resource for certain facts, equations, and other things we cannot, or would not, remember. Paradoxically, however, almost as soon as we commit words to describing or explaining a fast-developing area of technology, their value diminishes as new insights form. And though the marvels of electronic communication are considerable, they nevertheless fail to resolve all of the print's shortcomings as a static medium. For example, increasingly ubiquitous web logs usually are focused narrowly and posted by a single individual. We have yet to benefit from the deeper understanding of our science that interactive conversations could bring.

Michael P. Balogh
As for primers, they abound in various forms and by various authors (I reference some of them here). But this primer, which lives on the internet, differs from all others. It is a self-validating document, continually updated with the comments and suggestions of American and European scientists. I invite your observations on this electronic primer, which you can access by visiting the Waters website at www.waters.com and then clicking Resource Library > Primers.
Mass Accuracy and Resolution
Increased, measured mass accuracy and resolution is now a dominant tool for structural characterization in various applications beyond early drug discovery. With their broad reach of specificity and utility, quadrupole time-of-flight (QTOF) instruments, offered by a number of manufacturers today, are replacing other LC–MS technologies.
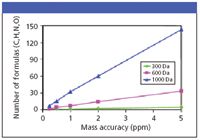
Figure 1: The effect of increasing mass accuracy for unambiguous identification of compounds (T.L. Quenzer, J.M. Robinson, B. Bolanios, E. Milgram, and M.J. Greig, Automated accurate mass analysis using FTICR mass spectrometry, Proceedings of the 50th Annual Conference on Mass Spectrometry and Allied Topics, Orlando, Florida, 2002).
Although there are even higher order instruments a QTOF's high mass accuracy, which falls within a few parts per million of the true, calculated, monoisotopic value, and its high resolution — as much as 10 times higher than a quadrupole instrument's — permits us to determine empirical formulas according to mass defect (where the critical mass value of hydrogen and other atoms present serve as a differentiator). Speciation analysis — discerning the difference between an aldehyde and a sulfide, for example — becomes possible with an increase in mass accuracy above the quadrupole limits to 30 ppm, where the two masses differ by 0.035 Da. Differentiation between the metabolic processes involving methylation is more demanding, however. Adding CH2 produces an increase over the precursor (response for the drug alone) in the measured mass of +14.0157 Da, as compared with a two-stage biotransformation involving hydroxylation (addition of oxygen) followed by oxidation at a double bond (loss of H2), which produces an increase of +13.9792 Da. Yet both measurements, when limited by nominal resolution — a typical quadrupole response — will look like +14 Da.

See MS - The Practical Art, LCGC (chromatographyonline.com)
High mass accuracy and low resolution: Low-resolution quadrupole instruments perform well for extremely high mass-accuracy measurements, like those used for analyzing proteins. The masses of proteins generally are defined as "average" values when the isotope peaks are not resolved relative to each other. Average mass is the weighted mean of all the isotopic species in a molecule. The instrumental resolution normally employed on quadrupole instruments broadens the resolved response for a 10-kDa protein by a factor of x1.27. That factor increases significantly as the mass increases (for example, to x2.65 at 100 kDa). However, by reducing the peak width to m/z 0.25 (increasing resolution to 4000 resolution) rather than limiting the instrument resolution to 1000 using the typical peak width (m/z 0.6) improves the situation dramatically.
In practice, electrospray ionization (ESI)–MS analyses of large molecules produce multiply charged ions. Hence, the widths need to be divided by the number of charges on an ion to give the width on the mass-to-charge ratio scale. For example, a 20-kDa protein with 10 or 20 charges on it will produce isotope envelopes that are 0.9 or 0.45 m/z units wide at m/z ~2000 or ~1000, respectively.
When these ions are observed on an instrument set for a significantly lower resolution than that required to resolve the isotopes (say less than 10,000 resolution), a single peak is produced for each charge state. The overall width is determined by combining the instrument peak width with the theoretical width of the isotopic envelope divided by the number of charges on the ion. The instrumental peak width would be determined on the first isotope peak of a low molecular weight compound at the same m/z value as the multiply charged protein peak.
How much accuracy do we need, or can we realistically achieve, and what are the compromises? Consider the requirements for unambiguous characterization from the Journal of the American Society for Mass Spectrometry author's guidelines (March 2004). For C, H, O, N compositions (C0–100, H3–74, O0–4, and N0–4) a nominal m/z response at 118 needs only an error not exceeding 34 ppm to be unambiguous, where a m/z response at 750 requires precision better than 0.018 ppm to eliminate "all extraneous possibilities."
Comparing precision from instrument to instrument: millimass units (mmu), measurement error (ppm), and resolution According to the Accurate Mass Best Practice Guide of the VIMMS Programme, an initiative that forms part of the UK National Measurement System, most instruments used for accurate mass measurements are capable of achieving precision of 10 ppm or better.
A calculated mass of 118 Da measured by a modern mass spectrometer to within 2 mmu accuracy would display 17 ppm error, sufficient by today's standards for unambiguous determination of a chemical formula of that mass:
- Monoisotopic calculated exact mass = 118 Da
- Measured accurate mass = 118.002 Da
- Difference = 0.002 mmu
- Error (Difference/exact mass × 106 ) = 17 ppm
An instrument capable of a response at 750 m/z, also deficient by 2 mmu, would be accurate to 2.7 ppm. In the first case, the measurement is more than sufficient for unambiguous identification of a chemical formula, according to the published standards of the Journal of The American Society for Mass Spectrometry. But in the latter case, the measurement is insufficiently precise. Only the highest order Fourier-transform ion cyclotron resonance (FTICR) MS can achieve such precision at higher masses.
A comprehensive method of evaluating instrument mass accuracy measurement capability, which resembles intended use, is to calcualte the root mean square (RMS) error. To illustrate its use, the following is adapted from the mass measurement accuracy specification of a commercial TOF mass spectrometer.
"The mass measurement accuracy of the instrument, under normal operating conditions, will be better than a given ppm RMS over the given m/z range, based on a number of consecutive repeat measurements of an analyte peak (of given m/z), using a suitable reference peak (of given m/z). Analyte and reference peaks must have sufficient intensity and be free of interference from other masses.""
There are some important points and assumptions to be considered:
1. Assumes an instrument calibration has already been performed with peaks of known mass using a calibration standard. The reference peak is used to account for any variation in the instrument calibration over time and mass measurement accuracy is determined using the analyte peak.
2. Normal operating conditions — also can include details of chromatographic conditions (for LC–MS performance specifications) and any related MS operating conditions (for example, mass resolution, m/z of interest, or spectral acquisition rate).
3. Sufficient intensity — assumes that the ion count is not detrimental to characterization of the (mass measurement) accuracy and precision of the instrument in question. Too few ions leads to poor ion statistics and too many ions can lead to detector saturation, both of which result in a greater variation in the standard deviation of repeat measurements and will influence calculation of the RMS error adversely (also relevant to instrument calibration).
4. Free from interferences — assumes that the mass measurement of the peak of known mass is free from interference by ions of the same or similar mass. Overlapping peaks lead to poor mass measurement accuracy, which is also detrimental to characterizing the accuracy or precision of the instrument properly (also relevant to instrument calibration).
5. The reference or analyte peak selected should be a good representation of the m/z range, which is relevant to the analysis of a particular sample type.
The RMS error is calculated using the following relation, where Eppm is the parts-per-million error and n is the number of masses considered:

It is worth noting the RMS error allows some measurements to fall outside the ppm error "window of interest" (for example, 5 ppm RMS). To ensure quality measurements, the conditions described previously must be satisfied (particularly regarding intensity and influence of interferences - balanced ion statistics with clear peak definition in the spectra) over a number of repeat injections. Many reported resolution and mass accuracy numbers that you see are not RMS error numbers, but instead originate from a single selected (favorable) ion.
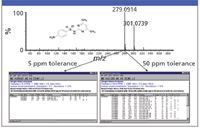
Figure 2: Increased filtering or restriction of error in the measurement reduces the possible candidates for a given result.
It is important to remember in all applications that a weak signal (excessively high resolution) can yield poor ion statistics and can therefore be unusable. Too strong a signal can be equally useless, causing detector saturation. Ideally balanced ion statistics with definition in the spectra is the goal.
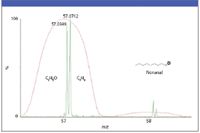
Figure 3: Importance of increased resolution when differentiating closely related masses.
Some comparisons: With respect to Figure 3:
- quadrupole resolution is not sufficient to differentiate the two compounds in the upper figure.
- with a resolving power of ~5000, TOF data clearly show two distinct peaks, which can be mass measured accurately to < 5 ppm.
It is important to appreciate the various interrelated roles played in accurate-mass precision by the shift between definitions of mass and increasing resolution and factors such as peak shape and the need for calibration. If these are not understood clearly and taken into consideration, mass misassignments and other undesirable results can occur.
Figure 3 shows quadrupole and TOF response where both mass values on the TOF data are within 1 mDa of the exact mass. The two fragments of different compositions are from the same analyte and therefore in the source at the same time. Even the best chromatography won't help in this case so this emphasizes one of the reasons higher resolution is useful especially in the analysis of unknowns. This applies equally well to QTOF product ion data versus product ion data from a triple quad. As an added advantage with this higher degree of resolution the extracted ion current plot of each allows differentiation of the oxygen containing and alkyl containing analytes selectively from the chromatograms where the quadruole data would lack this capability.
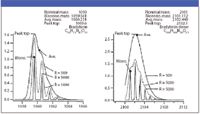
Figure 4: Resolution becomes increasingly important as mass increases to properly determine the monoisotopic and average mass relative to the peak top (S. Carr and R. Annan, Unit 16.1, , in Current Protocols in Protein Science [J. Wiley and Sons, New York, 1996])
Terminology:
Nominal — Unit mass. Sulfamethazine Nominal = 278 [C12H14N4O2S]
Average mass — Calculated using all isotopes of each element and their natural abundance.
Sulfamethazine avg. mass= 278.3313 [C12H14N4O2S]
Calculated exact mass (monoisotopic) — Determined by summing the masses of the individual isotopes for a given ion.
Sulfamethazine exact mass=278.0837 [C12H14N4O2S]
Accurate mass (Actually "measured exact mass") —What we do with our instruments. It is the measure of an m/z reported to (typically) three or four decimal places.
As mass increases, differences between the definitions increase, and peak shape plays a bigger role: Ubiquitin Nominal Exact Avg. [C378H630 8556 8560.6254 8565.8730 N105O118S]
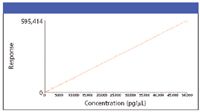
Figure 5: Quantitation example using GCâMS with CI - linear dynamic range: 5 orders.
Interpreting Mass-Spectrometer Output
The mass spectrum is a display of unique ions present at a specific time in the experiment, whether that duration represents a long-term ablation of a solid sample in the source or the passage of a transient gas chromatography (GC) or LC peak. Software is available from several sources. It is often tailored to specific practices, such as metabolite identification. It can be expeditious, reducing huge volumes of data while highlighting issues the unaided eye might overlook. Software can help us reduce uncertainty if, with properly applied skills, we make use of fundamental chemistry: the electron valence rules for nitrogen-containing compounds, characteristic spectra of halides, rings-and-double bond calculations, and so forth to arrive at what we believe is an unambiguous conclusion. No single software application can answer all inquiries satisfactorily. And so, what really counts is a practitioner's ability to apply well-honed skills and educated judgment.
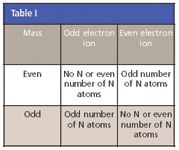
Table I
A small, simple molecule such as carbon dioxide (44 Da), composed of only three atoms, produces a very simple mass spectrum. In case of carbon monoxide (CO), the molecular ion is also the most intense or abundant ion displayed (referred to as the base peak). Fragment ions found in this spectrum created from the excess internal energy of ionization are CO (m/z = 28) and O (m/z = 16). In some cases, the molecular ion might not be the most abundant in the spectrum. For example, because cleavage of a carbon–carbon bond in propane (44 Da) gives methyl and ethyl fragments, the larger ethyl cation (m/z = 29) is the most abundant. Ions derived from these well-characterized interactions are particularly significant identifying features for spectra of these hydrocarbons.

See MS - The Practical Art, LCGC (chromatographyonline.com)
Isotope characteristics: Because mass spectrometers separate ions by mass, distinguishing isotopes for a given element when the instrument is capable of sufficient resolution is accomplished easily. Halogenated compounds often are cited as examples, because naturally occurring bromine, for instance, consists of a nearly 50:50 mixture of isotopes having atomic masses of 79 and 81 Da. Fragmentation of Br2 to a bromine cation then produces two equal-sized ion peaks at 79 and 81 m/z.
Even and odd electron ions: Most stable organic compounds have an even number of total electrons because electrons occupy atomic orbits in pairs. When a single electron is removed from a molecule, the total electron count becomes an odd number, a radical cation. The molecular ion in a mass spectrum is always a radical cation ( as seen in electron ionization [EI]), but the fragment ions can be even-electron cations or odd-electron radical cations, depending upon the neutral (uncharged) fragment lost. The simplest and most common fragmentations are bond cleavages that produce a neutral radical (odd number of electrons), and a cation having an even number of electrons. A less common fragmentation where an even-electron neutral fragment is lost produces an odd-electron radical cation fragment.

As a rule, odd-electron ions might fragment either to odd- or even-electron ions, but even-electron ions fragment only to other even-electron ions.
The masses of molecular and fragment ions also reflect the electron count, depending upon the number of nitrogen atoms in the species.
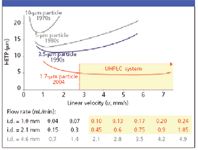
Figure 6: The UHPLC concept alters familiar parameters established in traditional separations practice like flow rates, particle sizes-even our appreciation of van Deemter curves.
The two levels of access to interpreting mass spectra are nominal mass data and exact mass data. In each case, retention times serve as an additional determinant. Achieving accurate mass measurement is based upon the calculated elemental composition. Not surprisingly, accurate isotope patterns fed into an algorithm to reduce the number of possible formula candidates is a recently exploited aspect of accurate mass measurement.
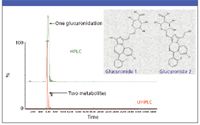
Figure 7: Technological advances often uncover more detail such as seen with UHPLC increased peak capacity over a traditional HPLC separation of what was thought to be a single glucuronide.
Characterizing spectra produced by desorption and soft ionization: The retro Diels–Alder reactions and hemolytic–heterolytic energies required to disassociate, or cleave, bonds leading to specific well-characterized fragmentation continues to be the basis for our thinking when confronted with mass spectra. The difficult part of MS is often in answering the question posed by Fred W. McLafferty, one of the important contributors to our understanding of interpretation rules: "What is the mass we are dealing with?"
Until the development of desorption techniques like matrix-assisted laser-desorption ionization (MALDI) and electrospray, that question at least at times seemed easier to answer. How easy depended upon whether the sample had to be derivatized to make it volatile and amenable to GC–MS. Here the spectra often would be dominated by the derivatized groups and show little or no molecular ion (hence, the need for chemical ionization [CI]). In that case, the advent of electrospray and atmospheric pressure chemical ionization (APCI) certainly aided in the identification of the molecular weight of small molecule singly charged species. At least in those cases, MS dealt with the m/z value of ions displaying only a single charge. The mass of an analyte usually was reported as the nominal mass (the nominal m/z value) of the molecular ion, the same as the nominal mass of the molecule. The nominal mass of an ion, molecule, or radical is the sum of the nominal masses of the elements in its elemental composition. The nominal mass of an element is the integer mass of the most abundant, naturally occurring, stable isotope.
But the answer became more elusive when soft-ionization desorption techniques such as ESI became commercially widespread beginning in the early 1990s. In the "predesorption" age of MS, the nominal mass of most analytes interrogated by MS was less than 500 Da. Mass defect due to the presence of hydrogen was not an issue for these analytes. The upper m/z limit for most mass spectrometers fell in the 650–800 range. Thus, in those predesorption ionization days, the nominal mass and the integer monoisotopic mass were of the same value. The monoisotopic mass of an ion, molecule, or radical is the sum of the monoisotopic masses of the elements in its elemental composition. The monoisotopic mass of an element is the exact mass of the most abundant, naturally occurring, stable isotope.
At the onset of the desorption ionization era, larger molecules and greater precision became integral to studies because the technology permitted it with little difficulty. Only then did the issue of mass defect become so very important. In a mass spectrometer able to report only to the nearest integer m/z value, the molecular ion of a C50H102 compound might be represented by a peak at m/z 703 instead of at m/z 702 because the molecular ion would have a monoisotopic mass of 702.7825, which rounds to the integer 703.
Above 500 Da, mass defect can be a serious issue in determining the m/z values of MS peaks. It is important to keep in mind that the mass spectrometer is measuring signal intensities that occur at a specific time during the collection of the mass spectrum, regardless of the type of m/z analyzer used. The m/z value reported is a function of the time that ions of a known m/z value produced by a specific compound — relative to the calibration compound — reach the detector.
Because the mass of monoisotopic ions changes as the position on the m/z scale changes, the mass spectrometer that reports integer m/z values actually can take measurements at every 0.05 m/z units. The detected intensity can be that at the apex of the mass spectral peak or the sum of the intensities across the mass spectral peak. The m/z value reported is an integer obtained by rounding the observed m/z value for the mass spectral peak maximum.
EI MS often relies upon perfluorinated compounds like perfluorotributylamine (nominal molecular mass of 671) to calibrate the m/z scale. That is because the integer mass of an ion is almost the same as its monoisotopic mass. If an ion exceeds a nominal mass of 1000 Da, there is no observed nominal m/z value peak in the mass spectrum. The monoisotopic mass peak is offset from where the nominal mass peak should be observed by an amount equal to the mass defect of the ion. For single-charge ions with masses above 500 Da, using techniques like electrospray with transmission quadrupole or quadrupole ion-trap mass spectrometers that have unit resolution throughout the m/z scale, the isotope peaks will be separated clearly.
Of the many discussions on the role isotopes play in determining a compound's identity, one appeared in LCGC Europe that contributes a helpful balance. "Interpretation of Isotope Peaks in Small Molecule LC–MS" (L.M. Hill, LCGC Europe 19[4], 226–238 [2006]) is based upon low-resolution ion trap work. In a relevant part, the author cautions against overconfidence when using ion traps: "[I]on trap users will have to be more careful than those with QTOF or triple quadrupole systems. It is obviously necessary to start with the +1 isotope peak isolated free of contamination . . . ion traps tend to trap with lower resolution than they scan . . . empty[ing] the trap . . . in order of mass." This does not mean ion traps cannot be used but, like all instruments, must be applied with an understanding of their abilities and their limitations.
Similarly, an instrument capable of very high resolution does not automatically confer the correct answer. One data set presented in a paper by Kind and Fiehn (T. Kind and O. Fiehn, BMC Bioinformatics 7, 234 [2006]) is particularly striking and led to their conclusion, which they based upon examining 1.6 million formula search results: "High mass accuracy (1 ppm) and high resolving power alone [are] not sufficient . . . only an isotopic abundance pattern filter [is] able to reduce the number of molecular formula candidates." Mass spectrometers capable of just 3 ppm mass accuracy, but 2% isotope pattern accuracy, usually remove more than 95% of the false candidates. This performance would beat even mass spectrometers capable of 0.1 ppm — if such instruments actually existed — that are not equipped with isotope pattern capability.
Between masses of 150 Da and 900 Da, the number of possible formulas listed as mass accuracy increased from 10 ppm to 0.1 ppm without the aid of isotope abundance information: from a low of 2 candidate formulas at 150 Da to 3447 at 900 Da for 10 ppm. Even at the upper end (900 Da), mass accuracy alone at 1 ppm yields 345 candidates. Invoking 2% isotope abundance accuracy, the number of candidates at 900 Da is reduced to an expedient 18. They also show that allowing a paltry 5% accuracy for isotope acquisition associated with 5 ppm accuracy yields 196 candidates.
Quantitation and Calibration
When a compound is already known, as in the case of clinical trials in which statistical data from many individual samples is gathered and the administered drug and its metabolite of interest are already well characterized, full mass spectra are not required. However, very good sensitivity in a complex physiological mixture is required, so the instrument is set to monitor only specific m/z values. (Refer to the comparison of single-ion recording [SIR] and multiple-reaction monitoring [MRM] response, previously, in this primer.)
Because ions continuously stream through the triple or tandem quadrupole there is no need to limit the ion current into the mass analyzer. The ion trap, on the other hand, has a defined, finite volume and therefore needs a function to prevent too many ions entering the trap. Not controlling ion intensity results in undesirable or unexpected peaks in a spectrum, a particularly troublesome phenomenon when attempting to library search EI spectra in GC–MS. The design of ion traps has changed substantially to allow external (ions created outside the mass filter with subsequent ion injection into the trap) rather than internal ionization (ionization within the mass filter). The design change addressed the problem of ion molecule reactions in the trap, but it also introduced a limitation. Even in MRM mode, this automatic governing of the total ion current can result in irregular sampling intervals across a chromatographic peak. So, ultimately, the ion trap is limited as a tool for trace analysis in complex matrices, particularly when the highest accuracy and precision is required, as is the case for data that must be legally defensible or whose stringent criteria for accuracy and precision of quantitation is dictated by legislation.
An internal standard is typically used when performing MS quantitation. The standard provides controls over variability in extraction processes, LC injection, and ionization. Without an internal standard RSDs among replicates can be tenfold higher than replicates referenced to a standard that typically produces RSDs in low single digits. The best internal standard is an isotopically labeled version of the molecule of interest. Although synthesizing such a molecule prove expensive, it will exhibit similar extraction recovery, chromatographic retention time, and ionization response in the mass spectrometer.
Assessing system suitability, randomizing samples, and determining suitable curves and concentration points are the subject of lengthy debate. Some good references can be seen at the www.ionsource.com tutorial on quantitation.
Calibration: Calibration compounds are used by a mass spectrometrist to adjust the mass calibration scale, as well as the relative intensities of the ions, to match that of known entities. This operation is performed on all mass spectrometers because subtle changes in electronics, cleanliness of surfaces, and a laboratory's ambient conditions can affect the instrument's ability to reproduce a meaningful measurement. For the least demanding analyses on nominal-mass instruments, the need for calibration can be infrequent and a check of its response more frequent. Nevertheless, high mass accuracy requires constant surveillance for minute changes.
For GC–MS, a popular calibration compound is FC-43, also known as perfluorotributylamine. Other calibration compound mixtures are used to adjust a high-resolution mass spectrometer's calibration scale. Sodium cesium iodide (NaCsI) and polyethylene glycol mixtures are popular for LC–MS. In an LC–MS-compatible solvent, NaCsI streamed or infused in a steady state into an instrument provides a series of monoisotopic peaks through 4000 Da.
Kits are available that contain a selection of standard peptides, proteins, matrices, and solvents for calibrating, tuning, and sensitivity testing MALDI mass spectrometers. One, from Sigma Aldrich (St. Louis, Missouri), is a setup aid for analyzing complex mixtures of proteins and peptides (700 to 66,000 Da).
Lock mass: Constant vigilance is required for the most demanding measurement with TOF and similar highly accurate instruments. A small change in temperature alone can shift the reported mass results by many parts per million. Depending upon the type of ionization used, constant calibration correction can be achieved by simply using a known contaminant present in the source. Or you can sample an ion stream periodically to reestablish proper calibration throughout an analysis. Simply adding a lock mass calibrant to flowing LC eluent, by "teeing in" after the column and before the mass spectrometer's inlet, often causes uncontrolled behaviors like ion suppression, mass interference, and solvent effects.
TOF instruments (described earlier in this primer) can reach low parts-per-million accuracy, and FT-ICR instruments are capable of even greater accuracy, provided the number of ions admitted are well controlled. Real-time recalibration on the lock mass by corrections of any mass shift removes mass error relative to that established with calibration of the mass scale. Weak signal is another sometimes-overlooked cause, which is correctable by averaging the mass measurement over the LC peak, weighted by signal intensity.
A dual-electrospray source optimized for acquiring exact mass data is ideal for proteomics studies or low-level metabolite identification. The method using two independent ESI probes samples the correcting spray (or reference) stream, using an oscillating baffle driven by a programmable stepper motor. The reference spray is sampled at predefined intervals, ensuring the acquisition duty cycle favors the liquid stream containing the analyte. The sampling baffle position is monitored in real-time, enabling indexing of the two liquid inlets, and the reference and sample data are stored in separate files. The design eliminates cross-talk between the analyte and reference channels.
Solvents and Caveats for LC–MS
Solvents typically are chosen based upon a compound of interest's solubility and compatibility with various ionization techniques used in LC–MS. Volatility and the solvent's ability to donate a proton are important in ESI and other atmospheric ionization techniques.
Protic primary solvents like methanol and mixtures with water, such as 1:1 methanol–water or 1:1 acetonitrile–water, are used (although the water–methanol mixture increases viscosity well beyond either water or menthol as a neat solvent because of a resulting exothermic reaction). Water's relatively low vapor pressure can be detrimental to sensitivity when employed at 100%. Better sensitivity results when surface tension is decreased through addition of a volatile organic solvent. Surfactants with higher proton affinity, though they increase ion liberation from nebulized droplets, also can reduce sensitivity.
Aprotic co-solvents like 10% dimethyl sulfoxide (DMSO) in water and isopropanol improve solubility for some compounds. Formic acid is often added at low levels (0.1%) to facilitate ionization by ensuring the analyte is more basic than the solvent. Even in small amounts, however, some acids, like trifluoroacetic acid, though necessary for otherwise insoluble compounds, can limit sensitivity.
In the ESI mode, buffers and salts (Na+ , K+ , and phosphate) cause a reduction in the vapor pressure and consequently a reduced signal. The increased surface tension of the droplets, and resultant reduction of volatility, can be remedied by using relatively more volatile buffers like ammonium acetate, formed by a weak acid–base pair.
Solvent considerations:
- Solvent in the gas phase limits ionization by ESI to molecules more basic than the solvent. The exception is photoionization (which is not acid–base ionization) but nonetheless mediated by solvent.
- Removing solvent and water vapor from the ionization region increases types of compounds that can be ionized at atmospheric pressure.
- Reducing liquid volume relative to the sample or analyte of interest contained in the liquid improves ESI performance (that is, lower flow rates).
- Useful Solvents
–Water
–Acetonitrile
–Methanol
–Ethanol
–Propanol
–Isopropanol
- Acceptable additives
–Acetic acid
–Formic acid
–Ammonium hydroxide
–Ammonium formate (salt concentration = 10 mM or less)
–Ammonium acetate (salt concentration = 10 mM or less)
- Nonvolatile salts (phosphate, borate, citrate, and so forth)
–Can deposit in source and plug capillaries, thus, requiring more cleaning and maintenance operations
–Modern source designs can handle nonvolatiles better than older designs
- Surface-active agents (surfactants–detergents) suppress ESI
- Inorganic acids are corrosive
- Trifluoroacetic acid
–To some extent, suppresses positive-ion electrospray at levels exceeding 0.01%.
–Greatly suppressed negative-ion electrospray.
- Triethylamine
–High PA (232 kcal/mol) yields an intense [M+H]
+
ion at
m/z
102
–Suppresses positive ion electrospray of less basic compounds.
- Tetrahydrofuran
–100% tetrahydrofuran is highly flammable, so APCI and most interface techniques use nitrogen as the nebulizer gas. (Using air creates an explosion hazard).
–Reacts with PEEK tubing.
Ion suppression and choice of chemistries: Ion suppression is one of the more visible issues confronting spectrometrists using ESI as the ionization technique. The U.S. Food and Drug Administration's (FDA) publication, Guidance for Industry on Bioanalytical Method Validation (Federal. Register, 66, 100, 28526) in 2001 indicates the need for such consideration to ensure the quality of analysis is not compromised. The article notes several experimental protocols for evaluating the presence of ion suppression. One compares the MRM response (peak areas or peak heights) of an analyte in a spiked, post-extraction sample to that of the analyte injected directly into the neat mobile phase. A low analyte signal in the matrix compared to the pure solvent indicates the presence of interfering entities.
A publication by C. Mallet and colleagues describe where in the chromatogram matrix effects on the analyte (and internal standard) are present. The experimenters use a continuous flow of a standard solution containing the analyte of interest and its internal standard added to the column effluent. After injecting a blank sample extract into the LC system, a drop in the constant baseline indicates suppression in ionization of the analyte due to the presence of interfering material.
Column chemistries: One enabling change in technology is the advent of hybrid column chemistries and highly selective particles of less than 2 μm diameter. The hybrid chemistries rely less on mobile phase modifiers that can cause ion suppression, and more on the increased selectivity of particles.
Ultrahigh pressure LC versus traditional HPLC: The recent commercialization of work by Professor J. Jorgenson (University of North Carolina, Chapel Hill), often referred to as UHPLC (ultrahigh pressure liquid chromatography), brings a potential to increase the information derived from typical LC–MS analyses. Commercialized by Waters Corporation as UPLC, the increased peak capacity relative to high performance liquid chromatography (HPLC) makes possible defining chemical entities that would otherwise have been coeluted under the broader peaks of HPLC. Concentrating peaks into bands of (typically) 2-s widths or less raises the potential for increased sensitivity by favoring the mass spectrometer's response to improvements in signal-to-noise ratio.
The UHPLC concept alters familiar parameters established in traditional separations practice like flow rates, particle sizes — even our appreciation of van Deemter curves. As operating pressure increases from ~2000 psi to as high as 20,000 psi, particle diameters less than 2 μm approach the theoretical limit described in 1969 by John Knox in his "Knox equation." Once the attendant problems of increased mechanical stress and exaggerated thermal effects have been addressed the improvements in MS performance come as a somewhat counterintuitive consequence of theory.
Viewed as changes in efficiency due to linear velocity depicted as a van Deemter plot, columns packed with 1.7-μm diameter particles perform better independent of flow rate. Though all columns evidence diminished performance at extremely low linear velocities, a fact we are accustomed to in HPLC practice, those with smaller diameter particles perform better, and show less performance deterioration at increased linear velocity.
An example of how technology has redefined the approach to experimental design is seen in comparing what is now referred to as "legacy" HPLC separations with UHPLC separations. Not only have the underlying principles redefined separations (up to four times shorter) but the selectivity has increased uncovering hidden details such as the metabolites of midazolam in the figure. The improved separation indicates a second glucuronide metabolite, m/z = 548.125.
Acknowledgment
As large and diverse a task as this could not have been accomplished without the editorial overview of Dave Sarro who has been responsible for consistency in my writing for many years now and Hilary Major, a scientist in her own right who provided insights and helped resolve questions on topics included here.
Michael P. Balogh
"MS — The Practical Art" Editor Michael P. Balogh is principal scientist, MS technology development, at Waters Corp. (Milford, Massachusetts); a former adjunct professorand visitingscientist at Roger Williams University (Bristol, Rhode Island); cofounder and current president of the Society for Small Molecule Science (CoSMoS) and a member of LCGC's editorial advisory board.
New Method Explored for the Detection of CECs in Crops Irrigated with Contaminated Water
April 30th 2025This new study presents a validated QuEChERS–LC-MS/MS method for detecting eight persistent, mobile, and toxic substances in escarole, tomatoes, and tomato leaves irrigated with contaminated water.
University of Tasmania Researchers Explore Haloacetic Acid Determiniation in Water with capLC–MS
April 29th 2025Haloacetic acid detection has become important when analyzing drinking and swimming pool water. University of Tasmania researchers have begun applying capillary liquid chromatography as a means of detecting these substances.

.png&w=3840&q=75)

.png&w=3840&q=75)


.png&w=3840&q=75)


.png&w=3840&q=75)


