Mass Spectrometry for Metabolomics: Addressing the Challenges
Special Issues
Metabolomics is a developing analytical approach that is growing rapidly in importance as a tool to improve diagnosis and treatment of disease, as well as to speed up the drug development process. Unlike genomics or proteomics, which only reveal part of what might be happening in a cell, metabolomic profiling can give an instantaneous snapshot of the entire physiology of that cell. This article describes the challenges associated with metabolomics research and new tools developed to overcome them.
Metabolomics is a developing analytical approach that is growing rapidly in importance as a tool to improve diagnosis and treatment of disease, as well as to speed up the drug development process. Unlike genomics or proteomics, which only reveal part of what might be happening in a cell, metabolomic profiling can give an instantaneous snapshot of the entire physiology of that cell. This article describes the challenges associated with metabolomics research and new tools developed to overcome them.
Metabolomics involves the comparison of metabolomes (the full metabolite complement of an organism) between control and test groups to find differences in their profiles. Metabolomics has been used in clinical discovery, pharmaceutical development, environmental chemical exposure assessment, seed crop development, and herbicide and pesticide development. Mass spectrometry (MS)–based metabolomics is a technique that can be applied to many biological problems in which a "good" and "bad" state can be identified, and a comparison of metabolites of those states can lead to a better understanding of the biochemistry differences. This article describes the challenges associated with MS-based metabolomics research and new tools developed to overcome them.
Separation Challenges for Metabolomics
Separation is an important part of metabolomics because the samples are complex. The chemical information in the retention or migration time of the separation is used to track and identify a metabolite undergoing analysis. This is necessary because MS alone cannot distinguish isobaric metabolites, whereas chromatography can be used to separate and identify isomers. The two most commonly used separation techniques are gas chromatography (GC) and liquid chromatography (LC).
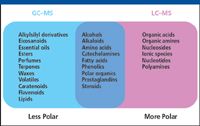
GC–MS is an effective combination for the analysis of volatile chemicals. Analytes, therefore, must be volatile or amenable to chemical derivatization to render them volatile. Certain types of samples are particularly well suited to GC–MS analyses (Figure 1). These include plant terpenes and essential oils, which are volatile and do not ionize well by LC–MS techniques. Other analytes generally compatible with GC–MS include steroids, diglycerides, sugar alcohols, and mono-, di-, and trisaccharides.

Figure 1: Samples that can be analyzed by GCâMS and LCâMS.
LC can separate metabolites that are not volatile and have not been derivatized. As a result, LC–MS can analyze a much wider range of chemical species than GC–MS. Samples commonly analyzed by LC–MS include amino acids (18 out of 20 common amino acids can be analyzed by GC–MS, but the remaining two cannot) and sugars larger than trimers.
Hydrophilic Interaction Chromatography for LC–MS
Many endogenous metabolites are very polar and are unretained on standard reversed-phase high performance liquid chromatography (HPLC) columns. New column chemistries must be developed to analyze these molecules if LC–MS is to be broadly applicable to metabolomics. Hydrophilic interaction chromatography (HILIC) separates compounds by passing a mostly organic mobile phase across a hydrophilic stationary phase, causing solutes to elute in order of increasing hydrophilicity. HILIC is an alternative to capillary electrophoresis (CE) for hydrophilic metabolites, with the advantage that the typical HILIC mobile phase is substantially more compatible with MS than CE buffers. This type of column chemistry enables a general purpose solution for polar analytes that can be used in both positive and negative ion mode MS analysis, thereby maximizing the number of compounds detected by MS for comprehensive metabolomics studies.
Data Processing Challenges
A major challenge of metabolomics involves data processing and analysis; a full range of software programs is needed to turn raw metabolomics data into useful biological results. A typical metabolomics experiment requires large numbers of biological samples to generate results that are statistically rigorous. Aside from the need for highly sensitive and accurate instrumentation, powerful software is essential to address the vast amounts of data generated by these experiments. Analytical capabilities include chromatographic deconvolution programs for processing GC–MS and LC–MS data, a suite of statistical analysis tools to find significant metabolites, a metabolite database to aid in identifying metabolites, and finally bioinformatics software for visualizing molecular interaction networks.
Typical Metabolomics Workflow
Whether using a GC–MS- or an LC–MS-based approach, comprehensive metabolomic analysis consists of multiple steps.
Profiling (also known as differential expression analysis) involves finding the "interesting" metabolites with statistically significant variations in abundance within a set of experimental and control samples.
Identification is the determination of the chemical structure of these "interesting" metabolites after profiling.
Validation uses much larger numbers of samples to account for the effect of natural or biological variations to validate the previously identified metabolites. It is quantitative and requires analytical standards.
Interpretation, the last step in the workflow, makes connections between the metabolites discovered and the biological processes or conditions.
Profiling to Find Statistically Significant Metabolites
Profiling combines the targeted profiling of known metabolites with comprehensive feature extraction to find unexpected metabolites. Analytical reproducibility is of great importance for expression profiling work. The combination of natural sample variance and analytical variance determines the number of biological replicates required to find statistically significant differences between samples. The smaller the analytical variance, the fewer replicates are required. Figure 2 illustrates a common workflow for profiling.

Figure 2
- Analysis: separation and detection of metabolites, usually by GC–MS or LC–MS;
- Feature extraction: find and quantify all the metabolites in the sample;
- Data normalization: correct for any retention time or response drift;
- Statistical analysis: discover statistically significant differences between sample sets.
Identification of Metabolites of Interest
After profiling, statistically interesting metabolites must be identified (Figure 3). There are four common approaches.

Figure 3
- Spectral library searching can eliminate the need for reanalysis and provide positive identification. This approach is used most often with reproducible electron ionization (EI) spectra from GC–MS.
- Database searching combined with analytical standards is frequently used with LC–MS data to find likely identities.
- De novo spectral interpretation is possible, especially when investigating specific metabolite classes.
- Purification and analysis by nuclear magnetic resonance spectroscopy is highly effective but is time-consuming.
Example of Metabolomic Profiling and Identification Using LC–MS
A pilot collaborative metabolomics study was undertaken to determine whether metabolite biomarkers of infection and immunity in rice could be identified. Rice is a major food staple for the world's population and is a model species in cereal genome research. Bacterial leaf blight (BLB) of rice, caused by the Xanthomonas oryzae pv. oryzae (Xoo) bacteria, leads to crop losses of up to 50%.
Two rice lines, TP309 (susceptible, wild-type) and TP309-Xa21 (resistant, transgenic), and two bacterial strains, PXO99 (wild-type) and PXO99-raxST– (knock-out) were studied along with appropriate controls and biological replicates (Table I).

Table I: Conditions tested and number of biological replicates used for each condition
First, rapid profiling of samples was performed using an LC electrospray ionization (ESI)–time-of-flight (TOF) MS system (Agilent 6210 TOF LC–MS system, Agilent, Palo Alto, California). Initial processing of the accurate-mass MS profiling data was done using Agilent MassHunter Software. The feature extraction and correlation algorithms in this software located the groups of covariant ions in each chromatogram. The software then accounts for isotopes, identifies potential sodium and potassium adducts that are observed commonly when using ESI-MS, and determines the neutral mass and signal abundance of the feature in the group. Each of these groups represented a unique compound. Agilent GeneSpring MS bioinformatics software was used to analyze the complex, multiclass data generated by the study. The retention time–mass pairs generated by the MassHunter Workstation software were exported for analysis in Agilent GeneSpring MS software. See Figure 4 for the workflow.

Figure 4
Statistical Analysis and Visualization
GeneSpring MS software has an array of useful statistical analysis and visualization tools (including one-way and two-way ANOVA [analysis of variance], principal component analysis [PCA], and class prediction algorithms) that enable the rapid discovery of biomarkers. Typically, experiments are designed as pair-wise comparisons, but GeneSpring MS can handle complex experimental designs; in this example, seven experimental states were studied simultaneously.
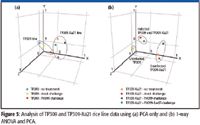
PCA is a very commonly used analysis tool for differential expression analysis. When PCA was performed on the rice data using the software with no prefiltering of data, separation of the TP309 and TP309-Xa21 rice lines was observed (Figure 5a). However, separation of the different classes of treatments containing information regarding immunity and defense was not observed. By first prefiltering the data (a metabolite must be present in all six biological replicates) and then performing one-way ANOVA before PCA, the differences between the two rice lines became much clearer, and it also was easier to distinguish infection status, regardless of rice line (Figure 5b).

Figure 5
Metabolite Database Searching for Identification
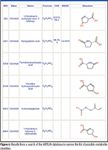
Metabolomic profiling provided a list of up-regulated immunity features that were selected for the next step in metabolomics investigation: targeted metabolite identification. The target masses identified in the profiling process were searched in the Agilent METLIN Personal metabolite database. This database — an effort by the Center for Mass Spectrometry at The Scripps Research Institute — is probably the best known and most comprehensive metabolite database in the world today. It currently includes annotated lists of over 15,000 endogenous metabolites and exogenous compounds, as well as di- and tripeptides, with each entry including mass, chemical formula, and structure information.
This database was searched to narrow the list of possible identities during the identification process (Figure 6).

Figure 6
The sample was then rerun on a quadrupole time-of-flight (Q-TOF) MS system (Agilent 6510 Q-TOF LC–MS system) using a targeted mass list produced by GeneSpring MS from the one-way ANOVA results. Separation and ion source conditions used were the same as those for the original TOF analyses. MS-MS spectra were acquired from each of the metabolites on the list of target masses. The up-regulated immunity features (m/z 130.0414) were subjected to MS-MS, and the examination of the MS-MS spectrum (Figure 7) showed a fragment ion representing the loss of a carboxyl group (formic acid, CH2O2) from the precursor ion. A second significant ion represented the subsequent loss of CO.

Figure 7
By evaluating the MS-MS spectrum obtained from the Q-TOF against the molecular structures included in the database search results, it was determined that only two of the six possible metabolites, pyroglutamic acid and pyrrolidonecarboxylic acid, logically could have produced the losses seen in that MS-MS spectrum. These two compounds are enantiomers, and as such are indistinguishable by MS. If obtaining the precise identity of the metabolite had been critical, it could have been determined through reanalysis using standards and a chiral LC column.
Conclusions
Metabolomics research requires not only sensitive and accurate mass instruments, but also powerful software. The results of this rice study demonstrate the need for multiple analytical instruments, plus a full range of metabolomics software programs to obtain high-quality results from a complex metabolomic experiment. It is important that the analysis software is capable of identifying significant relationships in complex experiments. The list of possible metabolite identities was reduced to a manageable number by using the combination of the high mass-accuracy of the TOF MS data and the metabolite database mentioned previously. The MS-MS spectrum from one interesting metabolite was obtained by reanalysis using MS-MS on a Q-TOF LC–MS system. This MS-MS spectrum led to the identification of one of two enantiomers. This study highlights the challenges of metabolomics. Even with the largest metabolite database commercially available and accurate-mass MS-MS spectra, conclusive identification of some compounds might still require further analysis.
An Online Metabolomics Educational Website
To help researchers quickly learn about metabolomics solutions and the latest developments in the metabolomics community, a virtual metabolomics lab has been launched (www.metabolomics-lab.com) that provides important literature listings, informative audiocasts, upcoming metabolomics meeting information, and links to other relevant websites. The virtual lab is constantly updated and will grow as the field of metabolomics grows.
Steve Fischer is Senior Applications Scientist, Metabolomics, and Sally Webb is Marketing Programs Manager, LC/MS–Proteomics/Metabolomics. Both are with Agilent Technologies, Santa Clara, California.

Distinguishing Alcohol- from Non-Alcohol-Associated Liver Cirrhosis with LC-MS
May 7th 2025A pilot study investigating whether nicotinamide adenine dinucleotide kinase (NADK) expression is selectively diminished in alcohol-associated liver cirrhosis (AC), as well as evaluating its potential as a biomarker for this condition, measured AC and non-AC (NAC). Nicotinamide adenine dinucleotide (NAD+) and nicotinamide adenine dinucleotide phosphate (NADP+) levels in human liver samples were measured using liquid chromatography-mass spectrometry (LC-MS).

.png&w=3840&q=75)

.png&w=3840&q=75)


.png&w=3840&q=75)


.png&w=3840&q=75)


