The LCGC Blog: UV Detection for HPLC—Fundamental Principle, Practical Implications
I’ve written several times on the operational principles and variables used in UV detection, but I also get asked questions on the basic theory of UV detection, and this time I’m going to address some of those FAQs to give a little more background theory as well as some operational tips and tricks.
HAKKI ARSLAN/stock.adobe.com

I’ve written several times on the operational principles and variables used in UV detection, but I also get asked questions on the basic theory of UV detection, and this time I’m going to address some of those FAQs to give a little more background theory as well as some operational tips and tricks.
Q. Why are UV spectra so featureless? It makes it difficult to know which wavelength to monitor.
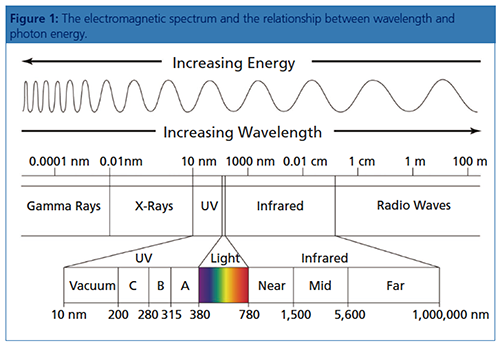
Some organic molecules can absorb electromagnetic radiation in the form of photons of UV and visible light. Typically the wavelength range used in UV detection for high performance liquid chromatography (HPLC) is in the range 200–400 nm, which covers both UV and the lower part of the visible spectrum. Figure 1 shows the electromagnetic spectrum and the relationship between the wavelength of light and frequency. It should be noted that the shorter the wavelength the higher the energy of the photons of light as defined by equation 1:
E = hc/λ [1]
here E is energy, h is Plancks constant, c is velocity, and λ is wavelength.
In order to absorb light energy, electrons within the atoms must be promoted from a ground state to an excited state and the specific energy transition will be dictated by the energy levels available, defined by the type of atoms and bonding within the molecule, and the energy of the incumbent radiation, defined by the wavelength of light chosen.
Figure 2 shows some typical energy transitions resulting from absorption of UV and visible light, when either bonding or nonbonding electrons are promoted to higher energy (antibonding) orbitals.
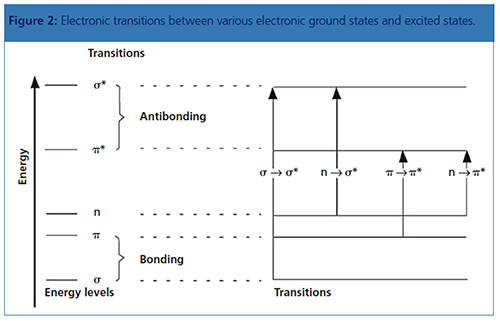
These various energy transitions can be roughly mapped against features of the organic molecules separated by HPLC.
So, in theory, we can quite easily map the energy and the wavelength associated with the transitions caused when molecules absorb photons of light. However, this is only part of the story and in reality, each of the orbitals into which the electrons are promoted have a number of sublevels associated with various vibrational and rotational states-any of which can be occupied by the promoted electrons, creating not just one, well-defined transition, but many different possible transitions. Therefore, a transition that might be expected to yield a single wellâdefined signal is actually “blurred” over a number of energies or, as we observe in the UV spectrum, wavelengths. Figure 3 shows this concept in more detail.
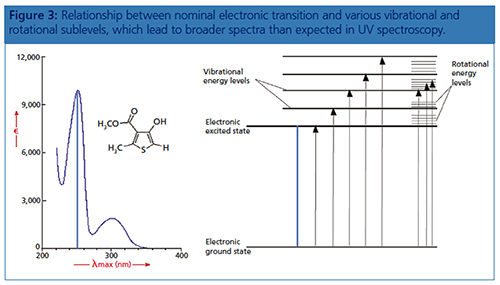
While selecting the λmax from the spectrum in Figure 3 may be more obvious, it is true in general that the rather featureless spectra obtained from UV instruments make the selection of λmax and indeed the use of libraries for compound identification more difficult. However, read on for more details on how these problems may, to some extent, be overcome.
Q. I’ve been told not to select the λmax for quantitative UV measurements because of robustness issues. Is this true?
In older UV instruments the stability and accuracy of the wavelength calibration was not as accurate as with modern instruments and therefore any small deviations in wavelength accuracy (drift) would lead to a large change in the signal intensity, which would obviously be an issue. In modern instruments this need not be an issue-although a close eye should be kept on wavelength calibration and regular checking of the response of a calibrant is always a good idea. Be mindful also that most modern instruments will “self-calibrate” as part of the instrument initiation routine-so it’s a good idea to power the instrument on and off from time to time! There are other reasons why the λmax of the absorbance spectrum may change, for example when the solvent, additive, or pH of the eluent change and this will lead to deviations in signal intensity. See a later question for more details on these topics.
Q. Why do I sometimes need to choose low wavelengths and why does my baseline look noisy at lower wavelengths?
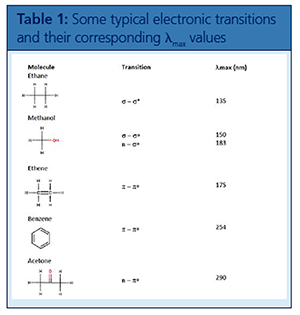
Electronic transitions involving ground state σ electrons or non-bonding (n) electrons into their various antibonding orbitals usually require a large amount of energy and therefore typically occur in the 180–240 nm region of the UV spectrum and are also of lower intensity compared to other transitions. For this reason, compounds that do not contain π electron systems (double bonds) typically occur at lower wavelengths and higher energies and this can be quite problematic when choosing UV detection wavelengths because the solvents and additive we use can often interfere with the analyte absorption, lowering sensitivity and adding to the general background noise. This being said, individual π-π* transitions involving just one double bond may also require higher energies and therefore may occur at lower wavelengths (for example, ethene has a λmax of 175 nm). Shifts of the λmax to higher wavelengths, which are less susceptible to interference from solvents or additives, typically only occur when the system is conjugated with multiple double bonds or are combined with other chromophores such as atoms containing lone pairs (n electrons), which are capable of electronic excitation (Figure 4).
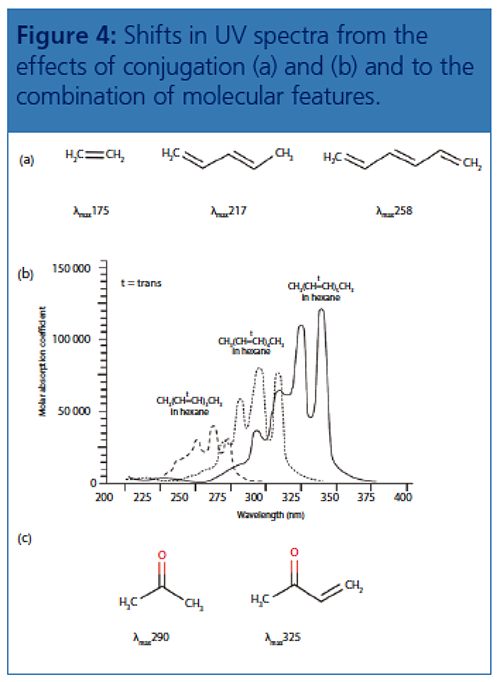
It’s clear the absorbance characteristics are governed by the structural features of the whole molecule rather than individual chromophores, especially when there are multiple groups capable of electronic excitation via photon energy. An auxochrome is a substituent that increases absorption of a molecule, typically methyl-, hydroxyl-, alkoxyl-, or amino group or a halogen atom; when the auxochrome is conjugated with a π-electron system, the λmax value is shifted to a longer wavelength.
Whenever a shift to a higher wavelength occurs, this is known as a red shift or a bathochromic shift. If a shift occurs to a lower wavelength, this is known as a blue shift or hypsochromic shift.
All of the above being said, to evaluate an analyte for its suitability for UV detection, it is always good to have an idea about the important chromophores typically encountered in organic molecules. The following links contain a host of information on the UV absorbance characteristics of functional groups and structural moieties:
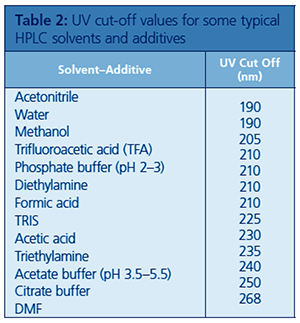
Table 2 shows solvent UV cut-off values for some common HPLC solvents and additives. UV cut-off is defined as the wavelength at which the pure component has an absorbance of 1 absorbance unit (AU) in a 1-cm pathlength cell with water as reference.
Q. What effects do different solvents and buffers have on UV sensitivity?
This is a very interesting question and is often misunderstood or ignored by users. There are many circumstances under which spectrum, and therefore the λmax value, may undergo bathochromic or hypsochromic shifts, resulting in a change in signal intensity if a single wavelength is being monitored.
It is fair to say that while all measurements are taken under the same eluent conditions, then quantitative measurements will be valid; however, what if the eluent composition changes slightly during the analysis? Furthermore, what may have been a good wavelength in a certain eluent, may not be when the eluent is changed; this can be particularly relevant when undertaking eluent screening or optimizing during method development.
The polarity of a solvent can modify the electronic environment of the absorbing chromophore. This can change the absorbance maxima and ε values for a molecule. For comparative analysis, a single solvent should be used for all measurements.
The Frank-Condon principle states that during an electronic transition the atoms do not move; whereas electrons, including those of the solvent molecules, will reorganize during an electronic transition. Most transitions result in an excited state more polar than the ground state.
Therefore, polar solvents will be able to interact to a greater extent with the more polar excited state via dipole-dipole interactions. These stabilizing interactions will lower the energy of the excited state but will have a negligible effect on that of the ground state, resulting in a change of absorbance maximum.
For example, it has been seen that ethanol (polar) solutions produce spectra with longer wavelength maxima in comparison to hexane (nonpolar) solutions. A small red shift of approximately 10–20 nm (π-π*) is observed when the solvent is changed from hexane to ethanol.
For n → π* transitions, a solvent effect is seen in the opposite direction (producing blue shift). The shift observed in the wavelength is attributed to a reduction in solvent hydrogen bonding in the excited state.
Carbonyl groups in particular can hydrogenâbond to solvents, which can accentuate the change to the UV spectrum when measured in polar solvents. For example, changing from hexane to water as the solvent for propanone changes the absorption maximum from 280 to 257 nm (Figure 5).
The effects of pH on absorbance spectra can be large and result primarily from the shifting of equilibrium between two different molecular forms, which may include from ionized to non-ionized or vice versa, as well as analyte conformational or shape changes.
Buffers can help control pH but remember that they also may absorb UV at the intended wavelength and therefore sensitivity may be reduced and noise increased.
One needs to be particularly mindful of pH changes over extended analytical campaigns when using volatile buffers or pH adjusting reagents because the volatile component is lost into the eluent reservoir headspace over extended periods of time.
Temperature can also have a pronounced effect on UV spectra, and these possible variations due to changes to the HPLC column oven temperature also need to be kept in mind when making changes to HPLC methods.
Q. Can I really use UV detection to track peaks when developing methods or screening different columns or mobile phases?
As we discussed earlier, solutionâbased UV spectra for many organic compounds can be rather featureless, unlike vapuor phase spectra which can be featureârich. Furthermore, the amount of detail within the spectra can be dependent upon the composition of the eluent in which they are measured as shown in Figure 7.
However, even when 0th order spectra are rather featureless, making the use of libraries and peak tracking rather difficult, all is not lost.
Most UV detector or chromatography data system (CDS) software can create “derivative” spectra (dA/dλ) and these spectra contain increasingly greater numbers of useable maxima and minima, which add data points to the spectra and can be very useful for increasing confidence when identifying or tracking peaks (Figure 8).
It should be noted that higher order derivatives (2nd, 3rd) show a marked decrease in sensitivity as data is lost during the mathematical transformation and therefore 1st order derivatives should be chosen where possible. Further, there needs to be sufficient data captured during acquisition in order for the transformations to be meaningful.
Check your CDS supplier or manufacturer for instructions on how to achieve the data transformation and add derivative spectral to libraries.
Reference
- L. Wang, J. Pharm. Biomed. Anal.21(6), 1243–1248 (2000).
Tony Taylor is the technical director of Crawford Scientific and CHROMacademy. He comes from a pharmaceutical background and has many years research and development experience in small molecule analysis and bioanalysis using LC, gas chromatography (GC), and hyphenated mass spectrometry (MS) techniques. He is actively involved in method development within the analytical services laboratory at Crawford Scientific.

Removing Double-Stranded RNA Impurities Using Chromatography
April 8th 2025Researchers from Agency for Science, Technology and Research in Singapore recently published a review article exploring how chromatography can be used to remove double-stranded RNA impurities during mRNA therapeutics production.
The Effect of Time and Tide On PFAS Concentrations in Estuaries
April 8th 2025Oliver Jones and Navneet Singh from RMIT University, Melbourne, Australia discuss a recent study they conducted to investigate the relationship between tidal cycles and PFAS concentrations in estuarine systems, and offer practical advice on the sample preparation and LC–MS/MS techniques they used to achieve the best results.


