A Laser Diode Double-Pumped Solid-State Laser-Induced Fluorescence Detector for Capillary Electrophoresis and Liquid Chromatography
LCGC North America
The authors describe a new laser-induced flourescence detector for application to both capillary electrophoresis (CE) and high-performance liquid chromatography (HPLC).
As one of the most sensitive detection techniques, laser-induced fluorescence (LIF) detection has been widely applied to chemical separations since the early pioneer work (1,2). Gas lasers such as Ar+ and He-Cd are commonly used in LIF systems as the excitation sources, which are responsible for the slow evolution of LIF development for routine analysis due to their high cost, size, limited life, and complex maintenance (3). Recently, many groups have attempted to focus on the native fluorescence detection of biological molecules using a UV laser (4,5) to eliminate the need for derivatization of nonfluorescent analytes. Due to the relatively high cost and the specific requirements, UV-LIF detection is attractive but not popular. While the laser diode suffers from its longer emitting wavelengths (for example, 635 nm), very few commercial fluorophores are available (6). Though violet laser diodes (405 nm) are commercially available and have been applied to CE detection (7), their price is still high. The laser diode double-pumped solid-state (LD-DPSS) laser is a new solid laser source that combines the advantages of gas lasers with laser diodes to a large extent. Compared with gas lasers, the LD-DPSS laser shows the advantages of small size, low cost, long life, good output stability, and reasonable light intensity, all of which make it an attractive excitation source for an LIF system. Imasaka and colleagues first demonstrated the LIF detector using an LD-DPSS laser emitting at 415 nm for the determination of amino acids in CE (8). The low power of the laser (50 μW) limited many applications of the detector because of low sensitivity. Roeraade and colleagues assembled an LD-DPSS laser emitting at 424 nm and applied it to LIF detection for CE (9). An LD-DPSS laser emitting at 473 nm is commercially available, and the output power of these lasers reaches tens of mW, which is suitable to be used as an excitation source and replace the Ar+ laser in LIF detection. Although presently the price of a 473-nm DPSS laser is slightly higher than that of a 488-nm Ar+ laser, the great demand for them in the optic-electronics fields is decreasing the cost continually. Considering the usage cost (water cooling or air cooling) and long life, the DPSS laser shows many advantages over the Ar+ laser.

An LIF detector based upon confocal configuration has some advantages, such as compactness and high efficiency, and has gained wide acceptance in CE systems since the first description by Hernandez and colleagues (10). The on-column detection mode is widely adopted when confocal LIF is applied in HPLC (11). To obviate the high level of laser scattering from the capillary, some different postcolumn flow cells have been implemented. Diebold and colleagues presented a windowless flow cell in which the HPLC effluents flow from a steel capillary tube down to a rod 2 mm below, forming a 4-μL droplet bridge (1). Because of the spherical shape of the droplet, the scattering is still severe, particularly when the flow rate is low. Hershberger and colleagues designed a cell based upon a sheath flow principle, in which the effluent is injected into the center of an ensheathing solvent stream under laminar flow conditions. Because the windows are not in contact with the sample flow, the stray light from the windows is reduced (12). However, the sheath-flow cell is complicated, which makes its design and operation difficult. Sepaniak and colleagues used a quartz capillary tube in which the HPLC effluent moved upward. A laser beam was focused in the effluent underneath an optical fiber. The emission was collected through the fiber perpendicular to the laser beam. The construction led to a minimal influence of scattered and fluorescent light from the capillary tube walls (13). However, the use of optical fiber attenuates fluorescence intensity compared with using the objective.
Here we report an LIF detector for both CE and HPLC, utilizing an LD-DPSS laser emitting at 473 nm as an excitation source. It is based upon a confocal scheme and is coupled with CE and microbore LC by on-column detection mode, and HPLC by a particularly designed postcolumn flow cell. The performance of the detector was evaluated using fluorescein isothiocyanate (FITC) by CE, which showed comparable results to that of an Ar+ 488-nm LIF system. In addition, the analysis of FITC-labeled phenylalanine by HPLC and real sample containing riboflavin by CE and HPLC also was demonstrated.
Experimental
Reagents and apparatus: A homemade CE system consisting of a fused-silica capillary (46 cm × 50 μm, 34 cm to the detector) and a high-voltage power supply (0–30 kV, Dongwen, China), was used to evaluate the detector. The working electrolyte for CE separation was Na2B4O7 buffer (20 mM, pH 9.2). Sample injection was carried out by hydrodynamic technique (h = 10 cm, t = 10 s). All reagents used were of reagent grade, and deionized water was used throughout. A Jasco PU-1580 intelligent pump HPLC system (Easton, Maryland) was used to deliver the mobile phase for the postcolumn flow cell. A Zorbax HP C18 analytical column (150 mm × 4.6 mm, 5 μm, Hewlett Packard, Palo Alto, California) was used. The mobile phase was 80:20 (v/v) 30 mM phosphate (pH 9.8)–methanol at a flow rate of 0.5 mL/min.
Sample preparation: A multivitamin drink was used without sample preparation. 1-mL of crude watermelon juice was centrifuged at 2000 rpm for 3 min and 100 μL of supernatant homogenous sample was collected. The sample was diluted 10-fold with deionized water and then filtered through a 0.22-μm filter before use. The treatment procedure of a milk sample was the same as that used on the watermelon sample.
Optical system: The schematic diagram of the LIF detector is shown in Figure 1. An LD-DPSS laser emitting at 473 nm (CW, TEM00, Stability, < 3% in 4 h, beam linewidth 0.05 nm, 20 mW, New Technology, Inc.) is used as an excitation source. To reduce the focused spot size, the beam was expanded to give a collimated source 4 mm in diameter. The laser beam was reflected by a 45° dichroic mirror (Huibo, Shengyang, China) and focused by a microscope objective (10 × 0.25, Jiapin, Nanjing, China) into the center of capillary cell. The detection window (5 mm length) was formed by burning off the polyimide coating with an electrical coiled resistance. Fluorescence was collected by the same objective and passed through the dichroic mirror and a interference filter (BP530 nm, FWHM30 nm, Huibo, China) and focused by a lens (Daheng, Beijing, China) on a pinhole, and then detected by a side-on red sensitive photomultiplier tube (Type R928, Hamamatsu, Japan) equipped with its own high-voltage power supply. The signal from the photomultiplier tube was acquired and manipulated by a ChromStation (KeFen, Dalian, China). To diminish light scattering and reduce background noise, a hole was drilled in the capillary cell carrier. The laser light went through the hole and was absorbed by a black cylinder underneath the hole.

Structure of postcolumn flow cell: We designed a new postcolumn flow cell for a confocal HPLC-LIF system as shown in Figure 2. In this setup, the excitation axis (laser beam) and two fluid channels are on the same plane and form a 120° angle. The effective diameter of the optical window is 1 mm, which reduces greatly the difficulty of optical alignment compared with on-column detection, in which the diameter of capillary cell is usually less than 0.32 mm (11). In addition, the plane detection window is desirable for optical detection compared with the cylindrical cross section of a capillary cell in on-column detection. The cell volume is approximately 7 μL including the connection channel, which matches the conventional cell volume (8 μL) used for absorption detection in HPLC. However, it should be noted that the effective volume (probe volume) is determined by the focused spot size of the laser beam, and is about 0.1 nL in this system. Lowering the cell volume to match the probe volume will probably contribute to enhancing the detection sensitivity (14). Because of the lack of a precision machining device, a 5-nL cell volume cannot be achieved. The present flow cell volume of 7 μL produces small extracolumn broadening effects and meets the needs of conventional analysis. The flow cell can be exchanged easily with an on-column cell and can be used in an HPLC or CE system.
Results and Discussion
Effects of second-order nonlasing wavelengths: Due to its working principle, the LD-DPSS laser always produces some nonlasing wavelengths. These nonlasing wavelengths usually interfere with the fluorescence detection if the filter configurations are improperly designed. By monitoring the fluorescence intensity of fluorescein solution that was continuously pumped though the capillary flow cell, the background signal was compared before and after a short-pass excitation filter, which blocks the 490-nm wavelength. The results showed that there was almost no difference between them (results not shown), indicating that the effect of nonlasing wavelengths could be neglected in the present setup.
Comparison of postcolumn and on-column flow cells: The cell volume of the detector used in HPLC should be kept small to minimize the postcolumn band-broadening effects. Table I shows the comparative results between the postcolumn and on-column flow cells. In this experiment, the separation column was replaced by capillary tubing for more accurate measurement of the characteristics of the flow cell. Peak-tailing factors and peak width of half height were used as the criteria. The tailing factors generated in the postcolumn flow cell were acceptable for HPLC application because the front edge of the injection band had only a minor front tailing after the flow cell. However, it should be noted that the enhancement of sensitivity could be obtained by lowering the cell volume to match the probe volume. Further development of flow cell with nanoliter-magnitude cell volumes will contribute to lowering the detection limit.

System characteristics: The performance of the LIF detector was evaluated in the CE system. The S/N was 120 for 0.2 nM fluorescein solution (RSD < 3%, n = 6). The concentration detection limit, defined as three times the baseline noise, was 5 pM, assuming linear response in the concentration range. This value is comparable to that of Ar+-based LIF detection (15). The electropherogram of five sequential injections of 1-nM fluorescein isothiocyanate is shown in Figure 3. The relative standard deviation of the peak height was 2%. Further improvements in detectability could be realized by using a notch filter that could remove the laser light more efficiently (11). The system noise was about 30 μV, which was slightly higher than the intrinsic noise of the data acquisition card, indicating the predominance of the LIF system using an LD-DPSS laser as an excitation source. In the range of approximately 0.5–50 nM FITC, the detector shows a good linear relationship (r = 0.999).
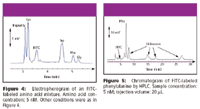
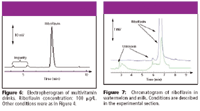
Applications: Reepresentative applications show the utility of the detector. Figure 4 shows the analysis of four amino acids labeled by FITC in CE. A standard solution was prepared by successive dilution of a 0.1 mM stock solution of FITC-labeled amino acid. The detection limit of 1 nM was achieved for tryptophan. To demonstrate the applicability of the LIF detector in HPLC, the analysis of FITC-labeled phenylalanine also was demonstrated in Figure 5. The concentration detection limit for tryptophan was 60 pM, which was superior to that using CE. Riboflavin is an important compound normally present at trace level in food and clinical samples and it is also one of the few biomolecules that exhibits native fluorescence, and thus, it is suitable for direct fluorescence detection without any derivatization. Figure 6 shows the electropherogram of riboflavin in the beverage containing 0.27 μM riboflavin. The detection limit of 5.3 nM for riboflavin is comparable to that obtained by Cataldi and colleagues (1.3 nM) using the 442 nm line of the He-Cd laser (16). For comparison, the analysis of riboflavin by LIF-HPLC using the flow cell was performed, and a 0.27 nM detection limit was obtained. The analysis of riboflavin in real samples was performed. Figure 7 shows the chromatogram of riboflavin in watermelon (0.22 μM) and milk (0.4 μM). Lacking appropriate fluorophores (such as CBQCA, FQ, NBD-F) matching this detector, however, we could not carry out more applications. However, the results achieved show that the detector is applicable in the determination of trace biosamples combined with CE or HPLC systems.

Table I: Comparison of band broadening between the postcolumn and on-column flow cell
Conclusions
We developed an LIF detector using a 473-nm LD-DPSS laser as an excitation source. The detector was coupled with CE by on-column mode and with HPLC by a postcolumn flow cell for HPLC. The performance of the detector is comparable to that of Ar+ 488-nm gas laser–based LIF systems, while it has the advantages of extended life and reduced system cost, size, and power consumption. Furthermore, improvements in detectability could be realized by decreasing the background scatter light and improving optical beam quality. For HPLC measurement, a postcolumn cell with nanoliter-magnitude cell volume will be desirable for lowering the postcolumn band-broadening and detection limit. We believe that such a detector will find wide application in CE or HPLC systems.

References
(1) G.J. Diebold and R.N. Zare, Science 196, 1439–1441 (1977).
(2) E.Gassmann, J.E. Kuo, and R.N. Zare, Science 230, 813–814 (1985).
(3) C. Gooijer and A.J.G. Mank, Anal. Chim. Acta 400, 281–295 (1999).
(4) K.C. Chan, G.M. Muschik, and H.J. Issaq, Electrophoresis 21, 2062–2066 (2000).
(5) J. Kuijt, C. Garcia-Ruiz, G.J. Stroomberg, M.L. Marina, F. Ariese, U.A.T. Brinkman, and C. Gooijer, J. Chromatogr., A 907, 291–299 (2001).
(6) G. Ocvirk, T. Tang, and D.J. Harrison, Analyst 123, 1429–1434 (1998).
(7) J.E. Melanson and C.A. Lucy, Analyst 125, 1049–1051 (2000).
(8) T. Higashijima, T. Fuchigami, T. Imasaka, and N. Ishibashi, Anal. Chem. 64, 711–714 (1992).
(9) M. Jansson and J. Roeraade, Anal. Chem. 65, 2766–2769 (1993).
(10) L. Hernandez, J. Escalona, N. Joshi, and N.A. Guzman, J. Chromatogr. 559, 183–196 (1991).
(11) N. Siméon, R. Myers, C. Bayle, M. Nertz, J.K. Stewart, and F. Couderc, J. Chromatogr., A 913, 253–259 (2001).
(12) L.W. Hershberger, J.B. Callis, and G.D. Christian, Anal. Chem. 51, 1444–1446 (1979).
(13) M.J. Sepaniak and E.S. Yeung, J. Chromatogr. 190, 377–3831 (1980).
(14) W.A. Lyon and S.M. Nie, Anal. Chem. 69, 3400–3405 (1997).
(15) A.J.G. Mank and E.S. Yeung, J. Chromatogr., A 708, 309–321 (1995).
(16) T.R.I. Cataldi, D. Nardiello, L. Scrano, and A. Scopa, J. Agric. Food Chem. 50, 6643–6647 (2002).

Extracting Estrogenic Hormones Using Rotating Disk and Modified Clays
April 14th 2025University of Caldas and University of Chile researchers extracted estrogenic hormones from wastewater samples using rotating disk sorption extraction. After extraction, the concentrated analytes were measured using liquid chromatography coupled with photodiode array detection (HPLC-PDA).
Polysorbate Quantification and Degradation Analysis via LC and Charged Aerosol Detection
April 9th 2025Scientists from ThermoFisher Scientific published a review article in the Journal of Chromatography A that provided an overview of HPLC analysis using charged aerosol detection can help with polysorbate quantification.


