"Just Enough" Sample Preparation: A Proven Trend in Sample Analysis
LCGC Asia Pacific
This article discusses the details of how the newer techniques of sample prepaation are simplified by the use of LC–MS–MS and GC–MS–MS technology.
Sample preparation (and to a lesser extent data analysis) has often been considered the ratedetermining step and error-prone part of an analytical method. If selectivity can be achieved in other portions of the analytical cycle to meet the needs of the analyst, then the burden placed on sample preparation is decreased. The concept of "just enough" sample preparation is presented here and relies heavily on recent advances in tandem mass spectrometry detection that provides enhanced sensitivity and selectivity, which was unavailable in the past. Even so, more sophisticated sample preparation protocols may still be required, especially if ion suppression or enhancement result from coeluted interferences.
In her February 2012 column instalment titled "It's All About Selectivity," guest columnist Diane Turner introduced the topic of how selectivity can be incorporated throughout the sample analysis cycle (1). Figure 1, borrowed from her article, nicely illustrates the workflow in a typical sample analysis. In most analytical processes, the chemist is looking for one or perhaps a few analytes of interest, often in a very complex matrix. Having an analytical method showing sufficient selectivity to analyse those few compounds of interest with the precision and accuracy required at the concentration level encountered is the desired outcome of method development. The selectivity can be achieved anywhere within the analytical cycle (Figure 1) during sampling, sample preparation, sample introduction, analyte separation, at the detector or even during data analysis. If the analytes of interest can be determined with good sensitivity, the presence of compounds from the sample matrix can be tolerated as long as those interferences do not cause harm (short-term or longterm) to the analytical instrument or column or if determined to be harmful, they can easily be removed. An example of the latter could be backflushing after each analysis to remove highmolecularweight contaminants trapped at the head of a gas chromatography (GC) column. In Turner's column (1), she gave very nice examples of how selectivity can be achieved at each step of the analytical cycle for GC.
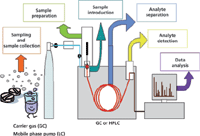
Figure 1: Steps in the analytical cycle. Adapted from reference 1.
Having less selectivity in one portion of the analytical cycle can be made up for by having greater selectivity in another portion of the analytical cycle. For example, if an analyst has only a fixed-wavelength UV detector in his or her high performance liquid chromatography (HPLC) instrument or a thermal conductivity (TCD) or flame ionization detector (FID) for the GC system, there may not be sufficient detector selectivity to provide the necessary overall method selectivity to measure an analyte of interest without interference from undesired sample components. Therefore, additional sample preparation or finding a separation column that provides more selectivity during the separation may be required to make up for the limitations in the detector. In these cases, the analyst may spend a great deal of time and energy performing one or more sample preparation steps or optimizing the selectivity of the column and mobile phase system (HPLC) to rid it of potential interferences. On the other hand, if one has a very sensitive and selective detector, then perhaps spending a great deal of time optimizing the sample preparation or the analytical separation is unwarranted.
Because achieving selectivity for the separation column is not an easy task to predict, sample preparation often gets the brunt of the job to remove interferences from the sample of interest. It is sometimes unfortunate to burden analysts with this job, but there are timeproven sample preparation techniques available. However, with the advent and widespread use of tandem mass spectrometry (MS–MS) for both HPLC and GC with its high degree of selectivity and sensitivity, sample preparation as well as the chromatographic separation can sometimes be simplified as long as any interferences carried over from the sample matrix do not interfere with the separation or detection process. We term this simplified sample preparation process just enough sample preparation.
This just enough sample preparation process doesn't always provide the cleanest extract from the sample as more rigorous approaches such as multimodal solid-phase extraction (SPE) or liquid–liquid back extraction might achieve but as long as the extractables do not harm the separation or detection (and, of course, the column or instrument), that's okay. In reality, the sample preparation time can be greatly reduced as long as the final outcome meets the needs of the analyst. Although the mass spectrometer still represents a much higher priced detector than a UV or flame ionization detector, many laboratories are finding them to be a cost-effective way to enhance and speed up their analyses, thereby improving overall productivity and lowering costs. Of course, lessexpensive selective detectors such as fluorescence in HPLC and electron capture in GC still allow the practice of just enough sample preparation provided the analytes do not need derivatization.
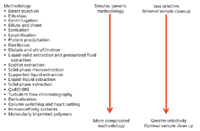
Figure 2: Just enough sample preparation represents a continuum of methodologies.
The concept of just enough sample preparation does not imply one is cutting corners or that more sophisticated protocols are not required. It really represents a continuum of sample preparation procedures as depicted in Figure 2. This figure represents just a few of the many sample preparation methods that are in widespread use. Starting at the top of the figure with filtration, centrifugation and "dilute and shoot", moving down the sample preparation protocols become more selective and more complex, sometimes requiring a greater deal of effort and multiple steps to achieve just enough cleanup to meet the analytical needs. Minimizing the number of sample handling steps in any analytical technique is desirable since the more times the sample is transferred, the greater the chance of analyte loss (or modification), thereby resulting in poorer analytical precision and accuracy. If one or two steps meet the needs of the method that may be sufficient, but in some cases additional sample preparation steps may be needed to get rid of interferences. The need to eliminate or minimize interferences is no greater than that required for liquid chromatography–mass spectrometry (LC–MS) and LC–MS–MS (see below).
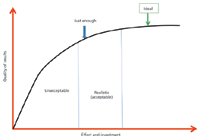
Figure 3: Striking the right balance in sample preparation.
Figure 3 shows a pictorial representation of the just enough sample preparaton concept that actually applies to the entire analytical cycle, but is emphasized for the sample preparation portion. It is here that many workers are faced with achieving the bulk of their selectivity enhancement. Ideally, in an analytical method one always wants to achieve the best result with the least amount of effort and investment. On the other hand, the actual data requirement may not require the ideal result but rather an acceptable result. For example, in screening hundreds of urine samples for the presence of drugs of abuse most samples are negative. Thus, a qualitative analytical method may be sufficient to rule out the presence of an illicit drug. However, if an illegal drug is spotted during the screening test, then a more careful and perhaps more sophisticated look at a positive sample is required for quantitative analysis.
There are many other factors that may influence the choice of the sample preparation techniques used to provide just enough cleanup. An analyst's skill and knowledge are important. The availability of instrumentation, chemicals, consumables and other equipment; the time available to develop a method and to perform the tasks at hand; the complexity and nature of the matrix; the analyte concentration level and stability; the required sample size; the cost per sample (budget); and the safety of the sample preparation technique are just a few of the many considerations that must be taken into account. It is the balance of all of these and other considerations that come into play.
Ion Suppression in LC–MS and LC–MS–MS
An area of potential problem in the just enough sample preparation approach is unique to LC–MS and LC–MS–MS. The impact of unextracted matrix compounds that may coelute with the analytes of interest may end up in the ionization chamber of the mass spectrometer. Ion suppression in MS is one form of a matrix effect that impacts analyte ionization in the MS source. Most often a loss in response occurs; hence the term ion suppression is generally used. Ion suppression effects impact reproducibility and signal strength. They are most noticeable when trace analytes are in the presence of complex matrices such as biological fluids. In some cases, an increasing response of the desired analyte may occur; ion enhancement or a strongerthanexpected signal results.
Ion suppression results from the presence of less volatile compounds that can change the efficiency of droplet formation or droplet evaporation, which in turn affects the amount of charged ion in the gas phase that ultimately reaches the detector. Materials shown to cause ion suppression include salts, ion pairing reagents, endogenous compounds, drugs, metabolites and proteins. The electrospray ionization detector (EID) is strongly affected by the presence of certain coeluted compounds. Atmospheric pressure chemical ionization detectors are also affected by ion suppression but to a lesser extent than the electrospray detector. The presence of ion suppression can be determined by the use of infusion. The infusion experiment involves the continuous introduction of the standard solution containing the analyte of interest and its internal standard by means of the syringe pump connected to the column of fluid. A drop in constant baseline after a blank sample extract is injected into the LC system indicates suppression in ionization of the analyte because of the presence of the interfering material.
Although beyond the scope of this article, there are a number of strategies for reducing ion suppression. Among them are changing the ionization mode (such as switching to negative ionization), sample dilution or volume reduction, reducing the flow rate, improving chromatographic selectivity or performing better sample preparation. In the latter case, just enough sample preparation to meet the analytical needs may be the use of SPE, liquid–liquid extraction or even additional techniques. The use of formic acid rather than trifluoroacetic acid in the HPLC mobile phase can also help. For more information, a simple discussion of ion suppression effects and their elimination was published earlier (2).
Examples of Just-Enough Sample Preparation
Many sample preparation methodologies have already been published in earlier instalments of "Sample Preparation Perspectives". Figure 2 provides a number of sample preparation protocols that could qualify as just enough procedures. As mentioned earlier, the fewer sample preparation steps in an analytical method the less chance of errors, better analyte recovery and less time spent handling samples. However, as one proceeds down Figure 2, just enough may require more sophisticated sample preparation processes.
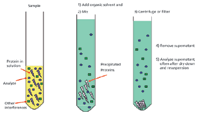
Figure 4: Steps in protein precipitation.
Let's look at a few examples of sample preparation procedures that may qualify as just enough and see if they provide acceptable results. In recent years, for the determination of drugs and their metabolites in biological fluids such as plasma, many pharmaceutical companies have switched their sample preparation to protein precipitation (Figure 4) and reversed-phase HPLC analysis but using a more selective, sensitive LCtriplequadrupole MS–MS detector with multiple reaction monitoring (MRM) at defined transitions. The first example shows the direct analysis of fluticasone proprionate in human plasma using an LC–triple quadrupole MS system. This compound is a synthetic steroid of the glucocorticoid family of drugs for treating allergic conditions. When used as a nasal inhaler or spray, medication goes directly to the epithelial lining of the nose, and very little is absorbed into the rest of the body. Because of its low systemic levels, a high sensitivity LC–MS assay is required to determine its concentration in human plasma. Figure 5 shows the LC–MS results from a plasma protein precipitation followed by dilute and shoot using the MRM transition shown in the figure caption. In this case, the dilute and shoot method has more than adequate sensitivity at the lowest calibration level of 5 pg/mL. Thus, dilute and shoot sample preparation has an assay performance well within the accepted regulatory guidelines and was just enough to meet the analytical needs.

Figure 5: LCâMS analysis of fluticasone proprionate in plasma. Shown is an ion chromatogram (MRM transition 501.2â293.1) for 2.5 fg injected on-column with a 1-fg limit of detection. The standard curve was linear over the range of 5 pg/mL to 50 mg/mL. The plasma sample was precipitated with acetonitrile and then diluted four-fold with water. Adapted from reference 3.
A second example is also a protein precipitation but considering an area where ion suppression comes into play. The presence of phospholipids in plasma can cause ion suppression if analytes of interest coelute in the portion of a chromatogram where these phospholipids appear. Phospholipid MS–MS selectivity can be achieved by considering the m/e 184 → m/e 184 transition indicative of phospholipid and lysophosphatidylcholine elution. Figure 6(a) shows a typical infusion experiment result that is obtained from proteinprecipitated plasma, followed by Captiva filtration (Agilent Technologies, Delaware, USA). If the drug or its metabolites were to coelute with these compounds, ion suppression may occur and the analytical results would be jeopardized. Thus, in this case the simple protein precipitation sample preparation procedure may not be enough to provide reliable data. By performing the more complex SPE [Figure 6(b)] or liquidliquid extraction [Figure 6(c)], the extract is now cleaner and many of the phosphoruscontaining lipids are greatly reduced. To get the best overall performance, an even more sophisticated phospholipid reduction may be achieved with a selective SPE phase that removes the last traces of phosphorylated compounds [Figure 6(d)]. Luckily, a product called Captiva NDLipids , which is a combined membrane filtration and phospholipid removal 96-well plate, performs both operations at once and thus is a simple just enough solution to this problem.
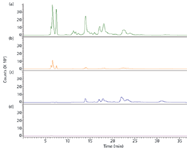
Figure 6: LCâMSâMS postcolumn infusion studies: (a) protein precipitation (Captiva, Agilent), (b) solid-phase extraction using a neutral polymeric cartridge, (c) liquidâliquid extraction with methyl-tert-butyl-ether and (d) lipid-stripped protein precipitation (Captiva NDLipids, Agilent).
QuEChERS (quick, easy, cheap, effective, rugged and safe) is a sample preparation technique that was originally developed for the extraction of pesticides from fruits and vegetables (4). It is a relatively simpler sample preparation procedure with two steps: a salting out partitioning extraction involving water and acetonitrile with high concentrations of salts such as sodium chloride, magnesium sulphate and buffering agents, and a dispersiveSPE step in which an aliquot from the first step is treated with various sorbents to remove matrix compounds that could interfere with subsequent LC–MS, LC–MS–MS, GC–MS or GC–MS–MS analysis. The technique has proven to be widely applicable at trace levels for hundreds of pesticides in a variety of matrices. Standard protocols are available that make it a generic sample preparation procedure.
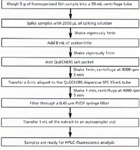
Figure 7: Flowchart of the QuEChERS AOAC sample preparation procedure. Adapted from reference 7.
Recently, QuEChERS extraction has expanded well beyond the pesticide laboratory and has been used for many matrices ranging from antibiotics in meat and poultry, veterinary drugs in animal feed, and environmental contaminants in soil. In this example, using the protocol in Figure 7, QuEChERS was used for the extraction of polycyclic aromatic hydrocarbons (PAHs) in fish. The PAHs are a large group of organic compounds included in the European Union and the United States Environmental Protection Agency priority pollutant list because of their mutagenic and carcinogenic properties. In the marine environment, PAHs are bioavailable to marine species via the food chain, as waterborne compounds and contaminated sediments. This application shows that tandem MS detection techniques are not necessarily required for just enough sample preparation. Most of the PAHs are highly fluorescent and thus, as shown in Figure 8, reversedphase HPLC was combined with fluorescence detection to determine 16 of these compounds at a spiking level of less than 10 ng/g (5). QuEChERS extraction provided excellent recoveries with %RSDs below 2.

Figure 8: Overlay HPLCâfluorescence chromatograms of a PAH-spiked fish extract. The black portion of the chromatogram used 260-nm and 352-nm excitation and emission wavelengths, respectively, the red portion used 260-nm and 420-nm wavelengths, and the blue portion used 260-nm and 440-nm wavelengths. For acenaphthylene, UV detection at 230-nm was used. Column: 50 mm à 4.6 mm, 1.8-µm dp Agilent Zorbax Eclipse PAH C18; flow rate: 0.8 mL/min; temperature: 18 °C; injection volume: 5 µL; mobile-phase A: deionized water; mobile-phase B: acetonitrile; gradient: 60% B for 1.5 min, 60â90% B in 6.5 min, 90â100% B in 6 min. Peaks: 1 = naphthalene (20 ng/g), 2 = acenaphthylene (20 ng/g), 3 = acenaphthene (10 ng/g), 4 = fluorene (10 ng/g), 5 = phenanthrene (10 ng/g), 6 = anthracene (10 ng/g), 7 = fluoranthene (10 ng/g), 8 = pyrene (10 ng/g), 9 = 1,2-benzanthracene (5 ng/g), 10 = chrysene (10 ng/g), 11 = benzo[e]pyrene (5 ng/g), 12 = benz[e]acenapthylene (5 ng/g), 13 = benzo[k]fluoranthene (5 ng/g), 14 = dibenz[a,h]anthracene (5 ng/g), 15 = benzo[ghi]perylene (5 ng/g), 16 = indeno[1,2,3-cd]pyrene (5 ng/g).
Conclusions
The selectivity needed for the determination of targeted analytes in a complex matrix can be achieved anywhere in the analytical cycle. With a focus on the sample preparation portion, the concept of just enough sample preparation was presented. This concept relies heavily on the increased sensitivity and selectivity that can be achieved with tandem MS coupled with chromatographic separation. Provided that ion suppression and enhancement contributions are held to a minimum, Just enough sample preparation can provide the recoveries, minimum detectable limits and minimum detectable quantities consistent with the needs of the assay. However, as illustrated in the example of PAH analysis in fish, other selective detection principles such as fluorescence can also be used. A note of caution: in many essays, sample processing (handling) is still the ratedetermining step and just enough sample preparation may be insufficient to meet the needs of the assay. In these cases, moresophisticated sample preparation protocols such as SPE or liquid–liquid extraction may still be required.
Acknowledgments
I would like to acknowledge the contributions of Trisa Robarge and Edward Elgart of Agilent Technologies for their review and input on the contents of this article.
References
(1) D. Turner, LCGC Europe 25(2), 79–87 (2012).
(2) http://www.chromatographyonline.com/lcgc/article/articleDetail.jsp?id=327354.
(3) Bioanalysis Application Note "Determination of Fluticasone Proprionate in Human Plasma," Agilent Technologies, Santa Clara, California, USA, Publication # 5990-6380EN, August, 2010.
(4) M. Anastassiades, S.J. Lehotay, D. Stajnbaher and F.J. Schenck, J. AOAC Int. 86, 412–431 (2003).
(5) B.O. Pule, L.C. Mmualefe and N. Torto, "Analysis of Polycyclic Aromatic Hydrocarbons in Fish," Agilent Technologies, Santa Clara, California, USA, Publication #5990-5441EN, January, 2012.
Ronald E. Majors is the editor of "Sample Preparation Perspectives" and a senior scientist in the columns and supplies division at Agilent Technologies in Wilmington, Delaware, USA. He is also a member of LCGC Asia Pacific's editorial advisory board. Direct correspondence about this column should go to LCGC Asia Pacific editorinchief, Alasdair Matheson, at Advanstar Communications, 4A Bridgegate Pavilion, Chester Business Park, Wrexham Road, Chester, CH4 9QH, UK, or e-mail amatheson@advanstar.com

Characterizing Plant Polysaccharides Using Size-Exclusion Chromatography
April 4th 2025With green chemistry becoming more standardized, Leena Pitkänen of Aalto University analyzed how useful size-exclusion chromatography (SEC) and asymmetric flow field-flow fractionation (AF4) could be in characterizing plant polysaccharides.
Investigating the Protective Effects of Frankincense Oil on Wound Healing with GC–MS
April 2nd 2025Frankincense essential oil is known for its anti-inflammatory, antioxidant, and therapeutic properties. A recent study investigated the protective effects of the oil in an excision wound model in rats, focusing on oxidative stress reduction, inflammatory cytokine modulation, and caspase-3 regulation; chemical composition of the oil was analyzed using gas chromatography–mass spectrometry (GC–MS).


