Interactive Charts: A Powerful New Tool for Understanding Chromatography Data
The interactive charting capabilities provide chemists with powerful new tools for analysing chromatography data more efficiently.
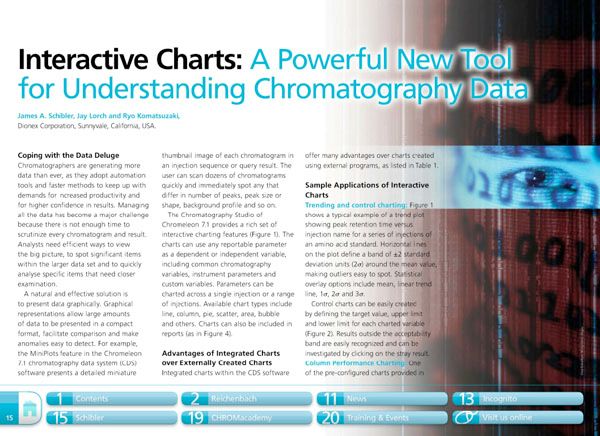
Chromatographers are generating more data than ever, as they adopt automation tools and faster methods to keep up with demands for increased productivity and for higher confidence in results. Managing all the data has become a major challenge because there is not enough time to scrutinize every chromatogram and result. Analysts need efficient ways to view the big picture, to spot significant items within the larger data set and to quickly analyse specific items that need closer examination.
A natural and effective solution is to present data graphically. Graphical representations allow large amounts of data to be presented in a compact format, facilitate comparison and make anomalies easy to detect. For example, the MiniPlots featured in the Chromeleon 7.1 chromatography data system (CDS) software presents a detailed miniature thumbnail image of each chromatogram in an injection sequence or query result. The user can scan dozens of chromatograms quickly and immediately spot any that differ in number of peaks, peak size or shape, background profile and so on.
New Method Explored for the Detection of CECs in Crops Irrigated with Contaminated Water
April 30th 2025This new study presents a validated QuEChERS–LC-MS/MS method for detecting eight persistent, mobile, and toxic substances in escarole, tomatoes, and tomato leaves irrigated with contaminated water.
Accelerating Monoclonal Antibody Quality Control: The Role of LC–MS in Upstream Bioprocessing
This study highlights the promising potential of LC–MS as a powerful tool for mAb quality control within the context of upstream processing.
University of Tasmania Researchers Explore Haloacetic Acid Determiniation in Water with capLC–MS
April 29th 2025Haloacetic acid detection has become important when analyzing drinking and swimming pool water. University of Tasmania researchers have begun applying capillary liquid chromatography as a means of detecting these substances.

.png&w=3840&q=75)

.png&w=3840&q=75)


.png&w=3840&q=75)


.png&w=3840&q=75)


