Initiating Method Development with Scouting Gradients—Where to Begin and How to Proceed?
With so many options for method parameters to adjust during method development, identifying a starting point can be intimidating. Starting with scouting gradients can simplify the process, and yield rich results that inform subsequent method development steps. In this installment, we discuss how to design scouting gradients, how to use the resulting data to make decisions about next steps (including whether to use isocratic or gradient elution), and how to improve the separation once an elution mode has been chosen.
One of the characteristics of the development process for chromatographic methods that I think keeps many chromatographers so engaged in the work is that there are many “knobs to turn.” Of course, modern instruments usually don’t actually have any knobs to turn anymore, but the point is that there are a large number of variables that can influence a chromatographic result. For example, a short list includes column chemistry, particle size, pore size, flow rate, mobile phase pH, temperature, and so on. I think for many chromatographers it is enjoyable to think about the ways in which these variables influence the results. Method development is a puzzle waiting to be solved, some might say. However, the other side of the coin is that with so many variables in play, how does one know where to start, especially in situations where there is time pressure to get the method developed, without the luxury of being able to play with the variables to satisfy our curiosity? In answer to this question, I would highlight two important skills: 1) ability to prioritize the variables that are likely to have the most influence on your chromatographic results; and 2) ability to “fail fast,” to borrow a concept from the business world. There is no point in spending a lot of time fine-tuning a method that is never going to work anyway.
I think the skill of prioritizing variables benefits from equal measures of experience and learning from others. Across the history of this “LC Troubleshooting” column, John Dolan wrote extensively about different aspects of the method development process. There is a lot that can be learned from these articles, even if some of them might seem dated now, because many of the concepts are still useful today. Indeed, in the LC Troubleshooting Bible tag cloud (https://lctsbible.com/lc-troubleshooting-bible/postsbytags/), “method development” is one of the most prominent keywords. A great example of useful reading in this vein is John’s series of seven articles on “The Perfect Method” from 2007 (1,2). Readers interested in a comprehensive resource for development of gradient elution LC methods are referred to Snyder and Dolan’s book on the subject (3).
As for “failing fast,” I think the use of scouting gradients is an incredibly powerful approach. These gradients, if designed properly, can yield rich information that can guide subsequent steps in the development process—either to a successful conclusion, or to the conclusion that the initial parameter choices should be abandoned in favor of trying something else. In this installment of “LC Troubleshooting,” I discuss the concept of scouting gradients, how to design them, and how the information they yield can be used to make decisions about next steps in the development process.
The First Scouting Gradient
The following guidance and discussion is primarily relevant to reversed-phase separations of relatively small molecules (that is, less than 500 Da). In principle, the same ideas can be extended to other separation modes and larger molecules; however, the details would all be different, so we need to save those discussions for a different day.
Designing the Gradient
When working with molecules whose chromatographic behavior is unpredictable or unknown, gradient elution is particularly attractive, because it increases the likelihood that analytes will be both retained to some degree, and eluted from the column during the analysis without being carried over to the next analysis. In other words, it is the closest we can get to a “fool-proof” elution program. Following are considerations for the starting and ending mobile phase compositions used in the first scouting gradient. It is important here to distinguish between %B and ϕ, which are both commonly used to quantify the amount of organic solvent in the mobile phase. ϕ is defined as the volume fraction of organic solvent in the mobile phase on a 0–1 scale. %B is defined as the volume fraction of the B solvent in the mobile phase on a 0–100% scale. If the B solvent is 100% organic solvent, then saying 100% B is the same as saying ϕ = 1. Things get a bit more complicated when B is not 100% organic, and we have to do a little algebra to translate between %B and ϕ.
- Initial composition (ϕi): Since we are discussing reversed-phase separations, we should use as little organic solvent as possible in the mobile phase without causing problems. One problem that could occur here if we use too little organic solvent is “dewetting” of the stationary phase, where the mobile phase is literally expelled from the hydrophobic pores of the stationary phase particles (4). Many sources recommend starting with 5% organic solvent in the mobile phase, which is adequate for many applications. In my lab, we routinely go down to 2% organic solvent without any known problems.
- Final composition (ϕf): At the end of the gradient, we should use as much organic solvent as possible without causing problems. One major concern here is that many buffers in common use for reversed-phase separations are not highly soluble in the organic solvents used for reversed-phase liquid chromatography (RPLC)—for example, acetonitrile. If the buffer salts precipitate from the mobile phase upon mixing with the organic solvent, this can have very serious negative consequences, including ruining pumps and valves. The precipitates can act as abrasives that scratch surfaces, and occlude filters and frits in the mobile phase path. The upper limit of organic solvent concentration that can be used depends on the type (for example, sodium phosphate behaves very differently from ammonium acetate) and concentration of the buffering agents. Readers interested in learning more about these details are referred to a LCGC article on the topic (5). In my laboratory, we try to avoid using more than 70% acetonitrile with phosphate buffers for this reason. When working with mobile phase additives such as formic acid or dilute ammonium acetate, it is possible to go up to 95% acetonitrile.
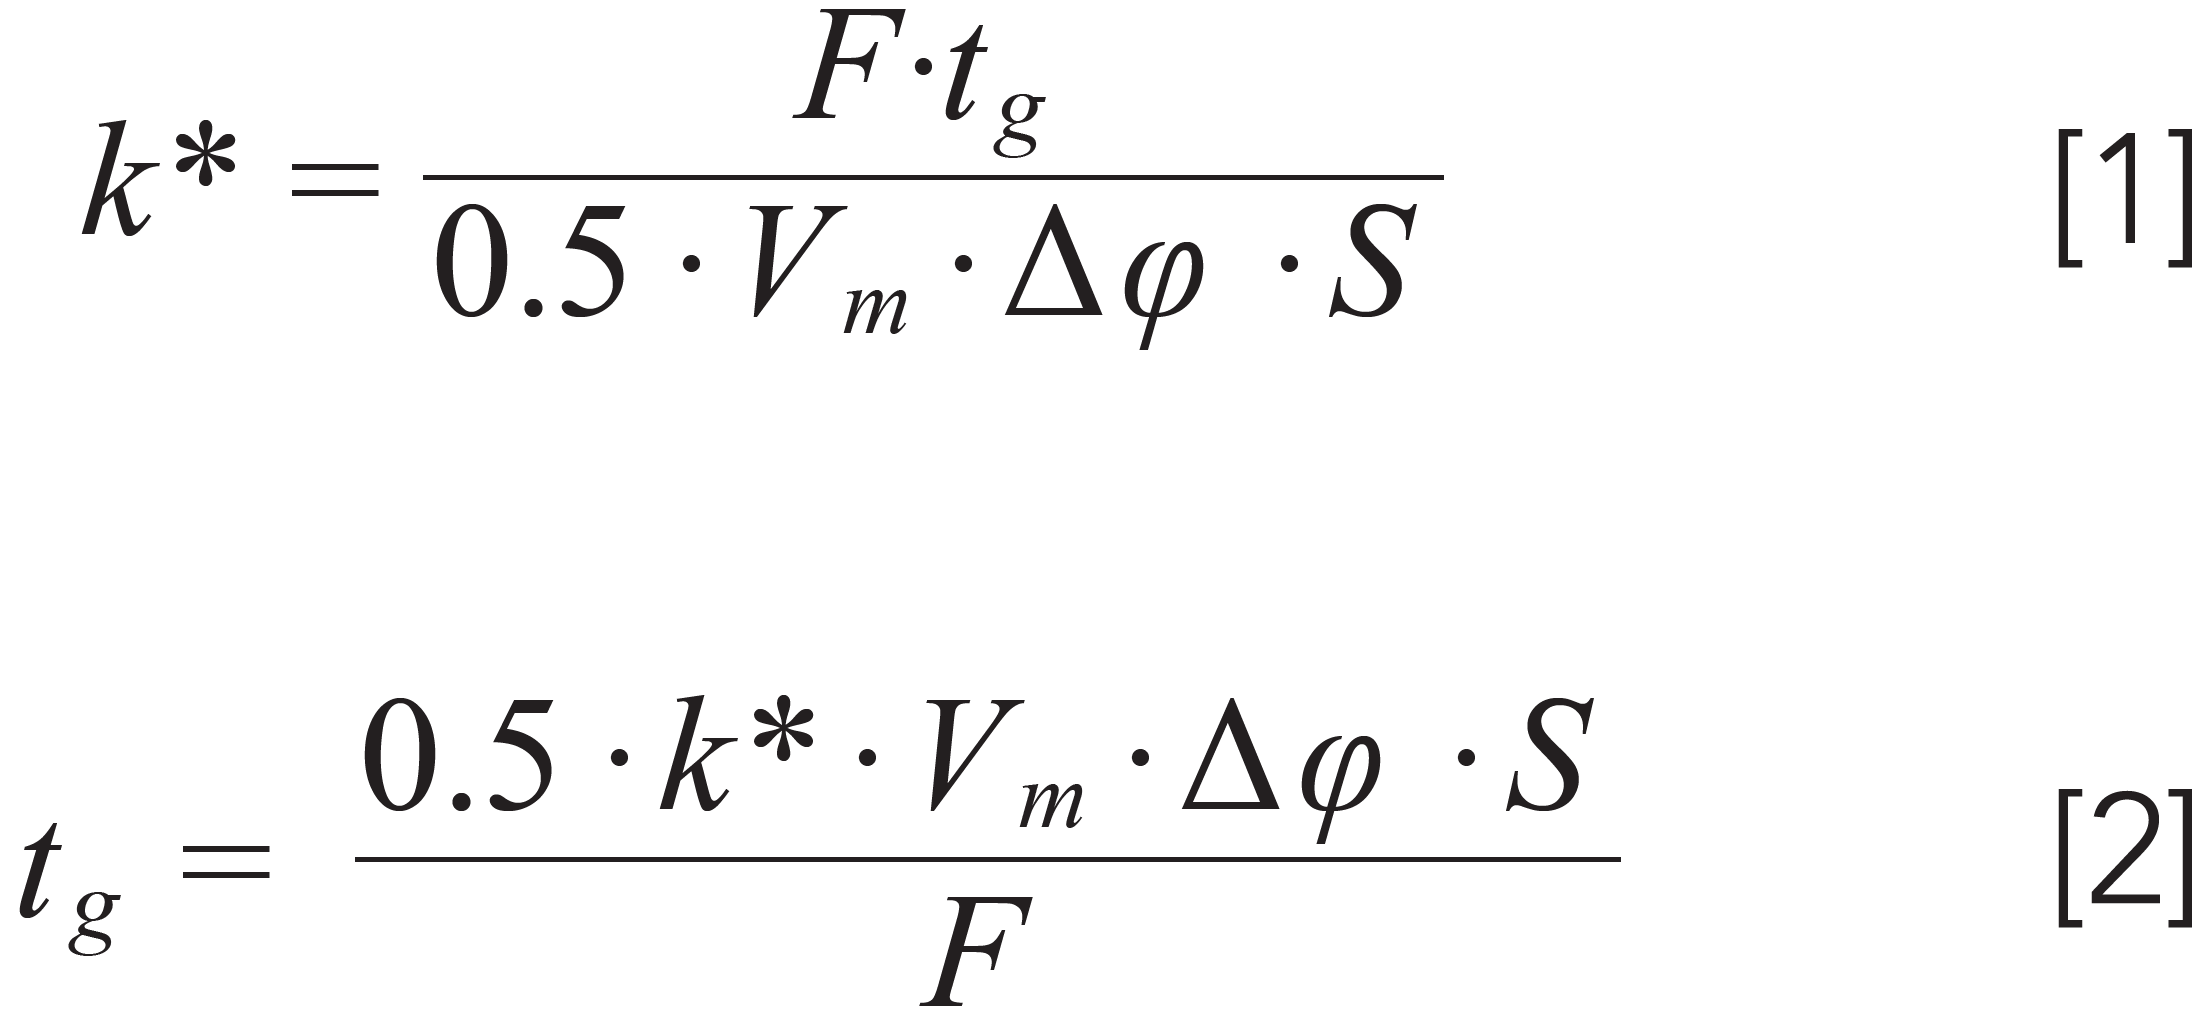
Once the initial and final compositions have been chosen, the only major decision that remains is to choose the gradient time. The bad news here is that the “right” gradient time depends upon several other factors, but the good news is that accounting for these relationships is relatively straightforward. In isocratic elution, the retention factor (k) of an analyte is only dependent on the mobile phase composition (ϕ), and independent of parameters like column length and diameter, flow rate (F), and gradient time (tg). In isocratic elution, we generally try to adjust elution conditions so that retention factors are in the range 2 < k < 10. In gradient elution things are different in the sense that k depends on ϕf and ϕf, column dimensions, F, and tg. However, in developing the scouting gradient we have a similar target for k of around 5. Here, though, we have to use a different type of retention factor, because local retention factor changes as the solvent gradient proceeds through the column. For this purpose we use k*, which is defined as the local retention factor of the analyte when it is reached the midpoint (from inlet to outlet) of the column. The relationship between k* and the other variables is given in Equation 1. Since we are interested in choosing a gradient time for our first scouting gradient, we can rearrange Equation 1 to solve for tg as shown in Equation 2. In these expressions, Δϕ = ϕf -ϕi, and S is the slope of a plot of ln(k) vs. ϕ (from isocratic experiments) (6).

To see how this works, let’s use a 50 mm x 2.1 mm i.d. column as an example, and see what gradient time we come up with for our first scouting gradient. We will use the following input parameters:
- k* = 5; as in isocratic chromatography, we want to aim for something in the range 2 < k < 10.
- Vm = 0.087 mL; this is the column dead volume, which can be estimated using the volume of the empty column (π ∙ r2 ∙ L) times a total porosity of 50%, or calculated using a HPLC simulator (for example, www.multidlc.org/hplcsim)
- Δϕ = 0.75; this is the change in the fraction of organic solvent in a gradient that runs from 5 to 80% B, where the B solvent is 100% organic solvent.
- S =12; this is the slope of ln(k) vs. ϕ for the molecules we are working with. For this calculation, we have to pick a representative value, and the value of 12 is a generally representative number for small molecules.
- F = 0.5 mL/min.; this is the flow rate. Since this is a narrow column (2.1 mm i.d.) this is a modest flow rate.
Using these values, the calculated gradient time is 4 min. Given the relationships in Equation 2, it is easy to see how the gradient time changes when we change some of the parameters. For example, if we double the column length to 100 mm, tg goes to 8 min. If we double the flow rate to 1.0 mL/min., the tg decreases to 2 min.
What Do the Results Tell Us?
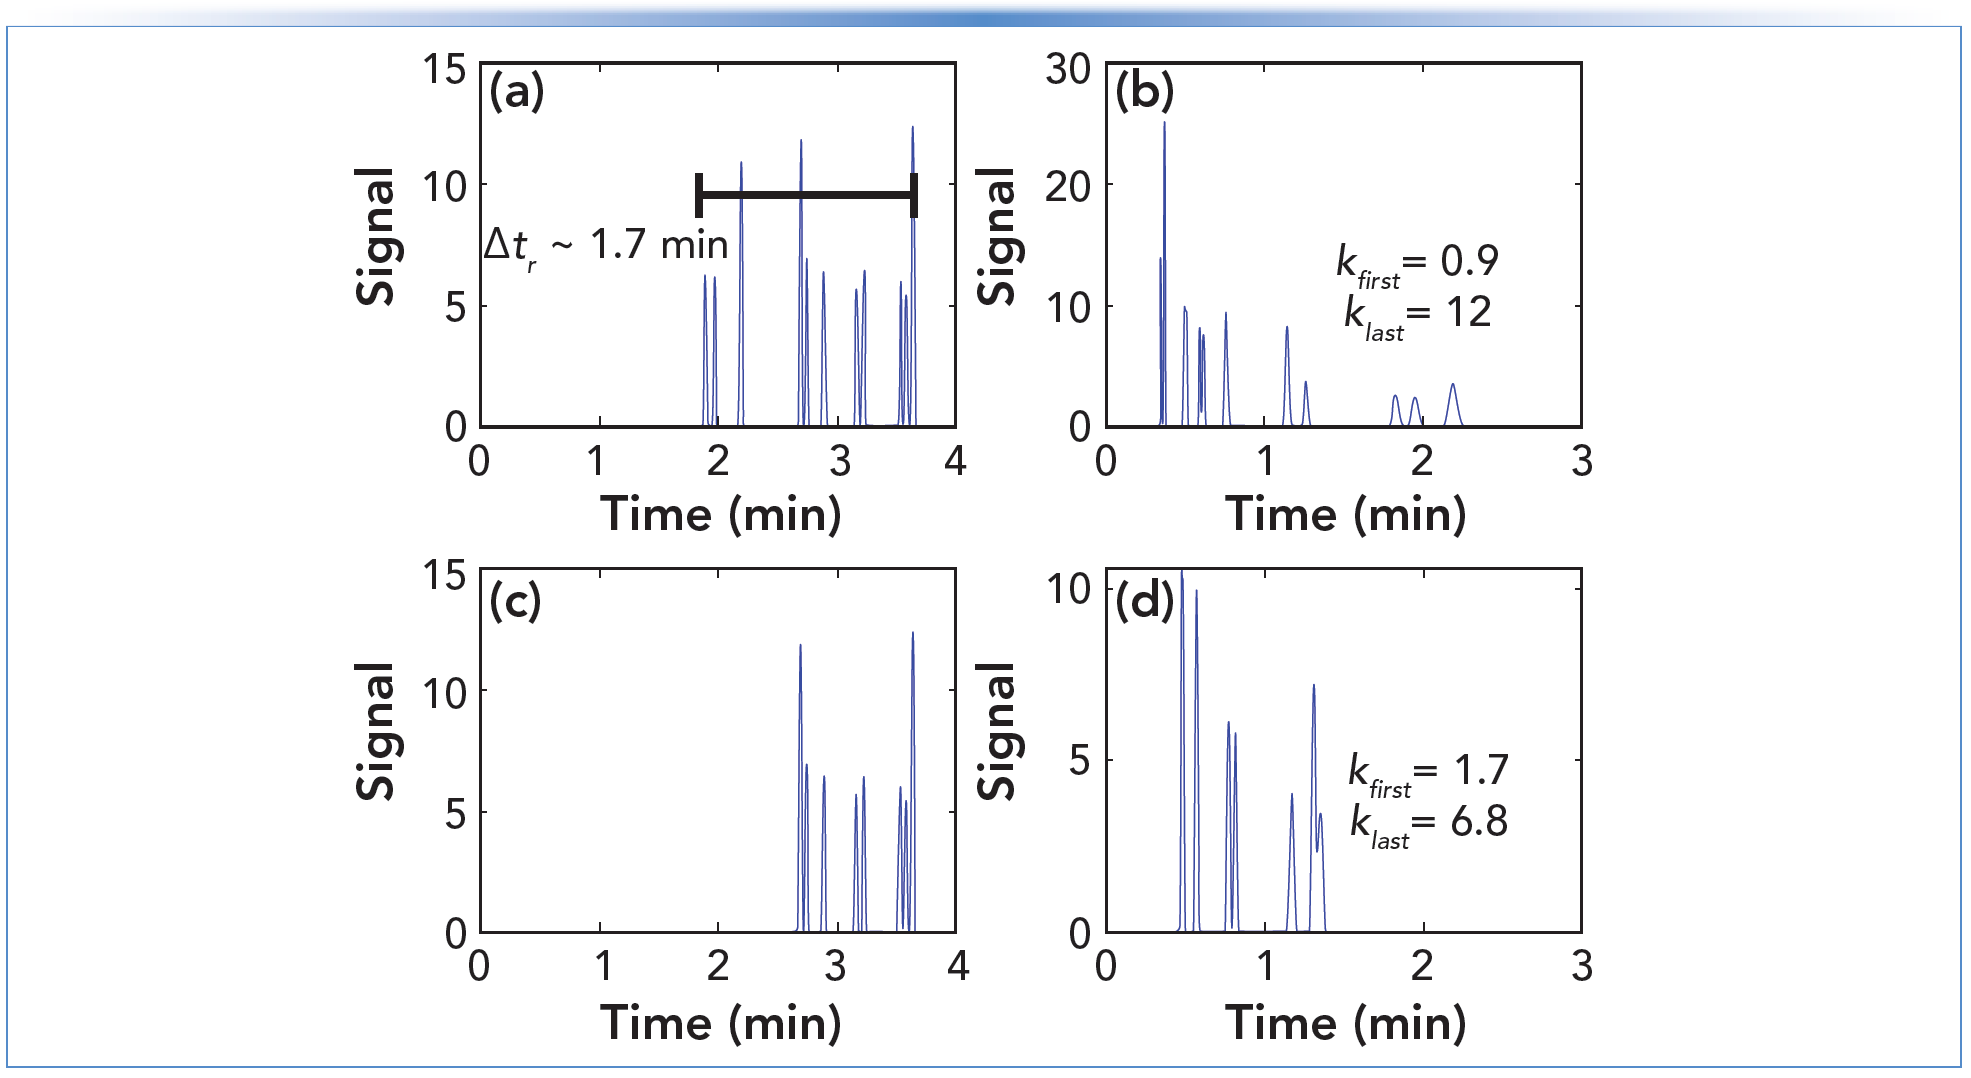
Figure 1 shows two examples of chromatograms we might obtain from such scouting gradients. In Figures 1a and 1c, the scouting gradient conditions are the same (as described above), but the sample mixtures are different. In both cases, the analytes are all small (< 500 Da), representing both neutral and ionogenic molecules that might be encountered in pharmaceutical analysis. In Figure 1a, the analytes are chosen such that they elute over a relatively large fraction of the gradient time. In Figure 1c, the analyte set is restricted such that they are eluted over a narrower range. In Figure 1a, we see that the analytes elute over a span of about 1.7 min, which is 43% of the gradient time of 4 min. Here we can apply Dolan’s “25/40% rule” (7), which says that if the span over which the peaks are eluted is more than 40% of the gradient time, then developing a gradient elution method will likely be most appropriate for the sample. Of course an isocratic method could be developed, but it may have less desirable characteristics than the gradient method. Figure 1b illustrates three of the challenges associated with isocratic methods for samples that span a large fraction of the scouting gradient range. First, the early peaks are eluted at very low k. These peaks will be highly susceptible to extra-column dispersion (8), and may be coeluted with other matrix peaks from the sample that simply “get in the way.” Second, the late peaks elute at very high k. These peaks will be much broader, and thus much lower in height, which may cause trouble with quantitation for low abundance compounds. Such high k values will also translate to very long analysis times when larger volume columns are used.
FIGURE 1: Simulated chromatograms for separations of small molecule mixtures. (a) Full mix–gradient, (b) full mix–isocratic with 48% B, (c) abbreviated mix–gradient, and (d) abbreviated mix–isocratic with 54% B. Chromatographic conditions: column: 50 mm x 2.1 mm i.d. (3.5 micron particles) C18; flow rate: 0.5 mL/min.; temperature: 40 °C. Simulations were performed using freeware (www.multidlc.org/MultiSimLC).

Moving on to Figure 1c, we see that the peaks from the abbreviated analyte mixture elute over a much narrower fraction of the gradient time (24%). Figure 1d shows an isocratic separation of this mixture using a %B that roughly corresponds to the middle of the elution window for those peaks in the scouting gradient. Here we see that the k range is much narrower (1.7 to 6.8), and thus the range of peak heights is not so broad as in Figure 1b. Although there is coelution in the isocratic separation at 54% B, it is very likely that this coelution can be resolved through slight adjustment of the mobile phase without dramatically increasing the analysis time (9). This mixture is much more amenable to analysis under isocratic conditions (as would be suggested by the 25/40% rule).
Generally speaking, isocratic methods are preferred over gradient methods for small molecules when they provide the separation needed in a reasonable time. Isocratic methods tend to be more robust, can be implemented with a wider range of instrumentation, and are easier to transfer between instruments.
The Second Scouting Gradient
The first scouting gradient can tell us a lot about the number of compounds in the sample, the chemical diversity of those compounds (as measured by the range over which they elute), and whether or not we should proceed by aiming for a isocratic or gradient elution method. However, doing a second scouting gradient adds additional power to our method development strategy, because it enables us to build a model of the dependence of the retention of our compounds on many of the variables we discussed above, including column dimensions, flow rate, and mobile phase composition.
Designing the Gradient
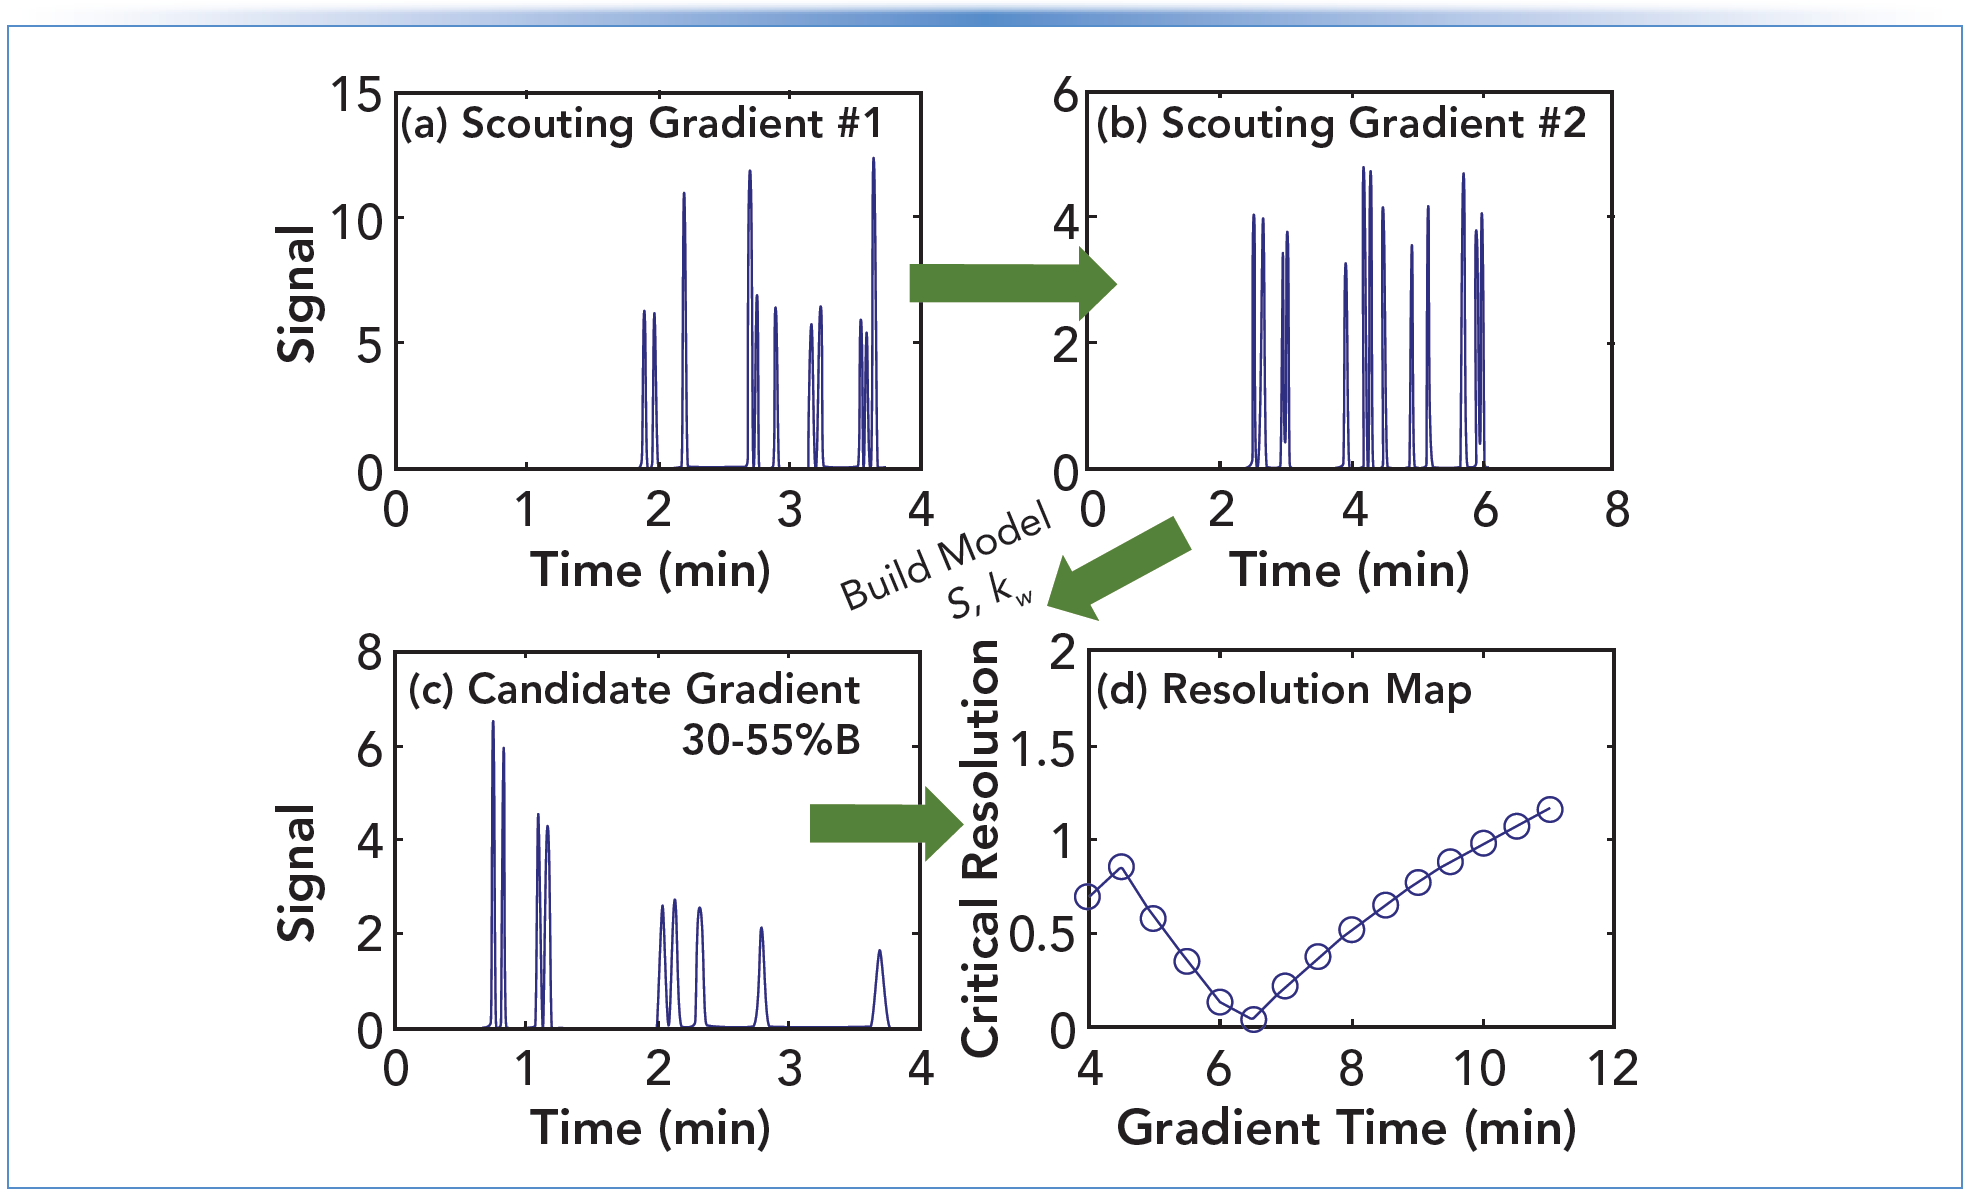
Once we have chosen the conditions for the first scouting gradient, choosing the second one is much simpler. In short, we just need to change one of the parameters that affects retention time under gradient elution conditions. This could include the column's dimensions, or the starting or ending points in the gradient (that is, ϕf and/or ϕi), but it is most common by far to change the gradient time. The big question is “How much of a change is enough?” In our first scouting gradient, we used a gradient time of 4 min. A typical approach would be to increase the gradient time threefold in the second scouting gradient, to 12 min. In a recent research paper (10), we pushed on this question a bit and explored the consequences of significantly varying the factor by which the gradient time is varied from as low as 1.5-fold to as much as 18-fold. To make a very long story short, we found that only modest fold increases in the gradient time are needed to build useful models, so long as the models are not used very far outside of the range of the data used to build model. In the example shown in Figure 2, I’ve used a gradient time of 8 min for the second scouting gradient. This reduces the time needed for the second gradient while maintaining a reasonable scope of applicability for the model.
FIGURE 2: Simulated gradient elution separations. (a) Scouting gradient #1, (b) scouting gradient #2, (c) predicted gradient based on a model building using data from the scouting gradients with 30–55% B, (d) resolution map for separations with a gradient of 30-55% B and different gradient times. All other conditions are as in Figure 1.

What Do the Results Tell Us?
Figures 2a and 2b show the chromatograms from the first and second scouting gradients we’ve designed here. The retention times for each compound in these two chromatograms can be fit to a retention model using linear solvent strength (LSS) theory (or other non-linear models) to obtain the retention parameters S and kw for each compound. With these in hand, one can then predict an expected chromatogram for any elution conditions. An example of such a prediction is shown in Figure 2c, where I’ve adjusted the starting mobile phase composition to 30% B and flattened the gradient to end at 55% B, which enables spreading the peaks across more of the gradient time. Since we get the retention times of all compounds from each prediction like this, we can also calculate the smallest resolution of any pair of neighboring peaks in the chromatogram—we call this the critical resolution. Then, by changing a variable such as the gradient time, and calculating the critical resolution for each prediction, we can construct a resolution map as shown in Figure 2d. This shows us that if we are happy with a minimum resolution of 0.9, then we can choose a gradient time of 4.5 min, and we are done with method development. However, if we want more resolution for the least resolved pair of peaks, then we need to go to longer gradient times, or change one or more other variables. This process of carrying out scouting gradients and then building resolution maps is what Snyder and Dolan and coworkers started with in 1989 when they introduced DryLab for computer-driven method development (11,12), and this is still the principal process used by modern commercial method development packages in use today. The resolution map in Figure 2d shows the dependence of critical resolution on the single variable gradient time. Contemporary software provides multidimensional resolution maps that enable exploration of multiple variables (for example, gradient time and temperature) simultaneously.
Summary
Choosing a starting point for method development can be intimidating because there are so many possible places to start. Scouting gradients provide a simple, relatively fool-proof starting point. The chromatogram from a single scouting gradient can help make the decision about whether to proceed with development of an isocratic method, or if a gradient elution method is required to accommodate more diverse mixtures. The results from a second scouting gradient can be used to build a retention model that can in turn be used to predict separations with variations in gradient time and the mobile phase compositions used at the starting and ending points in the gradient. The concepts discussed here are the basic foundation of approaches and software used for modern method development. Understanding these foundational ideas is the first step toward more advanced approaches and more streamlined and effective method development workflows.
References
(1) Dolan, J. The Perfect Method, Part I: What Is Your Goal? LCGC North Am. 2007, 25 (6), 546–552.
(2) Dolan, J. The Perfect Method, Part VII: The Gradient Shortcut. LCGC North Am. 2007, 25 (12), 1178–1182.
(3) Snyder, L. R.; Dolan, J. W. High-Performance Gradient Elution: The Practical Application of the Linear-Solvent-Strength Model; John Wiley, 2007.
(4) Stoll, D. R. Reversed-Phase Liquid Chromatography and Water, Part I: How Much Is Too Much? LCGC North Am. 2019, 37 (2), 80–90.
(5) Schellinger, A. P.; Carr, P. W. Solubility of Buffers in Aqueous–Organic Eluents for Reversed-Phase Liquid Chromatography. LCGC North Am. 2004, 22 (6), 544–548.
(6) Snyder, L. R.; Dolan, J. W. High-Performance Gradient Elution: The Practical Application of the Linear-Solvent-Strength Model; John Wiley, 2007; pp 370–404.
(7) Dolan, J. Making the Most of a Gradient Scouting Run. LCGC North Am. 2013, 31 (1), 30–35.
(8) Broeckhoven, K.; Stoll, D. R. But Why Doesn’t It Get Better? Kinetic Plots for LC, Part I – Basic Concepts. LCGC North Am. 2022, 40 (1), 9–12, 19. DOI: 10.56530/lcgc. na.sm2490k6
(9) Stoll, D. R. What Are Options to Improve My Separation? Part II: Likelihood of Separation, Adjusting Selectivity for Simple Mixtures. LCGC North Am. 2023, 41 (2), 44–49,62. DOI: 10.56530/lcgc.na.qz2990k6
(10) den Uijl, M. J.; Schoenmakers, P. J.; Schulte, G. K.; Stoll, D. R.; van Bommel, M. R.; Pirok, B. W. J. Measuring and Using Scanning-Gradient Data for Use in Method Optimization for Liquid Chromatography. J. Chromatogr. A 2021, 1636, 461780. DOI: 10.1016/j.chroma.2020.461780
(11) Dolan, J. W.; Lommen, D.; Snyder, L. R. DryLab Computer Simulation for High- Performance Liquid Chromatographic Method Development: II. Gradient Elution. J. Chromatogr. A 1989, 485, 91–112. DOI: 10.1016/s0021-9673(01)89134-2
(12) Snyder, L. R.; Dolan, J. W.; Lommen, D. C. Drylab Computer Simulation for High- Performance Liquid Chromatographic Method Development: I. Isocratic Elution J. Chromatogr. A 1989, 485, 65–89. DOI: 10.1016/S0021-9673(01)89133-0
ABOUT THE COLUMN EDITOR
Dwight R. Stoll is the editor of “LC Troubleshooting.” Stoll is a professor and the co-chair of chemistry at Gustavus Adolphus College in St. Peter, Minnesota. His primary research focus is on the development of 2D-LC for both targeted and untargeted analyses. He has authored or coauthored more than 75 peer-reviewed publications and four book chapters in separation science and more than 100 conference presentations. He is also a member of LCGC’s editorial advisory board. Direct correspondence to: LCGCedit@mmhgroup.com


Polysorbate Quantification and Degradation Analysis via LC and Charged Aerosol Detection
April 9th 2025Scientists from ThermoFisher Scientific published a review article in the Journal of Chromatography A that provided an overview of HPLC analysis using charged aerosol detection can help with polysorbate quantification.
Removing Double-Stranded RNA Impurities Using Chromatography
April 8th 2025Researchers from Agency for Science, Technology and Research in Singapore recently published a review article exploring how chromatography can be used to remove double-stranded RNA impurities during mRNA therapeutics production.


