The Impact of Superficially Porous Particles and New Stationary-Phase Chemistries on the LC–MS Determination of Mycotoxins in Food and Feed
Special Issues
Superficially porous particles with their favorable chromatographic properties were a great advance for liquid chromatography. The speed they enable is exemplified by a LC–MS method of analysis for four mycotoxins, spanning log P values from -0.7 to 3.6, with an analysis time of just over 8 min and excellent performance. Another issue is the separation of closely related mycotoxins, like 3- and 15-acetyldeoxynivalenol. With the common C18 chemistries they coelute and identification and quantification can only be achieved through differing MS-MS signals. Now, with the newer pentafluorophenyl chemistries these two mycotoxins can be separated by LC and MS quantification of them has become much more precise.
Superficially porous particles with their favorable chromatographic properties were a great advance for liquid chromatography (LC). Analytical LC columns packed with those particles allow for much faster separations even with standard LC equipment rated at a maximum pressure of 400 bar. This speed is exemplified by a LC–mass spectrometry (MS) method of analysis for four mycotoxins, spanning log P values from -0.7 to 3.6, with an analysis time of just over 8 min and excellent performance. Another issue is the separation of closely related mycotoxins, like 3- and 15-acetyldeoxynivalenol. With the common C18 chemistries, they are coeluted and identification and quantification can only be achieved through differing MS-MS signals. Now, with the newer pentafluorophenyl chemistries these two mycotoxins can be separated by LC and MS quantification of them has become much more precise.
In 2006, high performance liquid chromatography (HPLC) columns packed with superficially porous particles (SPP) (also known as porous-shell, core–shell, and solid-core particles) were introduced to the market. In performance rivaling sub-2-µm technology, SPP packed columns have enabled highly efficient separations to be carried out with standard HPLC systems because of the much lower back pressure they generate (1). This favorable characteristic has also been exploited for the determination of mycotoxins in food and feed.
Mycotoxins are secondary metabolites of certain fungi whose occurrence in food and feed is difficult to avoid. Therefore, many countries have regulated this occurrence of mycotoxins (2,3). A wealth of methods of analysis to enforce these regulations exist (4) and among them liquid chromatography–mass spectrometry (LC–MS)-based detection is gaining momentum. LC–MS is primarily gaining momentum for two reasons: sample preparation requirements can be relaxed because of the high specificity and sensitivity of MS detection, and multiple mycotoxins can be determined in one go. Both of these reasons are of particular interest to official control laboratories since they will lead to higher throughput compared to traditional one analyte per preparation and run approaches with extensive cleanup. This higher throughput has been shown for traditional HPLC equipment with an analytical column packed with fully porous particles by Biselli and colleagues (5). Using a 150 mm x 2.1 mm column with 3-µm particles at 1-mL/min flow, 18 mycotoxins could be detected during a 15-min analytical run. With those settings, deoxynivalenol (DON) eluted at 3.80 min and zearalenone (ZON) at 7.38 min. To stay within the operational envelope of their electrospray ionization (ESI) source the column effluent was split 1:5. Using a sub-2-µm fully porous particle packed column of 100 mm x 2.1 mm dimensions, Varga and colleagues (6) were able to show a multimycotoxin separation in which DON eluted at 1.45 min and ZON at 6.44 min with a total run time of 11.5 min. To perform this separation, an ultrahigh-pressure liquid chromatography (UHPLC) system capable of delivering flows at pressures as high as 1200 bar was used.
With the desire to determine multiple mycotoxins in one run, the necessity arose to be able to separate closely related mycotoxins. One such example would be DON and its two acetylated relatives, 3- and 15-acetyldeoxynivalenol (AcDON). Although DON can be separated from the two AcDONs on a C
18
column, the two AcDONs are coeluted. Because of different fragmentation behavior it is still possible to obtain individual quantitative data using MS-MS detection, but with lesser confidence than with a full chromatographic separation (5). A more recent stationary phase chemistry capable of separating such isomers is the so-called pentafluorophenyl (PFP, F5) modified silica. The pentafluorphenyl system is electron deficient and can interact with the analyte in multiple ways: π-π, dipole-dipole, and charge-transfer interactions. Because of these multiple interactions, structural isomers can often be separated.
This article presents a fit-for-purpose LC–MS-based method of analysis for the four mycotoxins DON, HT-2 toxin, T-2 toxin, and ZON utilizing standard HPLC equipment with an SPP column. Performance characteristics in unprocessed cereals, as determined in-house and verified through a collaborative trial, were in line with traditional single analyte methods with a short analysis time of under 9 min. The article also shows how the F5 stationary phase chemistry enables the separation of the closely related mycotoxins 3- and 15-acetyldeoxynivalenol.
Experimental
Chemicals and Materials
All chemicals were purchased from either Sigma-Aldrich or VWR and were of at least analytical grade. For the mobile phase LC–MS Chromasolv-grade (Fluka, Sigma-Aldrich) water and methanol were used. Deionized water was generated by a MilliQ system (Millipore). All tested materials came from the material pool of the European Union Reference Laboratory (EURL) for mycotoxins at the Institute for Reference Materials and Measurements (IRMM) of the Joint Research Centres (JRC) of the European Commission (EC).
The mycotoxins DON, HT-2, T-2, ZON, 3-AcDON, and 15-AcDON, and the isotopologues 13C15-DON, 13C22-HT2, 13C24-T2, and 13C18-ZON were purchased from Biopure (Romer Labs) as either solids or ready-to-use solutions. From these, a stock solution of 3.2-µg/mL DON, 0.5-µg/mL HT-2 toxin, 0.3-µg/mL T-2 toxin, and 0.3-µg/mL ZON in neat acetonitrile was prepared and stored. This stock solution was freshly diluted for every calibration task. An internal standard solution with the same concentrations of the respective 13C-isotopologues in neat acetonitrile was also prepared and used undiluted. These solutions were stable for at least three months in the dark at 2–8 °C.
Equipment
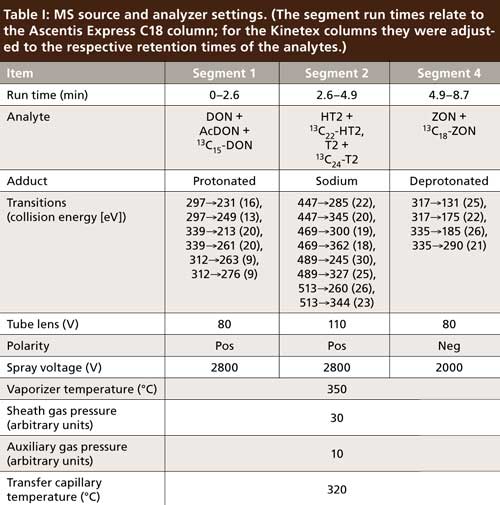
Measurements were performed on an LC–MS system consisting of two LCâ20AD pumps (Shimadzu, high-pressure binary gradient), an Accela autosampler (Thermo Scientific), and a TSQ Quantum Ultra triple-quadrupole mass spectrometer with an IonMax HESI2 interface (both Thermo Scientific). For analytical columns either an Ascentis Express C18 (75 mm x 2.1 mm, 2.7-μm particle size, Supelco, Sigma-Aldrich), a Kinetex C18, or a Kinetex PFP (both 100 mm x 2.1 mm, 2.6-μm particle size, Phenomenex) were used. The gradient conditions with the Ascentis Express C18 column were as follows: 0 min, 8% B; 2 min, 57% B; 6 min, 61% B; 6.1 min, 95% B; 7.6 min, 95% B; 7.7 min, 8% B; 8.7 min, 8% B with mobile-phase A consisting of 999:1 (v/v) water–formic acid and mobile-phase B consisting of 999:1 (v/v) methanol–formic acid at a flow rate of 0.3 mL/min. The column was maintained at 40 °C during analysis. This nonintuitive gradient was designed with optimal resolution and shortest analysis time for just the four mycotoxins in mind. For the two Kinetex columns more-generic gradient conditions were used: 0 min, 8% B; 8 min, 95% B; 8.1 min, 8% B; 10 min, 8% B at a column temperature of 50 °C. The mobile phases and flow rate were as stated above. The MS system settings can be found in Table I. The data acquisition was segmented to limit the number of acquired transitions and enable longer dwell times per segment.
Sample Preparation
In an appropriately sized tube, 2 g of unprocessed cereal (comminuted to <500 µm particle size) was fully suspended in 8 mL of water. Then 16 mL of ethyl acetate was added and after a brief, hard shake the mixture was sonicated for 30 min. After sonication 8 g of sodium sulfate was added. The mixture was again shaken hard and then left for 10 to 20 min to allow the sodium sulfate to crystallize. To settle particulate matter and aid phase separation the tube was centrifuged at a relative centrifugal force of 3000g for at least 1 min. Next, 500 µL of clear supernatant was transferred to a silylated autosampler vial (2 mL, Supelco, Sigma-Aldrich), 25 µL of internal standard mix was added, and the contents of the vial were evaporated to dryness with a stream of dry nitrogen (boil-off) at 60 °C. The dry residue was reconstituted with 250 µL of mobile-phase B and 250 µL of mobile-phase A, in that order. Initial reconstitution with the pure organic mobile phase significantly improved the dissolution of the more hydrophobic analytes. Finally, 5 µL of this solution was injected without further treatment. Turbidity of the injection solutions, often seen in these reconstituted extracts, did not negatively affect column lifetime in our experience.
Method Validation
To validate the method, the cereals maize, wheat, oat, and rice but also soy and a cereal-based compound feed were investigated. Among the characteristics determined were matrix effects, method recovery, repeatability, and intermediate precision. For matrix effect and method recovery determination, different amounts of the analytes were spiked into materials free of the analytes before extraction (set A) and after extraction of the analyte-free materials (set B). After regression, analysis of the slopes of the signals of the sets A and B were then compared with the slopes of a calibration done in neat solvent (set C). Comparing slopes A and C indicated method recovery, while comparing slopes B and C determined the extent of matrix effects (7). For repeatability and intermediate precision, naturally contaminated cereal mixes were prepared and measured 20 times on the same day (repeatability) and once each on a total of eight days by three different operators (intermediate precision). A detailed validation report is available on-line (8). The method was then further validated through a collaborative trial (9). Currently, this method and the results of the collaborative trial are in the process of being published by the European committee for standardization (CEN).
Results and Discussion
The performance characteristics of this method are very satisfactory. Matrix effects that can have a significant influence on results in LC–MS were found to be negligible for all four analytes in all six tested materials. The absence of significant matrix effects allows for the use of calibration solutions in neat solvent. This can be attributed to the use of the stable isotopologues. To keep the total usage of isotopologues low, and with that the expense per test, they were added after extraction to only an aliquot of the extract. So instead of having to add the equivalent of 2 g of test material, only the equivalent of 0.125 g had to be spiked. Because this setup does not account for any loss of analytes during extraction, method recovery had to be determined. In this context, method recovery equals extraction efficiency, which has shown to be stable for a given extraction solvent–analyte system across different cereal matrices.
The HT-2, T-2, and ZON recoveries in all six test materials were not significantly different from 1. Only DON with an average recovery of 0.83 was different. This is not very surprising given that the log P of DON is -0.7 and ethyl acetate is not the most polar solvent; however, this method recovery is well within the commonly accepted ranges. Compared to more-traditional acetonitrile–water extracts, the ethyl acetate extracts seemed to cause, in general, less of a matrix effect for the analysis of these four mycotoxins. It is also less hazardous and expensive than acetonitrile.
Repeatability was determined with naturally contaminated materials at three different contamination levels. Near the low end of the calibration range, the relative repeatability standard deviations (RSDr) were between 11% and 18% for the four analytes. Toward higher contamination levels, which were smaller than existing (DON and ZON) or anticipated (HT-2 and T-2) legislative limits in the European Union (EU), these values improved to ≤9%. Two of those materials, the lowest and the highest contaminated, were also tested on eight different days by three different operators to determine intermediate precision, or within laboratory reproducibility. For the low contaminated material relative intermediate precisions (RSDi) were between 13% and 25% for the four analytes. For the high contaminated material they were between 11% and 17%. All of these findings were comparable with the results of the collaborative trial (9).
As already mentioned, these performance characteristics are quite satisfactory considering the analysis time is only 8.7 min. This is significantly shorter than the analysis times reported by Biselli (5) or Varga (6). Figure 1 shows a typical chromatogram of the four analytes, which span log P values from -0.7 (DON) to 3.6 (ZON). The narrow peaks with a baseline width of ≤0.2 min attest to the high efficiency of the SPP particles packed in a 75-mm column. Even though a mobile phase with methanol–water was used, the back pressure during analysis never exceeded 230 bar, which is well below the maximum pressure of standard HPLC equipment. Compared to this, analysis time of the same material in a different laboratory during the collaborative trial on a 150-mm column packed with fully porous particles takes more than twice as long (20 min) with larger baseline peak widths between 0.4 and 0.9 min (Figure 2). Thus, the SPP column provides superior resolution at shorter analysis times.
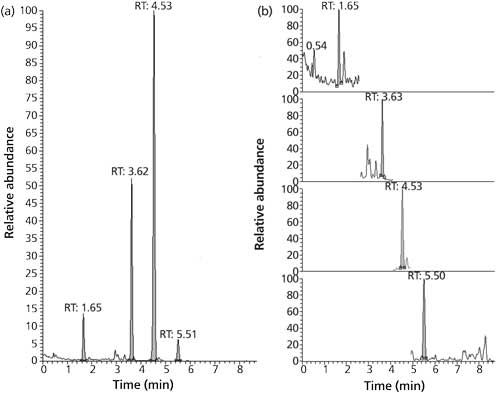
Figure 1: (a) A total ion current chromatogram and (b) extracted ion current chromatograms (top to bottom: DON, HT-2, T-2, ZON) of a QC sample with circa 90-µg/kg DON (RT 1.65), 30-µg/kg HT-2 toxin (RT 3.62), 10-µg/kg T-2 toxin (RT 4.53), and 10-µg/kg ZON (RT 5.51); the peak areas in (a) are mostly representing the 13C-labeled isotopologues.
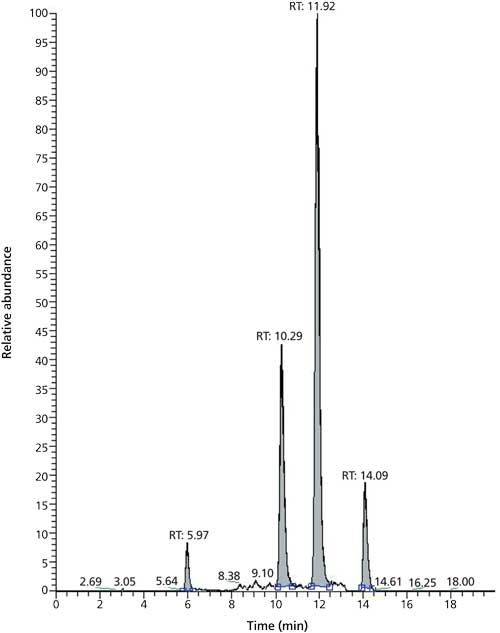
Figure 2: Total ion current of the same QC sample as in Figure 1. Run times: DON, 5.97 min; HT-2, 10.29 min; T-2, 11.92 min; ZON, 14.09 min. Column: 150 mm × 2 mm, 4-µm dp Synergi Hydro-RP (Phenomenex).
The benefits of short analysis times are obvious: higher throughput and lower solvent consumption. Benefits of the better resolution might not be so obvious. Matrix effects in LC–MS measurements influence ionization efficiency caused by, amongst other things, coeluted compounds. Because of the high specificity of MS, particularly MS-MS, coeluted compounds, more likely than not, will be undetected. Better resolution will limit possible coelution and, therefore, minimize influences on ionization efficiencies and maximize the ability of unbiased determination. Furthermore, in our case, the better resolution comes from narrower and, hence, taller peaks, which has a positive effect on limit of detection and quantification.
To show how a stationary phase chemistry change helps in obtaining better and more confident results, a maize sample highly contaminated with DON, AcDONs, and ZON was analyzed with two columns with identical SPPs but different chemistries, namely the Kinetex C18 and PFP columns. Figure 3 shows the two total ion chromatograms (TICs). Even though the two AcDONs were not separated with the C18 chemistry, they were with the PFP chemistry. Retention for all analytes was slightly higher on the PFP column. Because of the different fragmentation behavior of the two AcDONs in MS-MS the contamination level of the individual AcDONs can be estimated even from peaks 2 and 3 in Figure 3b. But because of significant overlap of the product ions, this estimation comes with an increased uncertainty. It goes without saying that a separation as shown in Figure 3a is absolutely preferable.
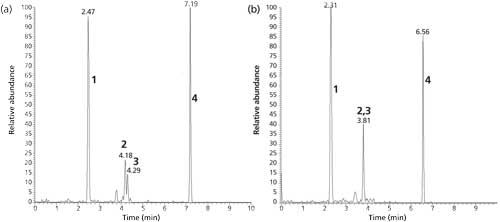
Figure 3: Total ion current of a maize sample highly contaminated with DON, AcDONs, and ZON; sample extract was diluted eight times; separation with (a) Kinetex PFP and (b) Kinetex C18 columns; Peaks: 1 = DON, 2 = 15-AcDON, 3 = 3-AcDON, 4 = ZON.
Conclusions
Through the use of an SPP packed column, a short method of analysis for four mycotoxins in cereals was developed that is fit for the purpose of official food and feed control. The total run time was 8.7 min for the mycotoxins DON, HT-2, T-2, and ZON spanning log P values from -0.7 to 3.6. Despite the short run time, excellent resolution was obtained with very satisfactory performance characteristics. Method recoveries were indistinguishable from 1 for HT-2, T-2, and ZON. For DON a recovery of 0.83 was determined and results for DON should be corrected for this recovery level. Values of RSDr were 18% or smaller for low contamination levels and improved to 9% or smaller toward higher levels, which were still below existing or anticipated EU legislative limits. Because of the intelligent use of stable isotopologues, matrix effects were negligible at a minimal cost per sample.
Changing the stationary-phase chemistry from C18 to pentafluorophenyl enabled the separation of the structural isomers 3- and 15-acetyldeoxynivalenol as well as DON and ZON in a naturally contaminated maize sample. This stands to show that SPP-packed columns and new stationary-phase chemistries have advanced mycotoxin analysis in food and feed.
Acknowledgments
The author would like to thank Katrien Bouten, Kati Kröger, and Karsten Mischke for their excellent technical support during method validation and the collaborative study. The highly contaminated maize was a courtesy of the Austrian National Reference Laboratory for mycotoxins (AGES, Linz, Austria).
Disclaimer
Any trade names, trademarks, product names, and suppliers named above are only named for the convenience of the reader of this publication and their mentioning does not constitute an endorsement by IRMM, JRC, or EC of the products named. Equivalent products may lead to the same results.
References
- J.J. Kirkland, S.A. Schuster, W.L. Johnson, and B.E. Boyes, J. Pharm. Anal.3(5), 303–312 (2013).
- Food Quality and Standards Service (ESNS). Worldwide regulations for mycotoxins in food and feed in 2003. 2004; Available from: http://www.fao.org/docrep/007/y5499e/y5499e00.htm.
- European Commission, Commission Regulation (EC) No 1881/2006 of 19 December 2006 setting maximum levels for certain contaminants in foodstuffs (Text with EEA relevance). Official Journal of the European Union, 2006. L 364: p. 5–24.
- F. Berthiller et al., World Mycotoxin J. 8(1), 5–35 (2015).
- S. Biselli, L. Hartig, H. Wegner, and C. Hummert, LCGC Europe Special Edition: Recent Applications in LC–MS17(11a), 25–31 (2004).
- E. Varga et al., Anal. Bioanal. Chem.402(9), 2675–2686 (2012).
- B.K. Matuszewski, J. Chromatogr. B830(2), 293–300 (2006).
- A. Breidbach, Validation of an Analytical Method for the Simultaneous Determination of Deoxynivalenol, Zearalenone, T-2 and HT-2 Toxins in Unprocessed Cereals - Validation Report. 2011; Available from: http://skp.jrc.cec.eu.int/skp/download?documentId=51161.
- A. Breidbach, K. Bouten, K. Kröger, J. Stroka, and F. Ulberth, LC–MS Based Method of Analysis for the Simultaneous Determination of Four Mycotoxins in Cereals and Feed: Results of a Collaborative Study (Publications Office of the European Union, 2013). Available at: http://publications.jrc.ec.europa.eu/repository/bitstream/JRC80176/la-na-25853-en-n.pdf.
Andreas Breidbach is with the European Commission, Joint Research Centre, at the Institute for Reference Materials and Measurements in Geel, Belgium. Direct correspondence to: andreas.breidbach@ec.europa.eu
New Study Reviews Chromatography Methods for Flavonoid Analysis
April 21st 2025Flavonoids are widely used metabolites that carry out various functions in different industries, such as food and cosmetics. Detecting, separating, and quantifying them in fruit species can be a complicated process.
Analytical Challenges in Measuring Migration from Food Contact Materials
November 2nd 2015Food contact materials contain low molecular weight additives and processing aids which can migrate into foods leading to trace levels of contamination. Food safety is ensured through regulations, comprising compositional controls and migration limits, which present a significant analytical challenge to the food industry to ensure compliance and demonstrate due diligence. Of the various analytical approaches, LC-MS/MS has proved to be an essential tool in monitoring migration of target compounds into foods, and more sophisticated approaches such as LC-high resolution MS (Orbitrap) are being increasingly used for untargeted analysis to monitor non-intentionally added substances. This podcast will provide an overview to this area, illustrated with various applications showing current approaches being employed.

.png&w=3840&q=75)

.png&w=3840&q=75)


.png&w=3840&q=75)


.png&w=3840&q=75)


