How Much Sample Can I Put on My GC Column?
Good chromatography begins with determining the correct amount of analyte to inject onto the column. There are two types of overload: mass and volume. Mass overload displaces the peak, which shifts the retention time, with the front half sloping and the second half perpendicular to the x-axis. Volume overload results in symmetrical peaks with widths increasing by 10%. Both conditions can compromise the resolution of closely eluting compound pairs, interfering with identification and quantification. Capacity is the maximum amount of sample before peak distortion occurs, and is directly proportional to film thickness, column length, column internal diameter, and phase solute compatibility. Mathematical approaches to calculate peak capacity have difficulty determining the solubility of specific analytes in stationary phases. Here we will take an empirical approach and examine concentrations for a wide range of compound polarities on several stationary phases, and determine overload as measured by symmetry.
A common question gas chromatographers ask is: “How much sample can I put on my column?” Many of us refer to Dean Rood’s book, A Practical Guide to the Care, Maintenance, and Troubleshooting of Capillary Gas Chromatographic Systems as a good starting point, since his work is the result of over 15,000 customer inquiries. On page 44 is a table of typical column capacities, and that information has found its way into many seminars over the years (1). There are times when we recommend a range, and the feedback is that our estimate was not even close. Jaap de Zeeuw references “loadability” with different film thicknesses on a 0.32 mm internal diameter (i.d.) column presenting a broader estimate of 2 ng on‑column to 7500 ng on-column (2), whereas Dean Rood’s estimate is 30 ng on-column to 1500 ng on-column. Both estimates consider that the amount that can be injected onto a column is directly related to the amount of stationary phase. One way to get more sample on-column and maintain Gaussian peak shapes is the use of a larger column internal diameter and a thicker film (3). Saturation of the mobile and stationary phase results in overloading effects, which are commonly seen as distorted peak shapes and are categorized as volume and mass overload. Volume overload leads to broader peak shapes, which may remain symmetrical, whereas mass overload is the saturation of the stationary phase and will be our main focus.
Experimental Design
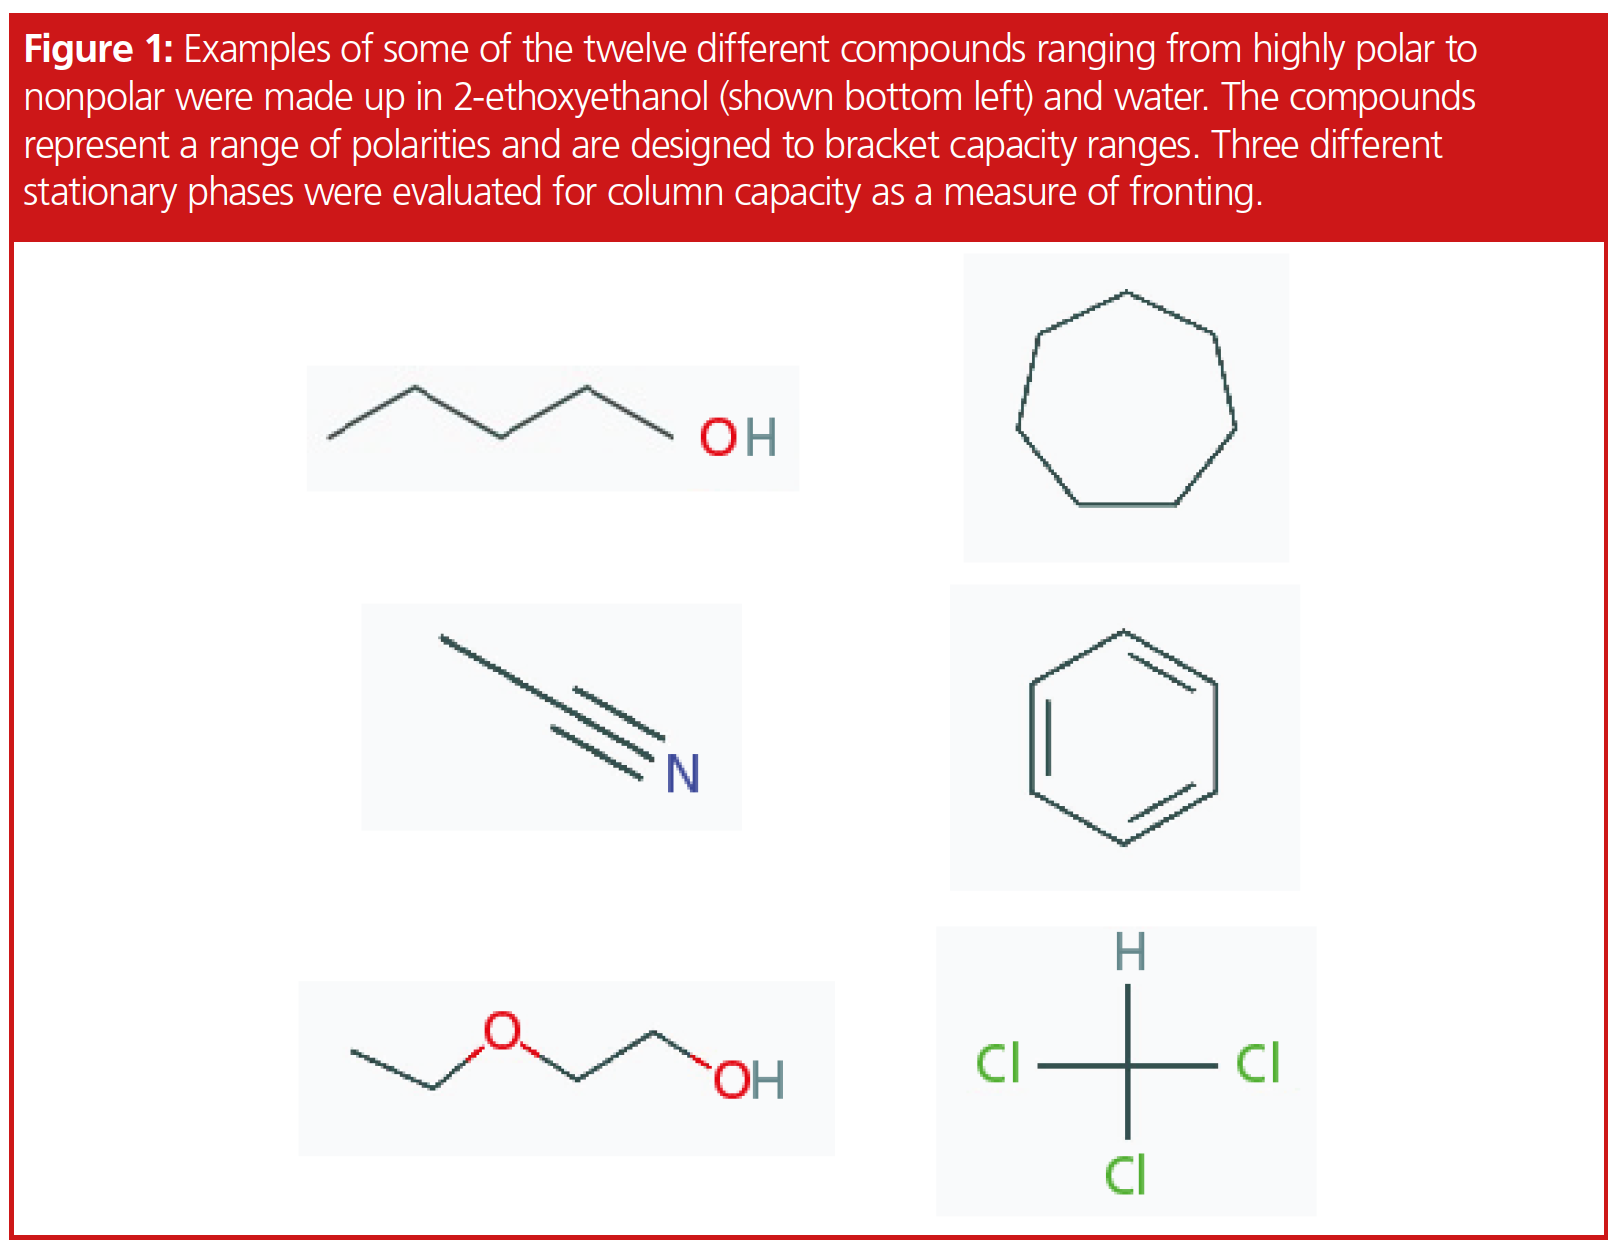
Three columns with different stationary phases were chosen: 100% polydimethylsiloxane (PDMS), “1-type phase”; polyethylene glycol (PEG), “wax phase”; and a 14% cyanopropylphenyl–86% polydimethylsiloxane phase, “1701-type phase”. Column dimensions were the same for the phases evaluated (30 m × 0.53 mm, 0.5-μm df columns [Restek]). Our choice of compounds is designed to cover highly polar (acetic acid and propionic acid), polar (1-butanol), mid-polarity (butyraldehyde, 2-butanone, acetonitrile, chloroform) and nonpolar (benzene, cycloheptane, octane, octene, octyne). Using data from our previous article (4), where we describe the impacts of solvents on retention and peak shape, we were able to determine that using 2-ethoxyethanol (EGEE) as a solvent with split rates of 1:25 or higher had no measurable effects on peak shape or retention for the compounds used in that study. This became a logical starting point and at first glance 10 of our 12 compounds were soluble in 2-ethoxyethanol. Oven conditions started at 40 °C with a hold time of 10 min followed by a 30 °C/min to 330 °C, with a final hold of 2 min. Compounds eluted during the hold time allowed a more controlled comparison between columns. Column flow was 5 mL/min, 37 cm/s. Two split ratios were used—25:1 and 50:1—since higher split ratios were unable to maintain correct pressures. Sample concentrations were adjusted from 500 parts per million (ppm) to 200,000 ppm, and on‑column concentrations were at points 100, 250, 500, 1000, 2000, and 4000 ppm. Initial peak identification was performed using a gas chromatography–mass spectrometry (GC–MS) system and capacity experiments were run on a flame ionization detector (FID). Samples were analyzed at the same concentration on-column using different splits and starting concentrations to verify performance (Figure 1).
Carboxylic Acid Analysis: Analyzing acetic acid and propionic acid required water as the solvent, different concentrations, and a change in the wax column starting temperature as elution of propionic acid at 40 °C would have taken 193 min (5). Oven conditions for the wax columns were adjusted to 120 °C isothermal with a final bakeout to 230 °C, while the 1701 and 1-type columns remained at 40 °C. Final on-column concentrations ranged from 2 to 2000 ppm.
Data Analysis: Determination of fronting was performed using Agilent’s Chemstation calculation of peak symmetry where a Gaussian peak is 1.0 and values greater than 1.0 are considered fronting. A peak where there is no inflection point is calculated as S = a1+a2/a3+a4, where a1 is the start of the peak, a2 is the 2nd slice, a3 is the 2nd half slice, and a4 is the end of the peak. Chemstation values are more sensitive as they are not measured at 5% or 10% peak height and therefore they do not inversely correlate to USP or FDA asymmetry calculations. We defined an overloaded analyte as one with a symmetry value of 1.05 or greater, with verification of peak shapes using bracketing with different concentrations as a confirmation.
Results and Discussion
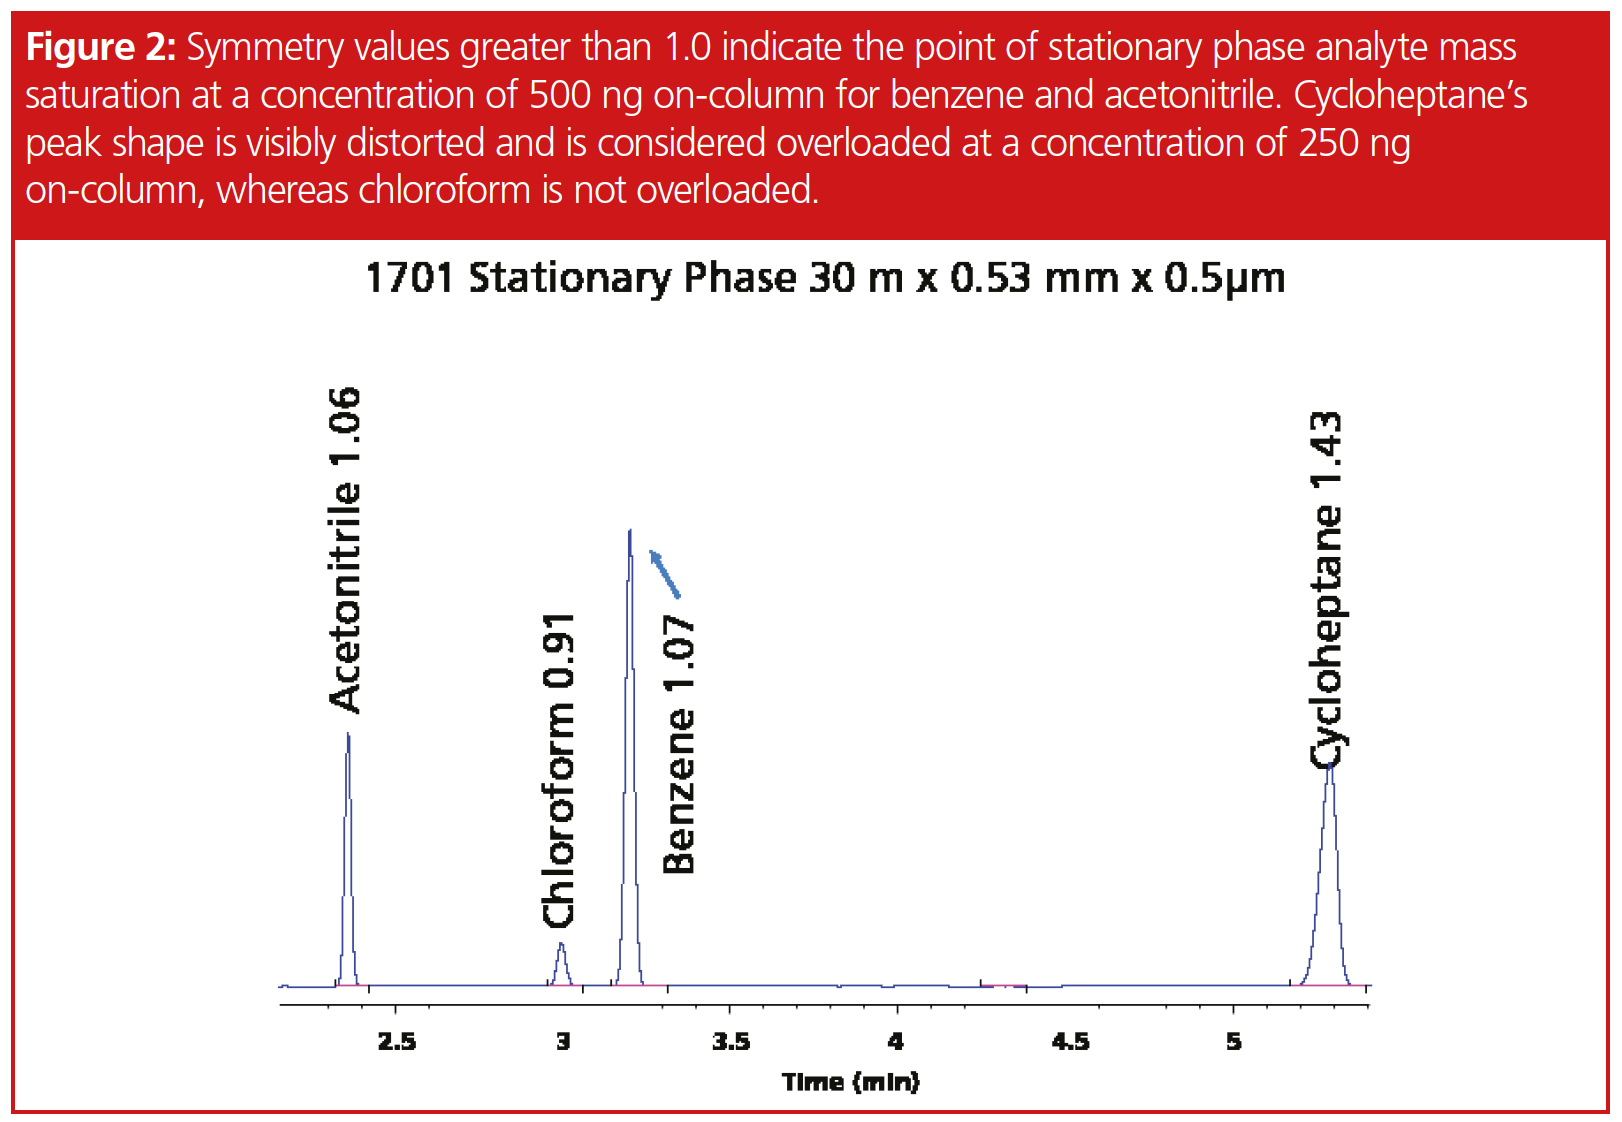
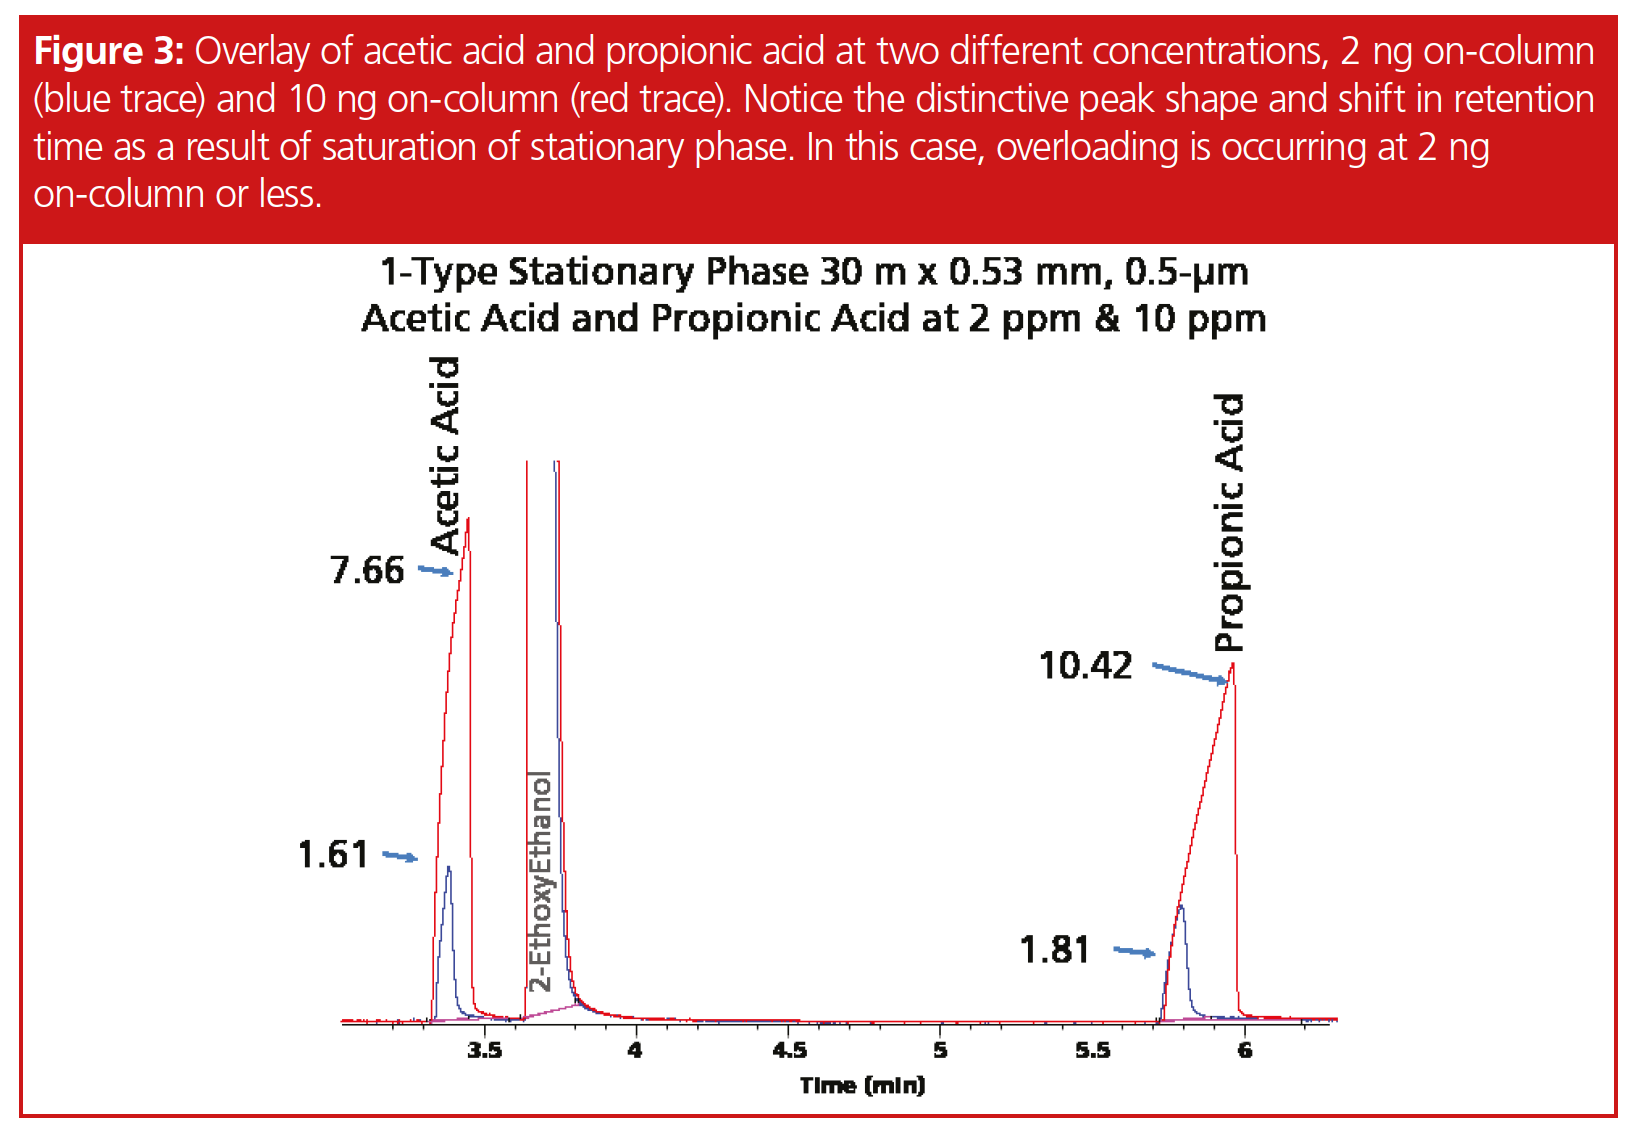
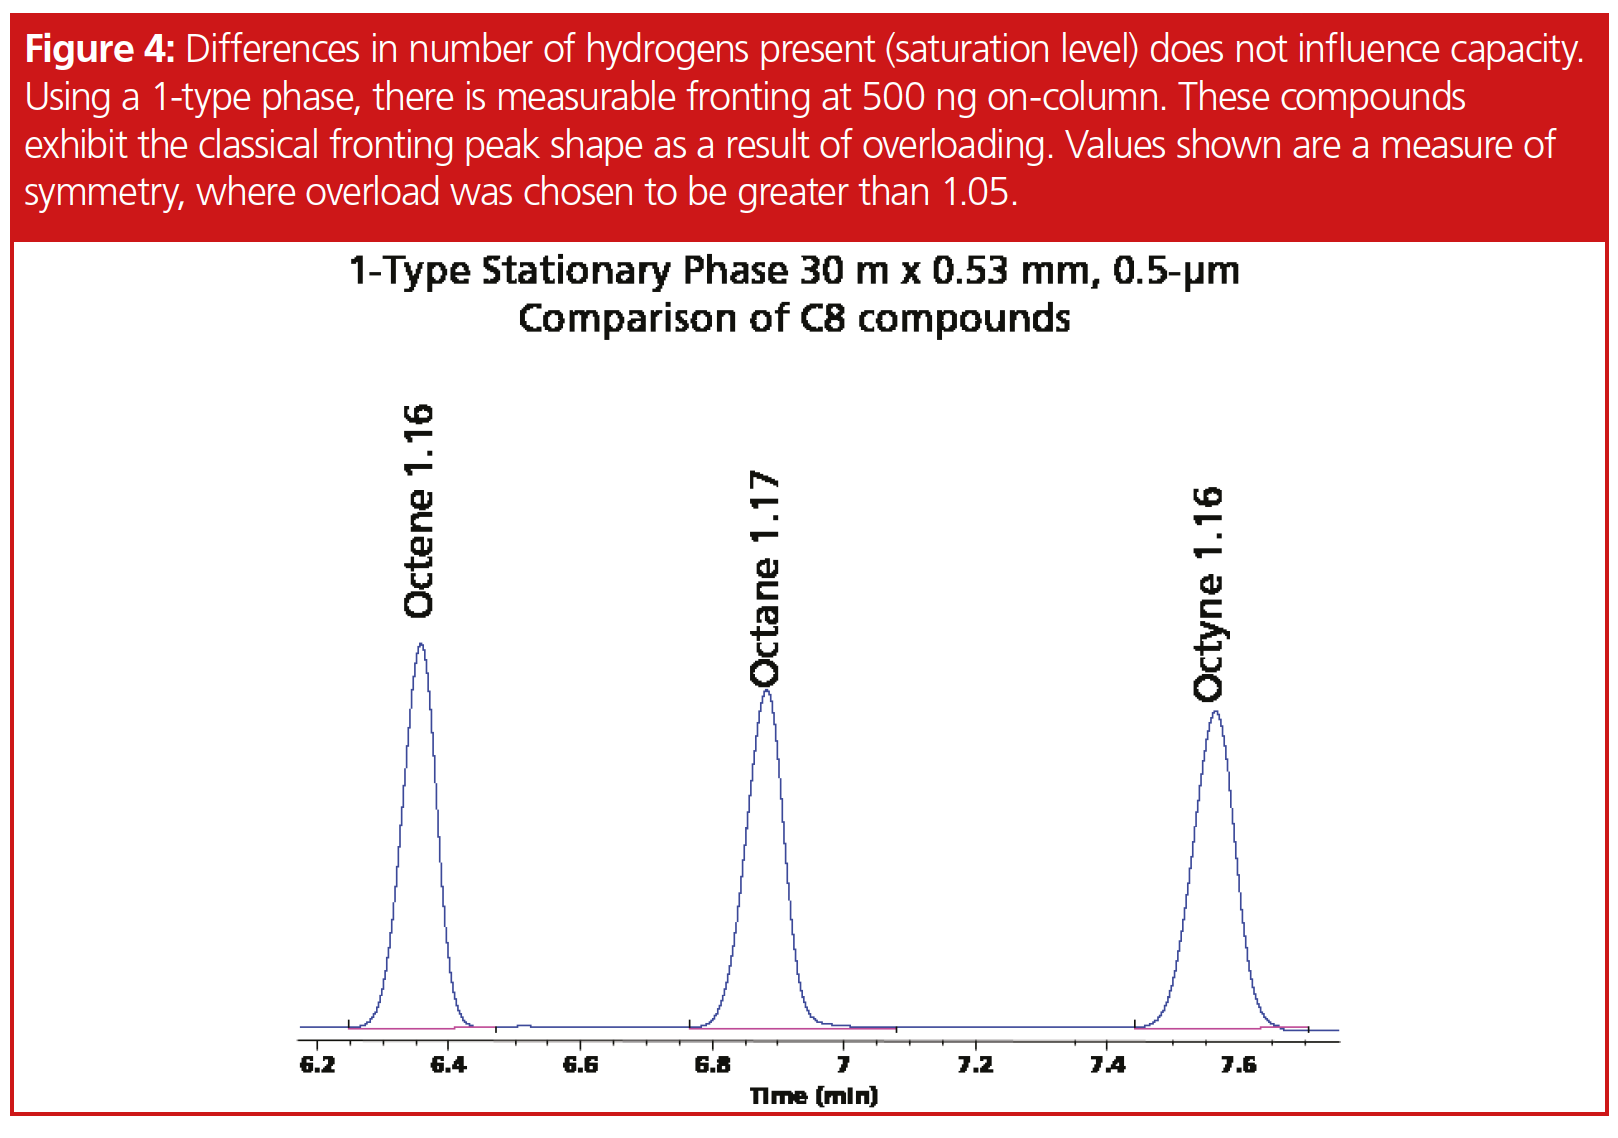
Determination of peak fronting for chloroform, butanol, and the acids proved to be difficult since these compounds did not exhibit classical fronting peaks for all stationary phases, such as we observed with the other compounds, such as cycloheptane (Figure 2). High concentration samples produced a double focusing effect with chloroform. In addition, chloroform was not linear beyond the 2000 ppm on‑column concentration, which suggests a potential solubility issue in 2-ethoxyethanol. Peak tailing was observed on both the 1701 and 1-type phases for butanol, and while our work with 2-ethoxyethanol in a previous article showed no observable effects, butanol under our given conditions and thinner film ratio eluted within one minute of the solvent. Propionic acid and acetic acid at 2 ppm on-column had a symmetry value of 1.61 and 1.81, suggesting that even lower concentrations would result in fronting (Figure 3). Surprisingly, fronting was observed on the wax column at 500 ppm and very distorted at 1000 and 2000 ppm. Differences in degree of compound saturation did not appear to change solubility enough to make measurable differences. Octane, octene, and octyne offered similar performances on the different stationary phases; for instance, on the 1-type phase, peak tailing at 500 pmm concentration was 1.16, 1.17, and 1.16, respectively (Figure 4). Figure 4 represents the point at which the peak symmetry exceeded 1.05.
Conclusions
This brief examination of column capacity using a 0.53 mm internal diameter and a 0.5 µm film thickness column with three different stationary phases determined that the capacity range for columns is much larger than what has been published. For example, a 1-type phase is saturated at the 2 ng on‑column level or below for acids. Compounds that are not soluble in a particular stationary phase will saturate at very low levels. Single bond, double bond, and triple bonded compounds did not measurably change solubility profiles. Further work with smaller column internal diameters will yield more accurate results as lower concentration standards and higher split ratios can be used, which will minimize solvent and allow a wider range of split ratios.
References
- D. Rood, A Practical Guide to the Care, Maintenance and Troubleshooting of Capillary Gas Chromatographic Systems (Huthig, Heidelberg, Germany, 1991), p. 44.
- J. de Zeeuw, Impact of GC Parameters on The Separation Part 4: Choice of Film Thickness, https://www.restek.com/globalassets/pdfs/literature/Impact-of-GC-Parameters_Part4.pdf
- J. de Zeeuw, Impact of GC Parameters on The Separation Part 2: Choice of Column Internal Diameter, https://www.restek.com/globalassets/pdfs/literature/impact-of-gc-parameters_part2.pdf
- C. English, The Column 17(6), 2–6 (2021).
- Pro EZGC Chromatogram Modeler.
Chris English has managed a team of chemists in Restek’s innovations laboratory since 2004. Before taking the reins of the laboratory, he spent seven years as an environmental chemist and was critical to the development of Restek’s current line of volatile GC columns. Prior to joining Restek, he operated a variety of gas chromatographic detectors conducting method development and sample analysis. Chris holds a B.S. in environmental science from Saint Michael’s College, USA.
E-mail: chris.english@restek.com
Website: www.restek.com

Understanding FDA Recommendations for N-Nitrosamine Impurity Levels
April 17th 2025We spoke with Josh Hoerner, general manager of Purisys, which specializes in a small volume custom synthesis and specialized controlled substance manufacturing, to gain his perspective on FDA’s recommendations for acceptable intake limits for N-nitrosamine impurities.


