How It Works: UV Detection for HPLC
The fundamental principles of UV detection
The fundamental principles of UV detection
Many organic molecules absorb ultraviolet (UV) radiation over a range of wavelengths, from around 200 nm up to around 400 nm. When using monochromatic light (light of a single wavelength or small range of wavelengths) radiated onto a dilute solution of analyte, the Beer-Lambert Law (equation 1) can be applied which relates absorbance (A) to analyte concentration:
A = ε l c [1]
Where A is absorbance, ε is the molar absorption coefficient (dm3 mol-1 cm-1), l is the flow cell path length (cm), and c the concentration of the solution (mol dm-3).
Typically, the wavelength chosen comes from the most intense region of the analyte absorbance spectrum, in order to achieve maximum sensitivity for quantitative measurement. In high-performance liquid chromatography with ultraviolet detection (HPLC–UV) applications, it is not necessary to know the value for the molar absorptivity coefficient or flow cell path length, as the instrument response is typically calibrated with one or more solutions of known concentration and a linear regression model is used to interpolate the concentration of unknowns.
UV detectors with specially designed deuterium lamps are used because of their almost constant light intensity and spectral reproducibility.


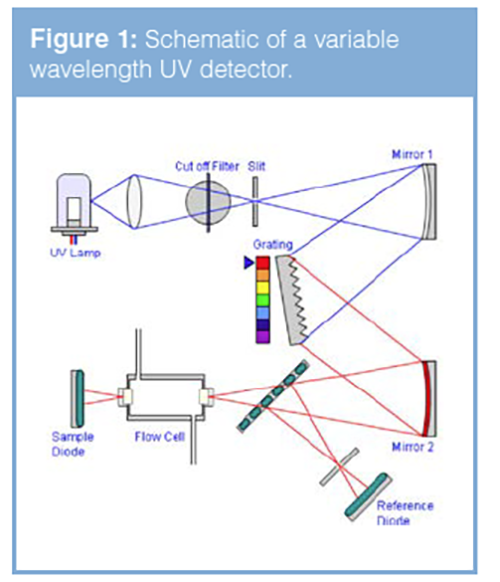
In variable wavelength detectors, the light is collimated using a slit which allows the light beam to fall upon a diffraction grating which splits the white light into its component wavelengths (Figure 1). The grating turns upon an electromechanical stage, which directs the desired part of the spectrum onto a further slit through which a small number of wavelengths (typically around 5 nm) will be allowed to pass. This light falls upon a beam splitter which directs the light either to a reference photodiode or through a flow cell in which the HPLC eluent is flowing and subsequently onto a second photodiode (the measuring photodiode). As the analyte elutes into the flow cell it will absorb light and the changes in the light transmittance (measured in milliabsorbance units, mAU), are registered via the measuring photodiode. The reference photodiode is used to make corrections as a result of fluctuations in the lamp intensity and thus improves the optical stability and performance of the instrument. As the diffraction grating is mounted on a turntable, various wavelengths may be measured throughout the course of an analysis to optimize the sensitivity for each of the analyte components, however the response time of the grating movement and change in analyte concentration with time in the flow cell means that spectral scanning of a single analyte as it passes through the flow cell is not possible.
In diode array detectors (sometimes known as reverse optics detectors), the white light is passed through the detector flow cell, prior to being split into its component wavelengths using a fixed diffraction grating (Figure 2).

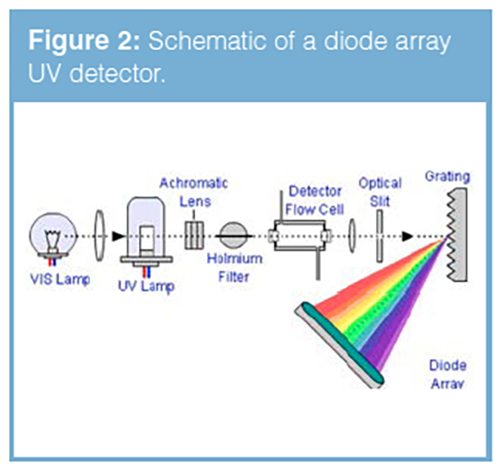
In this way the change in light transmittance for each constituent wavelength may be measured using a photodiode array (typically 1024 individual diodes) and the signals from each diode are summed in order to obtain a total intensity which is plotted against time to generate the ‘chromatogram’. Now, any point on the chromatogram may be selected from within the data system and the data deconvoluted in order to obtain the UV spectrum for that component (or the eluent system if a baseline point is chosen). Diode array detectors can be used for qualitative measurements such as peak identification against a user generated spectral library or to investigate peak purity using wavelength ratio measurements across the peak. The slit in the diode array detector is usually of variable width and can be used to ‘tune’ the light falling onto the diode in order to optimise either sensitivity (signal-to-noise) or spectral resolution.


: An Interview With Fabrice Gritti")


, also known as an immunoglobulin (Ig). 3d vector © sakurra - stock.adobe.com")
Accelerating Monoclonal Antibody Quality Control: The Role of LC–MS in Upstream Bioprocessing
This study highlights the promising potential of LC–MS as a powerful tool for mAb quality control within the context of upstream processing.


Using GC-MS to Measure Improvement Efforts to TNT-Contaminated Soil
April 29th 2025Researchers developing a plant microbial consortium that can repair in-situ high concentration TNT (1434 mg/kg) contaminated soil, as well as overcome the limitations of previous studies that only focused on simulated pollution, used untargeted metabolone gas chromatography-mass spectrometry (GC-MS) to measure their success.

Prioritizing Non-Target Screening in LC–HRMS Environmental Sample Analysis
April 28th 2025When analyzing samples using liquid chromatography–high-resolution mass spectrometry, there are various ways the processes can be improved. Researchers created new methods for prioritizing these strategies.

Potential Obstacles in Chromatographic Analyses Distinguishing Marijuana from Hemp
April 28th 2025LCGC International's April series for National Cannabis Awareness Month concludes with a discussion with Walter B. Wilson from the National Institute of Standard and Technology’s (NIST’s) Chemical Sciences Division regarding recent research his team conducted investigating chromatographic interferences that can potentially inflate the levels of Δ9-THC in Cannabis sativa plant samples, and possible solutions to avoid this problem.

