How Does It Work? Part IV: Ultraviolet Detectors
LCGC North America
Detectors based on ultraviolet absorbance are the most common detectors in use for liquid chromatography.
Detectors based on ultraviolet absorbance are the most common detectors in use for liquid chromatography.
Over the last few months we’ve been working our way through the liquid chromatography (LC) system, with a look at pumps (1), mixing and degassing (2), and autosamplers (3). This month we look at the two most popular LC detectors, the variable-wavelength ultraviolet–visible (UV–vis) and diode-array (also commonly called the photodiode-array, or PDA) detectors.
When I started doing LC in the early 1970s, fixed-wavelength detectors were the only option for UV detection. The most common wavelength was 254 nm, because of the strong 254-nm line in the low-pressure mercury lamp that was used as the optical source. If a phosphor was added to the system, a line at 280 nm was available. Another line was available at 365 nm. A change to a zinc lamp added 214 nm to the available wavelengths. Today, deuterium lamps are used in most UV detectors because of they provide an almost continuous spectrum of light over the 190–400 nm range most commonly used for LC detection. It is interesting to note how many methods are developed today with one of the historic 214/254/280/365-nm wavelengths, mainly from tradition rather than a scientific reason to choose one of these wavelengths.
I did a quick on-line search and found three companies that still sell a fixed-wavelength UV detector, but it wasn’t clear if they were all made by the same manufacturer. They are promoted as an inexpensive alternative ($2253 from one vendor) when high sensitivity and flexibility are not important. Nearly all UV detectors today are either variable-wavelength or diode-array models.
Variable-Wavelength Detectors
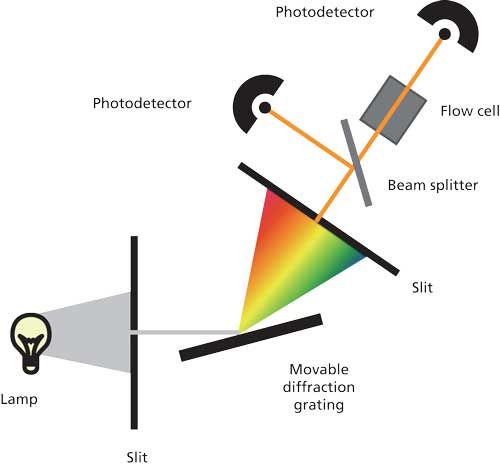
A schematic of a variable-wavelength detector is shown in Figure 1. Light from a deuterium lamp is directed through a slit onto a diffraction grating, which spreads the white light into its various wavelengths. The grating is rotated to direct the desired portion of the spectrum through another slit. The slit width, or spectral bandwidth, typically is approximately 5 nm. The light is then directed through the flow cell onto a photodiode. As sample passes through the flow cell, the amount of light transmitted to the photodetector is reduced, and this difference in transmittance is converted into the detector output in absorbance units (AU). Commonly a beam splitter is included, directing part of the light to another photodiode. This configuration allows the electronics to make corrections for fluctuations in the lamp intensity and thus improve the optical performance of the instrument.

Figure 1: Schematic diagram for a variable-wavelength UV detector.
To change detection wavelengths, the grating is rotated to direct another wavelength through the flow cell. Because of the high reproducibility and speed of the indexing of the grating position, the electronic controls of the detector can change wavelengths for different peaks in the chromatogram, if desired. Although it is possible to rotate the grating while a peak passes through the detector cell, the combination of a change in wavelength with a change in concentration of the peak over time makes spectral interpretation difficult. Thus, scanning with a variable-wavelength detector generally is not recommended.
Diode-Array Detectors
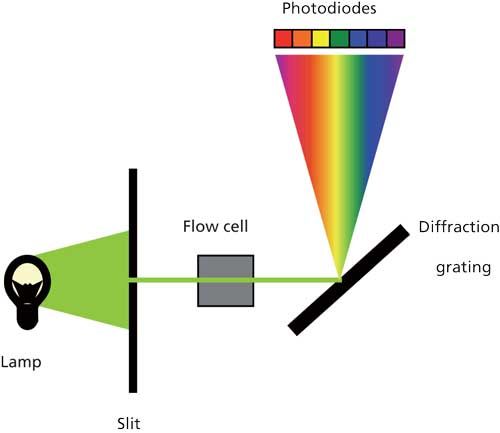
The diode-array detector (Figure 2) has components in common with the variable-wavelength detector, but they are configured differently. A deuterium lamp is used, but it is the white light that is directed through the flow cell before it reaches the diffraction grating. The light then strikes the diffraction grating and is directed onto a linear array of photodiodes (thus the name of the detector). Typically 512 or 1024 diodes are used. As with the variable-wavelength detector, the diode-array detector covers wavelengths from 190 nm up to as high as 800 nm, although visible wavelengths may require a separate tungsten lamp. Depending on the wavelength range of the detector and the size of the diode array, each diode collects data from 0.5 to 1 nm in typical designs. This is often referred to as the digital resolution or spectral bandwidth. The electronics of the detector can then report absorbance at a single wavelength, a wavelength range, or as a full spectrum. Because all wavelengths of light (white light) pass through the flow cell at once, the spectrum is not distorted by a change in concentration as the peak passes through the flow cell, as it is with the variable-wavelength detector.

Figure 2: Schematic diagram for a diode-array UV detector.
The Detector Cell
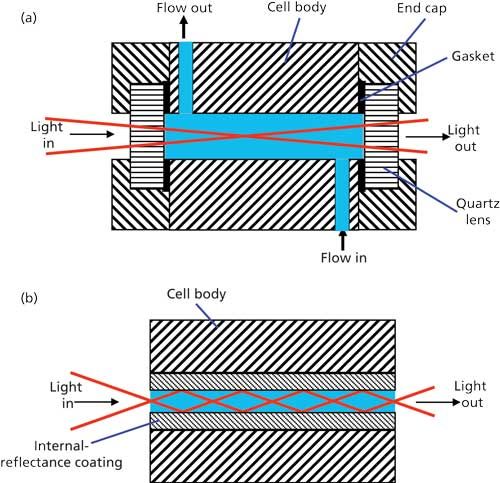
The most common detector cell design is shown in Figure 3a. This design comprises a block of stainless steel through which a hole is drilled. The most common configuration is a 1-mm hole drilled through a 10-mm-long block, resulting in 8 µL of internal volume. A quartz window is added to each end of the cell and is sealed with a gasket or by other means. Connections are made to allow the mobile phase to flow through the cell in a manner that efficiently sweeps the contents through the cell with minimal mixing. Light shines through the cell, and the detector response is generated by the change in the amount of light passing through the cell as the sample travels through.

Figure 3: UV detector cells: (a) traditional design; (b) light-pipe or internal reflectance design.
Ideally, all light entering the cell should pass directly through from one end to the other. Any light that hits the walls of the cell is scattered and will reduce detector performance. Refractive index plays a major role in how much light makes it from one end of the flow cell to the other. Recall that whenever light passes from one medium to another, it bends if the media have different refractive indices. So there is a bending when light passes from air into quartz, quartz to mobile phase, mobile phase to quartz, and quartz back to air. Anything that changes the refractive index of the mobile phase in the cell will change the amount of light passing through. Pressure, mobile-phase composition, and temperature are the main contributors to refractive index changes in the flow cell. This is one reason why pulse-free pumps are desired. Pulse dampening is accomplished with a combination of mechanical design as well as mechanical and electronic dampening processes.
Mobile-phase compositional variability usually is not a big concern with UV detection, but refractive index detectors (to be discussed in a future installment) are so sensitive to mobile-phase composition that hand-mixed mobile phase is essential. For the quietest baselines with UV detection, hand-mixed mobile phases may be beneficial for isocratic separation. For gradients, it may be useful to premix the A and B solvents to reduce background noise. For example, mix 5% acetonitrile in the buffer (A solvent) and 5% buffer in the acetonitrile (B solvent) and run a 0–100% B gradient instead of a 5–95% gradient with pure A and B solvents.
Variations in ambient temperature can degrade detector stability because of refractive index changes. For this reason, a heat exchanger usually is added to the detector cell to stabilize the temperature before the mobile phase enters the cell. Although the detector cell of Figure 1a may have a nominal volume of 8 µL based on the 1 x 10 mm cell itself, this volume can double when a heat exchanger is added. Any additional volume may contribute to extracolumn band broadening if the chromatographic peak volumes are small, as is the case for columns containing particles <5 µm in diameter, column diameters of <4.6 mm i.d., or peaks that are eluted very early in the chromatogram.
With the introduction of ultrahigh-pressure LC (UHPLC), particles <3 µm in diameter, and 2.1-mm or smaller column diameters, extracolumn effects became a major cause of unwanted peak broadening. With the narrow peaks generated by these conditions, the 8-µL or larger flow cells used in traditional LC systems were no longer satisfactory. It was necessary to reduce the diameter of the detector cell to reduce the peak broadening in the cell. However, reduction in the internal diameter of the cell was not practical because light scattering increases due to the inability to perfectly collimate the light and the magnified effects of refractive index. A solution to many of these problems was achieved with the cell design of Figure 3b. Often referred to as a light-pipe or total internal reflectance cell, these cells were constructed in a manner to reduce or eliminate light-scattering problems. Two common cell designs are used today. With one, the walls of the cell are coated with a reflective polymer, giving it a mirror-finish. In the other design, a fused-quartz capillary is used as the cell, and light is reflected from the walls of the capillary. Thus, any light entering the flow cell that hits the walls is reflected along the cell and reaches the other end. This design mitigates the two major problems of the traditional flow cell: poor collimation of the light and refractive index changes. Temperature control is less critical, so large heat exchangers are not needed. Because “all” of the light entering the cell exits at the other end, smaller-diameter cells can be used. For example, the 1-mm i.d. flow cell has a volume of 8 µL, so a 0.5-mm i.d. cell would be 2 µL, or a 0.25-mm i.d. cell would be 0.5 µL. These 500-nL cells are available for UHPLC applications. Another advantage of such small-diameter cells is that dispersion, which is responsible for extracolumn band broadening, is reduced by the fourth power of the diameter change. This advantage allows the use of longer flow cells for better sensitivity while at the same time having less band broadening than shorter-path cells of larger diameter. Flow cells 60 mm long are available for UHPLC applications.
The benefits of the light-pipe cell design are many and the problems are few, so this design of flow cell is gradually becoming part of traditional LC systems as new detector designs are introduced. With lower pressure limits than UHPLC (for example, <600 bar), such systems with reduced extracolumn volume can take full advantage of superficially porous particle columns and compete strongly with sub-2-µm particles under higher pressures in UHPLC systems.
Comparisons
At first glance, it might seem that the diode-array detector would be a much better choice than the variable wavelength detector in most applications. After all, it collects data at all wavelengths for every peak and has fewer moving parts. However, the signal-to-noise ratio, which translates into detection limits, usually is worse with the diode-array detector. (This is because the size of the individual photodiodes of the diode array are smaller than the typical photodiodes used in the variable-wavelength detector.) I compared specifications for comparable detectors from the major equipment manufacturers and the noise specification for the diode-array detector typically is 1.5–2 times worse than the variable-wavelength detector. Even so, noise specifications in the range of 1 x 10⁻⁵ to 3 x 10⁻⁶ AU are common with today’s diode-array instruments, which is very good. Don’t expect to repeat such low noise levels in your laboratory with real samples, because most manufacturers measure noise with a dry flow cell, eliminating any noise because of the mobile phase. Furthermore, drift specifications are 5–10 times worse for diode-array detectors, ranging from 1 x 10⁻³ to 5 x 10⁻⁴ AU/h in the diode-array detector specifications I reviewed.
In addition to the ability to generate UV spectra from every peak, the diode-array detector software often includes the ability to report peak purity. This is done by taking spectra at the beginning (upslope) and end (downslope) of the peak and comparing them with a simple ratio or by use of a more sophisticated algorithm. When a partially resolved peak is present or an impurity is hidden under the tail, peak purity calculations should identify the situation, alerting the user to potential problems. The literature and examples from the detector manufacturers are very impressive, but in informal surveys of students in my classes, the technique does not work very well in practice. The reason for this is twofold. First, if two peaks are eluted close to each other in the same sample, chances are that they will be related compounds. Spectra obtained from diode-array detectors typically are at low resolution and have little detail, so spectra of similar compounds may be hard to differentiate. Second, impurities under a large peak, such as is the case in pharmaceutical impurities or degradant analyses, are typically small-often <<1% of the area of the main peak. In these cases, the added uncertainty because of signal-to-noise problems further compromises the data. The bottom line is that peak-purity calculations may give you valuable information, but be careful about putting too much confidence in a peak that is reported as pure.
Both the variable-wavelength and the diode-array detector can be very useful tools in the analytical laboratory. If you have the luxury of having both kinds of detectors, you are likely to find that the diode-array detector is most useful when you are looking at unknown compounds and during development activities where spectral information can be helpful in making decisions about a method or a sample. For routine analysis, the extra sensitivity of the variable-wavelength detector may make it the detector of choice, especially when low-concentration samples are analyzed.
Potential Problems
Today’s detectors are easy to operate and relatively trouble-free. However, there are a few items to pay attention to.
The combination of the almost universal use of in-line degassers and improved flow-cell design means that air bubbles in the detector are seldom a problem. If you have problems with air bubbles (often exhibited as spikes in the chromatogram or strong baseline excursions), first check to be sure there are no loose fittings in the system. Usually bubble problems can be mitigated by applying a slight back-pressure on the flow cell. This can be done by using a piece of capillary tubing as the waste line or a commercially available back-pressure device that holds a constant pressure on the flow cell. If you use a capillary tube, be careful that you don’t overpressure the cell if the flow rate is increased. The specifications I reviewed stated cell pressure limits of 70–120 bar (580–1740 psi); it is a good idea to check pressure limits on your detector. Exceeding the pressure limits can irreversibly damage the cell, so take care that this does not happen.
As with other aspects of liquid chromatography, cleanliness is essential for best operation-the detector is no different. Although there are techniques to clean detector cells (consult the operation or service manual for yours), I don’t recommend special cleaning procedures as a preventive maintenance task. The detector cell is one of those parts that the “if it ain’t broke, don’t fix it” advice applies. It is easier to cause problems than prevent them, so I depend on flushing the column and system at the end of each sample batch to keep the cell clean.
Detector lamps will eventually fail. Most manufacturers today quote a 2000-h lamp lifetime. If you use your detector only for analyzing samples with big peaks, you may get many more hours than this-I’ve seen detector lamps still going strong at 5000 h. However, if you depend on the detector for trace analysis, expect shorter lifetimes. Most systems keep track of the number of hours a lamp has been in use, so you can check this once a month or so, or set an alarm to alert you when the clock gets near 2000 h. I usually wait until symptoms of lamp failure occur, such as increased noise or decreased lamp energy, before I replace this expensive part.
The UV detector should stay in calibration unless it undergoes a physical shock, such as dropping the unit. Calibration procedures vary with the individual detector model, so you should consult the operation or service manual for specific details on your detector. Most of today’s detectors are calibrated using an internal holmium oxide filter, which has several spectral lines used for calibration. This may be done automatically when the detector is powered on, or it may require manually activating a calibration program. Calibration frequency usually is a laboratory policy, but if not done more frequently, calibration should be performed at least annually.
Conclusions
UV detectors are the most popular LC detectors in use today. They are simple to operate, robust in their performance, and give adequate response to a wide variety of analytes. With a little care, you should be able to get consistent, high-quality results from either the variable-wavelength or diode-array detector.
References
- J.W. Dolan, LCGC North Am. 34(5), 324–329 (2016).
- J.W. Dolan, LCGC North Am.34(6), 400–407 (2016).
- J.W. Dolan, LCGC North Am. 34(7), 472–478 (2016).
John W. Dolan

“LC Troubleshooting” Editor John Dolan has been writing “LC Troubleshooting” for LCGC for more than 30 years. One of the industry’s most respected professionals, John is currently the Vice President of and a principal instructor for LC Resources in Lafayette, California. He is also a member of LCGC’s editorial advisory board. Direct correspondence about this column via e-mail to LCGCedit@ubm.com

University of Tasmania Researchers Explore Haloacetic Acid Determiniation in Water with capLC–MS
April 29th 2025Haloacetic acid detection has become important when analyzing drinking and swimming pool water. University of Tasmania researchers have begun applying capillary liquid chromatography as a means of detecting these substances.
Prioritizing Non-Target Screening in LC–HRMS Environmental Sample Analysis
April 28th 2025When analyzing samples using liquid chromatography–high-resolution mass spectrometry, there are various ways the processes can be improved. Researchers created new methods for prioritizing these strategies.

.png&w=3840&q=75)

.png&w=3840&q=75)


.png&w=3840&q=75)


.png&w=3840&q=75)


