High Performance Liquid Chromatography Analysis of Cinnamon from Different Origin
Cinnamon is a common spice and herbal remedy used around the world, and has many health benefits associated with it. The reddish-brown powder is ground from the dried bark of an evergreen tree in the Lauraceae family, and is often added to baked goods, tea, curries, and meat dishes as a spice. Apart from its positive effects on digestion, stomach health, intestinal regulation, and detoxification, it has been reported to be effective in preventing or improving diabetes, as a result of its hypoglycemic and lipid-lowering potential (1,2). Cinnamon also contains natural antioxidants that could reduce the risk of cancer and the signs of ageing, and is a common treatment for inflammatory diseases and amenorrhea in traditional Chinese medicine (2,3).
Despite these clinical benefits, there is also evidence that cinnamon may exhibit some adverse effects. One of the main components of cinnamon, coumarin, has been shown to have hepatotoxic and carcinogenic effects, and as a result, the European Food Safety Authority has determined the tolerable daily intake (TDI) of coumarin to be 0.1 mg per kg of body weight (4). In addition, cinnamaldehyde— another main component—was determined to be an irritating and sensitizing component that may exhibit teratogenic effects (3). Consequently, determining the concentration of these compounds in cinnamon is considered an important part of quality control.
The main types of cinnamon are cinnamomum verum (Ceylon cinnamon) and cinnamomum cassia, both containing coumarin and cinnamaldehyde in varying concentrations, depending on the origin of the spice. This article describes a method for using high performance liquid chromatography (HPLC) to simultaneously quantify the content of coumarin and cinnamaldehyde in cinnamon samples from different regions.
Analysis of Coumarin and Cinnamaldehyde in a Mixed Standard Solution
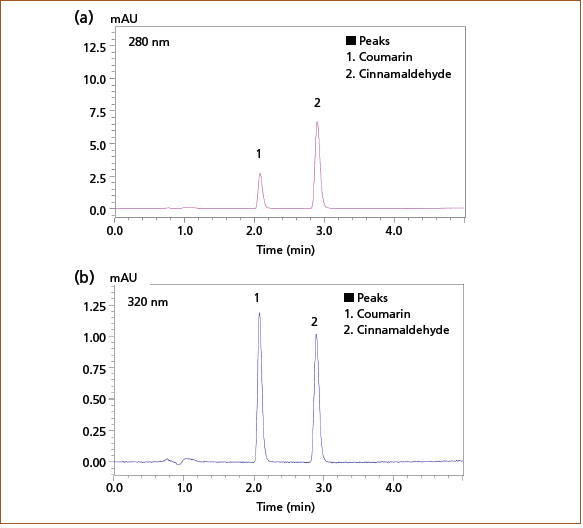
A mixed standard solution containing 0.5 mg/L of each of the analytes of interest—coumarin and cinnamaldehyde —was prepared in acetonitrile and analyzed using the conditions listed below. Coumarin was detected at 280 nm, near the maximum absorption wavelength. While the maximum absorption wavelength for cinnamaldehyde is 287 nm, taking into consideration sensitivity and separation from contaminants in the cinnamon sample, cinnamaldehyde was detected at 320 nm. Figure 1 shows a typical chromatogram of the separation obtained at both detection wavelengths.
Figure 1: Chromatogram of a mixed standard solution of coumarin and cinnamaldehyde (0.5 mg/L each) at (a) 280 nm and (b) 320 nm detection wavelength.
Method: Analytical Conditions of the Determination of Coumarin and Cinnamaldehyde: System: Nexera Lite HPLC (Shimadzu); column: 150 mm × 3.0 mm, 3-μm Shim-pack GIST-HP C18 (Shimadzu); flow rate: 0.8 mL/min; mobile phase: A) water B) acetonitrile; time program: 50%B (0–2 min) 60%B (4 min) 100%B (4.01–5.00 min) 50%B (5.01–10.00 min); column temp.: 25 °C; injection volume: 5 μL; detection (photo diode array [PDA]): channel 1 (coumarin) λ = 280 nm, channel 2 (cinnamaldehyde) λ = 320 nm.
Results: Repeatability of the method was determined based on retention time and peak area from six successive analyses of the 0.5 mg/L mixed standard solution. Linearity was evaluated by producing calibration curves using standard solutions within a concentration range of 0.013– 1 mg/L for coumarin and 0.5–40 mg/L for cinnamaldehyde. With correlation coefficients r2 = 0.9999 or greater and variation of < 0.1% in retention time and < 0.5% in peak area for both analytes, good linearity and repeatability of the assay was established.
Sample Analysis: Coumarin and Cinnamaldehyde in Commercial Cinnamon Products
Commercially available samples of cinnamomum cassia produced in Vietnam and cinnamomum verum produced in Sri Lanka were analyzed after extraction with acetonitrile following the pretreatment protocol shown in Figure 2.
Figure 2: Pretreatment protocol for extraction of coumarin and cinnamaldehyde from cinnamon samples.
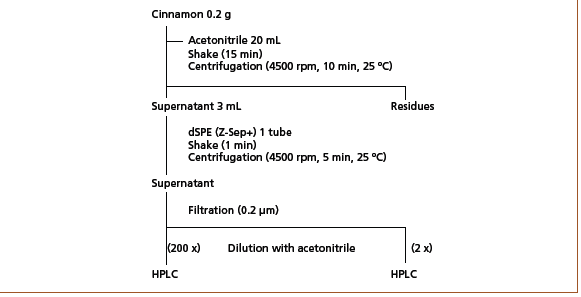
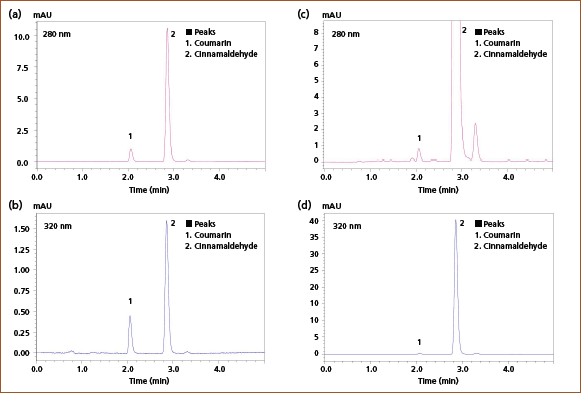
Lipids were removed using a dispersive solid-phase extraction (dSPE) cartridge. The cartridge eliminated the need to carry out conditioning before loading samples, which simplified the process. The supernatant was filtered through a 0.2 μm membrane filter and diluted with acetonitrile before analysis by HPLC. Figure 3 displays the obtained chromatograms of the quantification of coumarin and cinnamaldehyde in commercial cinnamon samples. The supernatant obtained from extraction from cinnamomum cassia required a 200‑fold dilution, while the cinnamomum verum extract was diluted by a factor of 2. Detailed results can be found in Table 1.
Figure 3: Chromatograms of coumarin and cinnamaldehyde in cinnamomum cassia at (a) 280 nm and (b) 320 nm detection wavelength and cinnamomum verum at (c) 280 nm and (d) 320 nm detection wavelength.

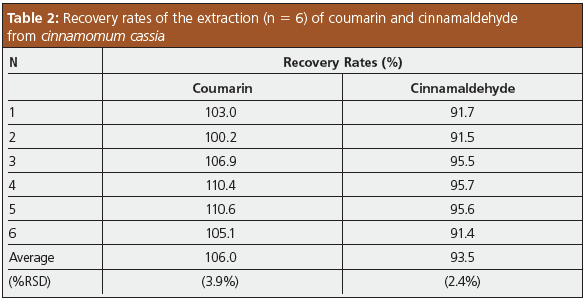
Recovery Test: To verify the effectiveness of the pretreatment protocol, a recovery test was performed by spiking coumarin and cinnamaldehyde in cinnamomum cassia to obtain six samples of 0.2 g with concentrations of 2 mg/g and 20 mg/g, respectively. These samples were each extracted following the pretreatment protocol in Figure 2, resulting in sample solutions containing 100 μg/L coumarin and 1000 μg/L cinnamaldehyde, following a 200-fold dilution with acetonitrile. These were analyzed by HPLC to determine the recovery rates. As can be seen from the results shown in Table 2, the pretreatment protocol offered good recovery and accuracy for the extraction of the analytes of interest.
Conclusion
A fast and simple HPLC method for the simultaneous analysis of two main compounds in ground cinnamon was developed. Using a C18 column, baseline separation of the target compounds was achieved within 4 min, with good repeatability and proven linearity within the range of 0.013–1 mg/L for coumarin and 0.5–40 mg/L for cinnamaldehyde. A simple pretreatment protocol was proposed that offered efficient extraction and appropriate sensitivity to ensure the detection wavelength was optimized to achieve good separation from contaminants. This method offers quick qualitative and quantitative analysis for the quality control of cinnamon products.
References
- N. Iwata, Shimadzu Corporation Application News No. 01-00233-EN (Shimadzu Corporation, December 2021).
- D.-T. Gu et al., Frontiers in Pharmacology 12, 790901 (2022).
- Committee on Herbal Medicinal Products (HMPC), Assessment report on Cinnamomum verum J. S. Presl, cortex and corticis aetheroleum, EMA/HMPC/246773/2009, 10 May 2011 Assessment report on Cinnamomum verum J. S. Presl, cortex and corticis aetheroleum (europa.eu)
- Coumarin in flavourings and other food ingredients with flavouring properties, The EFSA Journal 793, 8–15 (2008). https://efsa.onlinelibrary.wiley.com/doi/epdf/10.2903/j.efsa.2008.793
Gesa Johanna Schad graduated with a diploma in chemical engineering from the Technical University NTA in Isny, Germany, in 2004 and as a master of science in pharmaceutical analysis from the University of Strathclyde in Glasgow, UK, in 2005. She worked until 2006 as a consultant in HPLC method development and validation in an analytical laboratory of the FAO/IAEA in Vienna, Austria. She gained her doctorate for research in pharmaceutical sciences at the University of Strathclyde in 2010 and was employed as an HPLC specialist in the R&D department at Hichrom Ltd in Reading, UK, from 2009. Since 2013, she has worked as a HPLC product specialist and since 2015 as HPLC Product Manager in the analytical business unit of Shimadzu Europa in Duisburg, Germany.
Natsuki Iwata graduated with a diploma in chemistry and materials technology from Kyoto Institute of Technology in Kyoto, Japan, in 2010 and a MEng in chemistry and materials technology from the graduate school of Science and Technology, Kyoto Institute of Technology in 2012. She has worked as an HPLC product specialist in the Shimadzu global application development centre since 2012 and the solutions centre of excellence of Shimadzu Corporation in Kyoto since 2022.
E-mail: shimadzu@shimadzu.eu
Study Explores Thin-Film Extraction of Biogenic Amines via HPLC-MS/MS
March 27th 2025Scientists from Tabriz University and the University of Tabriz explored cellulose acetate-UiO-66-COOH as an affordable coating sorbent for thin film extraction of biogenic amines from cheese and alcohol-free beverages using HPLC-MS/MS.
Multi-Step Preparative LC–MS Workflow for Peptide Purification
March 21st 2025This article introduces a multi-step preparative purification workflow for synthetic peptides using liquid chromatography–mass spectrometry (LC–MS). The process involves optimizing separation conditions, scaling-up, fractionating, and confirming purity and recovery, using a single LC–MS system. High purity and recovery rates for synthetic peptides such as parathormone (PTH) are achieved. The method allows efficient purification and accurate confirmation of peptide synthesis and is suitable for handling complex preparative purification tasks.


