Gradient Performance Problems — A Case Study
LCGC Europe
The gradient linearity and step tests are two of the most useful performance tests that can be made for a liquid chromatography (LC) system. These check the linearity of gradient generation and the accuracy of mobile phase proportioning. These tests, and examples of problems detected as a result of these tests, have been the subject of at least seven "LC Troubleshooting" columns over the last 18 years.1–7 We strongly recommend that every LC system undergo these tests at least on an annual basis, and preferably semiannually. When a new and different example of a problem detected by these tests is discovered, it is hard to bypass the opportunity to share it with our readers. So this month, you get yet another example of how an LC system can fail.
The gradient linearity and step tests are two of the most useful performance tests that can be made for a liquid chromatography (LC) system. These check the linearity of gradient generation and the accuracy of mobile phase proportioning. These tests, and examples of problems detected as a result of these tests, have been the subject of at least seven "LC Troubleshooting" columns over the last 18 years.1–7 We strongly recommend that every LC system undergo these tests at least on an annual basis, and preferably semiannually. When a new and different example of a problem detected by these tests is discovered, it is hard to bypass the opportunity to share it with our readers. So this month, you get yet another example of how an LC system can fail.

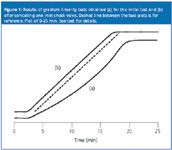
Figure 1
The Test
Just as a reminder, the test is quite simple. Replace the column with a piece of capillary tubing (for example, 1 m of 0.005 in. i.d. PEEK). Place water in the A-reservoir and water plus 0.1% acetone in the B-reservoir. Set the UV detector to 265 nm. Adjust the flow-rate so that there is sufficient backpressure ( ≈ 35 bar) for good check-valve operation, such as 1–2 mL/min. The first test is a gradient linearity test — just run a blank gradient and record the baseline. This will give you information about gradient linearity and you can use the results to calculate the system dwell-volume (also called the gradient hold-up volume). The second test is a step test, in which isocratic steps are programmed between 0 and 100% B, generally at 5% or 10% increments. More details about these tests can be found in references 6 and 7, which you can access on-line.8
Initial Data
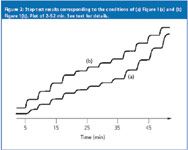
We run the two gradient tests as a part of a semiannual instrument performance test suite. These are programmed to run unattended, and data are analysed after the tests are complete. First, we ran the gradient linearity test as a linear gradient of 0–100% B over 15 min at 1 mL/min. The results for the initial test are shown in Figure 1(a). The second test is the step test. We run this with steps at 0, 10, 20, 30, 40, 45, 50, 55, 60, 70, 80, 90 and 100% B. We add the 5% steps near 50% B because, in our experience, if problems are going to occur, they occur near 50% B more often than not, especially with low-pressure-mixing systems. (A good example of low-pressure-proportioning-valve failure was presented in reference 6.) The program is set up to generate each step for 4 min and is run at 2 mL/min. The results of the initial step test are shown in Figure 2(a).

Figure 2
A well-behaved linearity test should appear similar to that shown in Figure 1(b). Clearly there is something wrong with the run of Figure 1(a) (dashed line added for reference). The initial and final isocratic sections appear to be OK, but the centre portion is quite nonlinear. Remember that the apparent isocratic hold at the beginning of the gradient linearity test is because of the dwell volume of the system, approximately 2.3 mL for this system (see reference 6 for determining dwell volume from such plots).
A step-test plot similar to that shown in Figure 2(b) was expected, with even step heights and the same degree of rounding for each step. There is obviously something wrong in the run of Figure 2(a) too. Because the linearity and step-test experiments are different ways of measuring mobile phase proportioning, it is not surprising that both tests fail — it would be more unusual if one test passed and the other failed.

Table 1: Step-test results.
To quantify the pump performance, the step heights are measured and converted to %B values. Just determine the difference in UV absorbance between the 0 and 100% B baselines and use this to determine the height of each step. Table 1 shows the data for Figure 2(a) as test a. The actual values differ by as much as 16% from the values set in the program, with an average deviation of 10.6%. Definitely unacceptable!
Isolating the Problem
This is a high-pressure mixing system comprising two dual-piston pumps; there are eight traditional ball-type check valves. In our experience, the check valves are the single most likely source of problems in today's LC systems (for more on check valves, see reference 8). One way to check for flow through the check valves is to pump an air bubble through the system. Set the pump(s) to deliver 50% B at 1 mL/min, then briefly lift the inlet line out of the A-reservoir so that a bubble approximately 2 cm long is drawn into the tubing. You should be able to watch the bubble flow through the transparent inlet line tubing up to the point where the flow stream splits just before the pump. If both pump heads are working properly, the bubble will split evenly between the pump heads. The bubble will be drawn into one head during its fill stroke, then, when the second pump head fills, the bubble will be diverted to the second head. (If you are using an in-line degasser, you might have to shut off the degasser during this test so that the bubble reaches the pump.) Repeat the test for the B-pump. In our situation, the bubble split, as expected, for the A-pump, but only entered the left head of the B-pump. When the right head executed its fill stroke, the bubble was stationary. This told us that the problem was related to the right head.

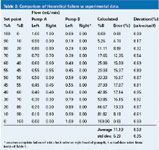
Table 2: Comparison of theoretical failure vs experimental data.
We sonicated and replaced the inlet check-valve for the right head of the B-pump and repeated the tests. The results were now those shown in Figures 1(b) and 2(b) — passing in both instances. The quantitative results of the Figure 2(b) step-test are shown in the right-hand two columns of Table 1 (test b). No step deviated by more than 1% (our acceptance criteria) and the average step was off by approximately 0.6%.
Further Investigations
As an academic exercise, it is interesting to determine the theoretical impact on mobile phase proportioning if one check valve is not working. Table 2 summarizes these data. For a high-pressure-mixing system, the various mobile phase proportions are obtained by varying the flow-rate of the two pumps during the gradient (or step test). The settings for each step are shown as the %A and %B set points in the left two columns. The flow-rates should be shared equally for the two pump heads of each pump, thus, at the 45% B setting, and 2 mL/min total delivery, each head of the A-pump should deliver 0.55 mL/min and each B-pump head should deliver 0.45 mL/min. If one check valve fails completely, its pump head will not deliver any solvent. For this example, we assumed that the right pump head of the B-pump was not working, so we assigned a flow-rate of 0 mL/min for that head, as shown in the flow-rate values of Table 2. Now simply express the total %B delivered as a per cent of the total flow-rate and you get the calculated %B; the difference between this and the set point gives us the calculated error. The average calculated error in Table 2 (11.19%) is very close to the experimental value (10.60) for the run of Figure 2(a) shown in Table 1. The last step is to calculate the difference for each step between the theoretically calculated error and the actual value. The deviation between these two values is less than 1% in all instances, confirming what we suspected by observation — one head on the B-pump wasn't working. (Note that the similarity of the numbers in the right-hand columns of Tables 1 and 2 is probably because of the same contributions to error of the same three pump heads in both tests — we think...)
Conclusions
This is an interesting case study because it allows us to get to the same answer from several different approaches. Either the step-test or the linearity test would have brought this problem to our attention. The bubble test and our calculated pump delivery values also would have led us to the same answer. Most of the time, however, we would have suspected problems before running the tests. The tests would merely confirm our suspicions. For example, with the present problem we would observe that retention times were too long in our system suitability test, which would alert us to look for the problem source.
It is important to realize that system failure can occur at any time, and sometimes without any apparent initiating factor. In the present instance, a pump flow-rate accuracy test and a pressure bleed-down test (which evaluates the performance of the outlet check valves) passed earlier on the same day the step and linearity tests failed. This reminds us how important it is to run a system suitability test at the beginning of each batch of samples so that you know the system is working properly when you are about to use it. Consistent retention times and peak areas for quality control samples run during and at the end of the batch will give added confidence in the LC system performance.
This brings up a question about the value of periodic performance tests — if the system can work well before the test and fail during the test, what is the point of running such tests? The current case study is a rather dramatic example of the complete failure of a system component, a check valve. More commonly, however, a partial failure will occur, and these can be harder to recognize and diagnose. For example, the source can be pump calibration,1 degassing and air bubbles,2,4 pump seals and check valves,5 the mobile phase proportioning valves,7 or other problems. In the instance of the proportioning valve failure,7 it is unlikely that the subtle failure would have been recognized by examination of the system suitability tests for a method. The gradient performance tests, such as those described in reference 6, will help you isolate and identify the source of the problem.
The bottom line is that we feel strongly enough about the importance of running periodic LC system performance tests that we go to the trouble and expense of testing every LC system twice a year. At a bare minimum, you should run these tests once a year during the annual preventive maintenance session. One of the basic concepts that we teach in our LC troubleshooting classes is that you are going to have a hard time figuring out what is wrong with your LC system if you do not know how it works when everything is working properly. The semiannual performance test gives you a good set of reference data for comparative purposes when something does go wrong.
References
1. J.W. Dolan, LCGC, 6(7), 572–576 (1988).
2. J.W. Dolan, LCGC, 7(1), 18–24 (1989).
3. J.W. Dolan, LCGC Eur., 6(7), 411–413 (1993).
4. T. Culley and J.W. Dolan, LCGC Eur., 8(7), 381–383 (1995).
5. J.W. Dolan, LCGC Eur., 9(5), 278–282 (1996).
6. G. Hall and J.W. Dolan, LCGC Eur., 15(10), 646–650 (2002).
7. J.J. Gilroy and J.W. Dolan, LCGC Eur., 17(11), 566–572 (2004).
8. J.W. Dolan, LCGC, 19(3), 140–144 (2006).
Jon Gilroy is an analyst at BASi Northwest Laboratory, McMinnville, Oregon, USA. He specializes in LC instrument troubleshooting, and his research interests are in LC column selectivity."LC Troubleshooting" editor John W. Dolan is vice-president of LC Resources, Walnut Creek, California, USA; and a member of the Editorial Advisory Board of LCGC Europe. Direct correspondence about this column to "LC Troubleshooting", LCGC Europe, Advanstar House, Park West, Sealand Road, Chester CH1 4RN, UK.
Readers can also direct questions to the Chromatography Forum at http://www.chromforum.com

Removing Double-Stranded RNA Impurities Using Chromatography
April 8th 2025Researchers from Agency for Science, Technology and Research in Singapore recently published a review article exploring how chromatography can be used to remove double-stranded RNA impurities during mRNA therapeutics production.
Troubleshooting Everywhere! An Assortment of Topics from Pittcon 2025
April 5th 2025In this installment of “LC Troubleshooting,” Dwight Stoll touches on highlights from Pittcon 2025 talks, as well as troubleshooting advice distilled from a lifetime of work in separation science by LCGC Award winner Christopher Pohl.


