Gradient HPLC — One Invaluable Equation
An excerpt from LCGC’s e-learning tutorial on gradient HPLC at CHROMacademy.com
Several mathematical relationships are useful in gradient elution reversedâphase liquid chromatography (LC), and the webcast and tutorial from which this excerpt is taken describes many of them. Here, we concentrate on one particularly useful equation that allows us to make changes to an analytical system to improve throughput or efficiency, while retaining the selectivity of the original method. This equation can be particularly useful when developing or translating high performance liquid chromatography (HPLC) methods. Equation 1 defines a corrected measure of gradient steepness (1) and measures the change in modifier concentration (%B) per column volume of mobile phase: Gs = VmΔΦ/FtG [1] where F is eluent flow rate (in millilitres per minute), tG is the gradient time (in minutes), ΔΦ is the percent change in organic modifier over the gradient (5–95% B would be represented as 90), and Vm represents the interstitial volume (that is, the volume of mobile phase) within the column and can be simply calculated using equation 2: Vm = π × r2 × L × W [2] where r is the column radius (in millimetres), L is the column length (also in millimetres), W is the column percent interstitial porosity, W (fully porous materials) ≈ 68% (0.68), and W (core–shell particles) ≈ 55% (0.55). So, for a method using a 150 mm × 4.6 mm column with 5-µm fully porous silica and a gradient of 20–60% B over 30 min at a flow rate of 1 mL/min, the value of Gs would be calculated as follows: Vm = π × 2.32 × 150 × 0.68 = 1695 (mL) =1.7 mL Gs = 1.7 × 40/1 × 30 Gs = 2.27 %B/column volume
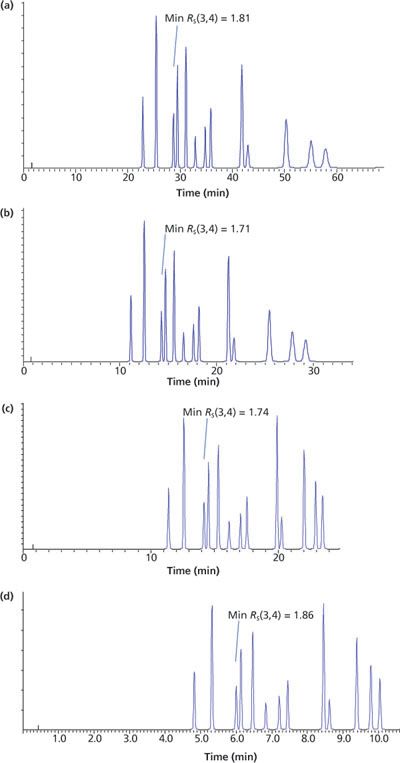
Figure 1: (a) Simulated separation of pesticides under the gradient conditions outlined above. (b) Pesticide separation with F = 2 and tG = 15 (Gs constant). (c) Pesticide separation with F = 2 and ΔΦ = 80 (Gs constant). (d) Pesticide separation with Vm = 0.19, ΔΦ = 60, F = 0.5 mL/min, tG = 10 min (Gs constant).

Figure 1(a) shows the initial chromatogram with a very long run time and poor signal to noise for the diffuse (broad) later eluted peaks. We can speed up this method and hopefully retain good selectivity and resolution in the simplest way by doubling the flow rate; however, to keep the gradient steepness constant then we could, for example, halve the gradient time (tG) (F = 2 and tG) = 15) (Figure 1[b]).
Another very convenient way to speed up the separation is to double the gradient range (ΔΦ = 80), which would mean using a gradient range of 20–100% B. This can also be compensated to keep Gs constant by doubling the flow rate (F = 2) - the result of which is shown in Figure 1(c). When translating to smaller column dimensions, we also have a range of choices to keep the adjusted gradient steepness constant. Here we switch to a 100 mm × 2.1 mm, 2.7-µm superficially porous particle column with a Vm of 0.19 mL. We used a low-dead-volume ultrahigh-pressure liquid chromatography (UHPLC) system to rapidly mix a 20–80% B gradient in 10 min with a flow rate of 0.5 mL/min. Gs = 0.19 × 60/0.5 × 10 Vm = 0.19, ΔΦ =60, F = 0.5 mL/min, tG = 10 min Gs = 2.28 Using the corrected gradient steepness (Gs), which allows us to maintain the %B per column volume rate of change, we were able to achieve a sixfold reduction in analysis time without compromising the quality of the separation as measured by the minimum resolution of any peak pair. Reference 1. L.R. Snyder, J.J. Kirkland, and J.L. Glajch, Practical HPLC Method Development (Wiley, New York, USA, 1997).

Characterizing Plant Polysaccharides Using Size-Exclusion Chromatography
April 4th 2025With green chemistry becoming more standardized, Leena Pitkänen of Aalto University analyzed how useful size-exclusion chromatography (SEC) and asymmetric flow field-flow fractionation (AF4) could be in characterizing plant polysaccharides.
Investigating the Protective Effects of Frankincense Oil on Wound Healing with GC–MS
April 2nd 2025Frankincense essential oil is known for its anti-inflammatory, antioxidant, and therapeutic properties. A recent study investigated the protective effects of the oil in an excision wound model in rats, focusing on oxidative stress reduction, inflammatory cytokine modulation, and caspase-3 regulation; chemical composition of the oil was analyzed using gas chromatography–mass spectrometry (GC–MS).


