Distorted Peaks — A Case Study
What are possible causes for distortion of the first two peaks in a chromatogram?
What are possible causes for distortion of the first two peaks in a chromatogram?
This month’s “LC Troubleshooting” discussion centres on a reader’s question about a liquid chromatography–mass spectrometry separation using a triple-quadrupole mass spectrometer (LC–MS–MS). Because of the proprietary nature of the sample, the reader asked me not to reveal all the details, so I’ve somewhat obfuscated the description. From the details I was given, I surmise that the samples comprise amino acids or peptides. The complaint was that the analysis of reference standards gave an acceptable chromatogram, but when plasma samples were run, the first two peaks were badly distorted. Some kind of matrix effect was suspected, perhaps a salt coeluted with the analytes, so the conditions were adjusted to increase the retention time a bit, but the problem persisted, so she contacted me.
Background
As mentioned above, the method was run on an LC–MS–MS system. The column dimensions were 150 mm × 3.0 mm, and it was packed with 3-µm C18 particles. Solvent A was 10% acetonitrile–90% water with 0.1% formic acid; B was 90% acetonitrile–10% water with 0.1% formic acid. A multistep gradient was run from 10% B to 100% B over 11 min at a flow rate of 0.4 mL/min. The injection volume was not specified.
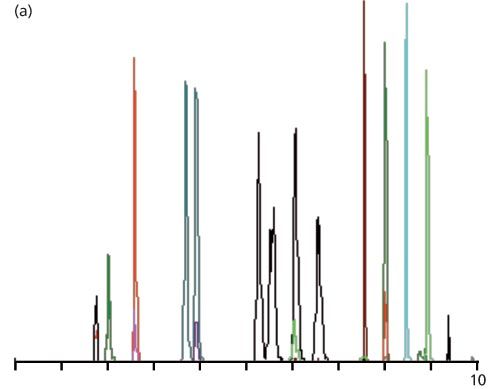
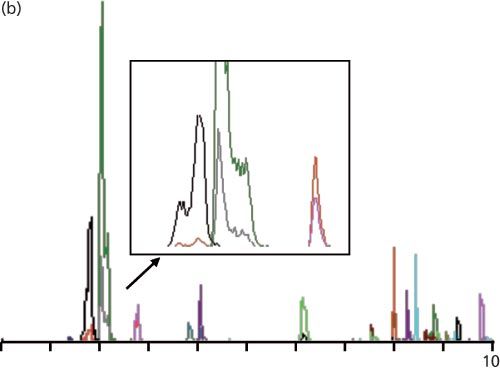
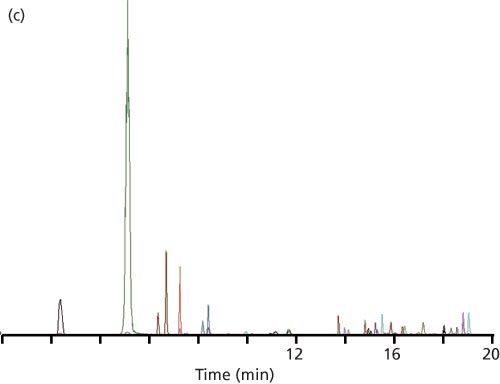
Figure 1: Example LC–MS–MS chromatograms: (a) Injection of reference standards under the initial conditions; (b) injection of a plasma-based sample with expansion of the first three peaks (from a similar sample); (c) same as (b), but with a mobile phase containing methanol instead of acetonitrile.
When reference standards were run under the above conditions, the chromatogram looked like that of Figure 1(a). I’m not sure what the different colours mean, but I suspect that when two different coloured peaks overlap that these represent two different analytes that have been coeluted, but have sufficiently different spectra that the MS–MS system can distinguish between the two. The increased peak widths for the black peaks in the 5–7 min region are a result of an isocratic hold in this portion of the run. The peak shape and peak widths look acceptable to me based on the information I was given. The first peak had a recorded retention time of 1.72 min.
Plasma samples were prepared in an unspecified manner. When these samples were injected, chromatograms such as that shown in Figure 1(b) were seen. You can see that the first peak pair, which was nicely separated in Figure 1(a), is now marginally separated and is distorted. I’ve included an expanded view of the first three peaks to show an especially bad sample. The first two peaks (grey and green) are distorted badly, whereas the third peak (pink) tails somewhat, but otherwise looks acceptable. The first peak had a recorded retention time of 1.75 min.
The reader suspected that a matrix effect might be causing the problem. Specifically, she thought it might be a salt that was eluted along with the analyte. To test this, she adjusted the conditions so that the first peak was eluted at 2.1 min, but this did not correct the problem.
First-Pass Diagnosis
I heard my good friend, Jack Kirkland, once say that if all problem chromatograms were adjusted so that the first peak came out with a retention factor, k, of at least 1.0, half of the problems would be solved. Although I think this is a bit of an oversimplification, there is a lot of truth in the statement. The reason is that peaks that are eluted too close to the column void are subject to distortion by the injection solvent and interference by unretained materials in the sample. Furthermore, retention reproducibility tends to be much worse when k <1 is observed. As a result, whenever I am sent problem chromatograms, one of the first things that I do is determine the retention factor of the first peak of interest. It is amazing how often low k-values are part of the source of chromatographic problems. Let’s see what’s happening for the present case.
Before I begin, let me acknowledge that this is a gradient, so the isocratic calculations I am using here are not completely appropriate. However, often the first peaks in a gradient separation are eluted exclusively or significantly in the isocratic segment created by the washout of the system dwell volume. I’m assuming this is the case for the present example.
You’ll recall that the retention factor, k (also called the capacity factor, k′) is calculated as:
k=(tR – t0)/t0 [1]
where tR is the retention time and t0 is the column dead time (also abbreviated tm). We have the retention time from the chromatogram, but a “solvent front” t0 disturbance is not visible, as usually is the case with LC–MS–MS chromatograms. We will have to estimate t0 from the column volume, Vm (in millilitres), and flow rate, F (in millilitres per minute):
Vm ≈ 0.5Ldc2/1000 [2]
where L is the column length
(in mm) and dc is the column
internal diameter (in mm). The column volume is converted to t0 as follows:
t0=Vm/F [3]
So in the present example, L = 150 mm and dc = 3.0 mm, giving Vm ≈ 0.68 mL. At a flow rate of 0.4 mL/min, t0 = 1.7 min. (My usual caution applies here: I’ve rounded numbers as I go in the discussion, so your answers may differ a bit if you replicate my calculations.)
Now we can use equation 1 to calculate k = 0.02, certainly <<1.0! So, at this point, it is quite likely that the problems have something to do with peaks that are eluted too early in the chromatogram. One potential problem with early-eluted peaks is that they can be distorted by other materials eluted at t0. Let’s see how this might create problems both with LC–MS–MS and LC with ultraviolet (UV) detection.
Figure 2: Illustration of ion suppression in LC–MS–MS: (a) Constant infusion of paclitaxel with injection of blank extracted plasma and hand-drawn t0 peak as would be seen in a LC–UV chromatogram; (b) normal LC–MS–MS chromatogram of paclitaxel and two metabolites.
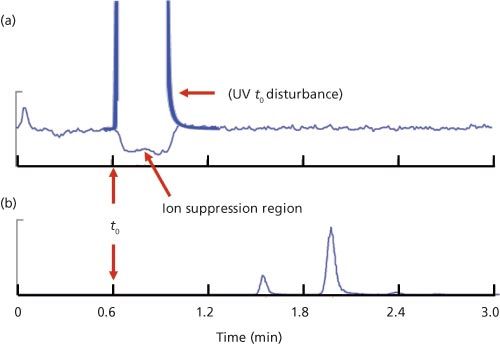
LC–MS–MS, especially with an electrospray ionization (ESI) interface, is subject to a process called ion suppression. This occurs when something is eluted from the LC column at the same time as the analyte of interest and suppresses or reduces its ionization efficiency. In most LC–MS runs, this occurs in the t0 region and is easily evaluated with an infusion experiment. In this experiment, a solution containing a pure sample of the analyte is infused continuously into the LC mobile phase through a tee fitting mounted between the column exit and the MS interface. This continuous infusion results in a constant concentration of analyte reaching the detector and appears as a flat, elevated baseline. You can see an example of this in Figure 2(a) for the infusion of a paclitaxel standard infused into the mobile phase; the baseline from approximately 1.2 min to the end of the chromatogram is typical of the high, steady baseline.
Next, a blank extracted sample is injected into the LC system and run in the normal manner. Anything that is eluted that suppresses the ionization of the analyte will reduce the analyte signal. This reduced signal might be caused by salts in the sample that are eluted early, as suspected by the reader. This suppression region usually occurs at t0, and depending on the nature of the sample matrix and sample pretreatment technique, may result in negative peaks elsewhere in the chromatogram, as well. For the example of Figure 2, there is extensive sample cleanup, so only the t0 disturbance is seen, as indicated in Figure 2(a). With LC–UV, ion suppression doesn’t occur, but there is usually a large, positive peak at t0; I’ve drawn this in for Figure 2(a) to show where this might occur and how it would look. In both LC–MS–MS and LC–UV, we don’t want analyte peaks to be eluted in this region of instability at t0 or peak distortion can occur and retention or peak area reproducibility can suffer. This is one reason that we want the first peak of interest to be eluted at k ≥ 1, or better k ≥ 2. For Figure 2, t0 ≈ 0.6 min, so a peak with k = 1 would have a retention time of approximately 1.2 min. You can see in the chromatogram of Figure 2(b) that paclitaxel (tR ≈ 2) and its two metabolites (tR ≈ 1.6 and 2.4 min) are all eluted with k > 1, well after the ion suppression region.
Another potential problem that is magnified when peaks are eluted too early has to do with the choice of injection solvent and the injection volume. I didn’t receive any information about either of these factors for the present case study, so I can only speculate. Ideally, we should inject LC samples in a solvent that matches the composition of the mobile phase for isocratic runs or the starting mobile phase condition for gradient runs. It is usually alright to inject samples in a weaker solvent (less organic solvent for reversedâphase). However, stronger solvents (more organic than the mobile phase) tend to flush the sample rapidly through the first part of the column until it gets diluted to the mobile-phase composition; this process can cause broad, split, doubled, or distorted peaks. This distortion is usually worse for early eluted peaks and less obvious or absent for later peaks. Too large of an injection volume can cause similar problems. Examination of Figure 1(b), and especially the expanded view in Figure 1(b), highlights the distortion problem for the first two peaks, whereas the third and subsequent peaks look normal, so injection problems may also contribute to the observed peak distortion.
How large of an injection can be tolerated? The rule of thumb is that you can inject up to 15% of the volume of the first peak of interest without disturbing the peak shape if you inject in mobile phase. To get an idea of what this means in the present case, we can estimate the peak volume from the data provided. We can do this by estimating the column plate number, N, and using the retention time to determine the peak volume.
First, we need to estimate N from the column length, L, in millimetres and particle diameter, dp, in micrometres:
N ≈ 300L/dp [4]
This gives a realistic plate number for real samples. For our 150-mm-long, 3-µm dp column, we get N ≈ 15,000. Next, we need to determine the peak width:
N = 16(tR/w)2 [5]
where w is the peak width at baseline. We can rearrange this equation to:
w = 4tR/N0.5 [6]
For the conditions of Figure 1, the first peak has a retention time of 1.72 min. With equation 6, this yields a peak width of 0.056 min. We can convert this to peak volume, Vp, by multiplying by the flow rate, 0.4 mL/min, to get 0.022 mL or 22 µL. If we are allowed up to 15% of this volume for injection, we can inject up to 3.4 µL (see the first row of Table 1). This is a small injection, even for LC–MS analyses. Although we don’t know what injection volume was used for this experiment, I suspect it was 5 µL or more, so injection volume, perhaps injection solvent, and likely ion suppression all may be contributing to the peak distortion problem.
Mitigating the Problem
The reader indicated that changing the initial mobile phase conditions resulted in an increase in retention time of the first peak to 2.1 min, but the change did not fix the problem. This increased the k-value by an order of magnitude, from 0.02 to 0.24 and marginally improved the allowed injection volume from 3.4 to 4.1 µL (Table 1). Further reductions in the percentage of acetonitrile in the starting solvent did not seem to help.
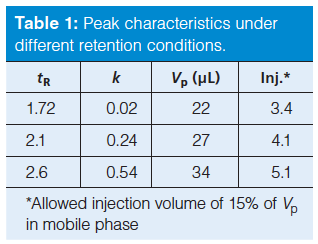
At this point, the reader decided to change from acetonitrile as the mobile phase organic solvent to methanol. Methanol, being a weaker solvent for reversed-phase LC, is expected to give larger retention times for the same percent organic. This increased the retention of the first peak to 2.6 min and doubled the k-value again, to 0.54. Although this is still less than the desired k ≥ 1, the first two peaks looked normal, correcting the problem, as you can see by the chromatogram of Figure 1(c). The allowed injection volume also increased slightly to 5.1 µL (Table 1).
Conclusions
Let’s review what was done to correct the problem and see if we can more confidently identify the problem source. We speculated that one or more of three possible causes created the problem of distorted peaks with poor reproducibility of peak area for the first two peaks in the chromatogram. These candidates are the injection volume, the injection solvent, and interferences by unretained material at t0. There was no indication from the reader what injection volume or injection solvent was used, and because it was not mentioned anywhere in the discussion, it is safe to assume that the injection conditions remained unchanged. If we assume that the reference standards were injected in the same solvent and volume as the analytical samples, it is unlikely that we would see good looking peaks for the standards (Figure 1[a]), but not for samples in plasma (Figure 1[b]). This also strongly suggests that the presence of plasma components played a major role in the peak distortion. If the problem was a result of the injection solvent or volume, either alone or in combination, I would expect that it would get worse with methanol as a mobile-phase solvent, not better, because methanol is a weaker solvent than acetonitrile, so constant injection conditions should magnify the problem.
This leaves the most likely candidate for the problem as ion suppression or interferences with unretained material in the sample. The improvement of method performance with an increase in retention supports this hypothesis, because stronger retention could move the first peaks of interest away from the potential unretained interferences. The increased retention also allows for somewhat larger injection volumes before peak shape problems are expected, so this may play a role, as well.
Unfortunately, this is one of those cases where the “rule of one” - change one thing at a time - wasn’t strictly followed, so it is hard to be completely confident in assigning the root cause of the problem. It would have been nice to either increase the retention with acetonitrile as a solvent or to have a reference point where methanol was used as the mobile-phase solvent, but at a high enough concentration to give the same retention times as were observed in acetonitrile. With a simultaneous change to methanol and increase in retention, two changes were made, so either (or a combination) could be responsible. One other potential problem when changing from one mobile-phase solvent to another for a reasonably complex separation, as in the present case, is that the relative peak positions may change enough to cause new peak overlaps or reversals (compare Figures 1[b] and 1[c]). This is not as much a problem with LC–MS–MS, where the specificity of the detector can provide quantitative information, even for overlapping peaks. For LC–UV it is likely that major problems would be encountered with peak overlap if the same change was made. Another good test would have been to check for ion suppression using an infusion experiment, such as that shown in Figure 2(a).
As is the case with many such problem solving episodes in which I’m involved, after the problem is solved, I either hear nothing more or the user doesn’t want to do any more work to elucidate the “why” of the solution. The fact that method changes were not made in a systematic and controlled manner confuses the conclusions that we draw. Usually it takes more time to make one change at a time and observe the results, but this initial investment of time is often paid back in the future because you will have a better understanding of what controls the separation so you can make adjustments more quickly and efficiently next time there is a problem.
John Dolan is vice president of LC Resources, Walnut Creek, California, USA. He is also a member of LCGC Europe’s editorial advisory board. Direct correspondence about this column should go to: “LC Troubleshooting”, LCGC Europe, Honeycomb West, Chester Business Park, Wrexham Road, Chester, CH4 9QH, UK, or e-mail the editor-in-chief, Alasdair Matheson, at amatheson@advanstar.com

Maximizing Cannabinoid Separation for Potency Testing with LC
April 7th 2025Researchers from the Department of Chemistry at Western Illinois University (Macomb, Illinois) conducted a study to optimize the separation of 18 cannabinoids for potency testing of hemp-based products, using liquid chromatography with a diode array detector (LC–DAD). As part of our monthlong series of articles pertaining to National Cannabis Awareness Month, LCGC International spoke to Liguo Song, the corresponding author of the paper stemming from this research, to discuss the study and its findings.
How Many Repetitions Do I Need? Caught Between Sound Statistics and Chromatographic Practice
April 7th 2025In chromatographic analysis, the number of repeated measurements is often limited due to time, cost, and sample availability constraints. It is therefore not uncommon for chromatographers to do a single measurement.


