GCxGC–TOF-MS Complements Passive Sampling for the Screening of Pollutants in Water
Special Issues
A carefully chosen analytical technique can enhance the inherent advantages of passive sampling of watercourses over more traditional "grab" or "spot" sampling.
Two-dimensional gas chromatography–time-of-flight mass spectrometry (GC×GC–TOF-MS) is a valuable analytical method for use with passive sampling techniques for the detection of pollutants in water. With this method, it is possible to separate components that would be coeluted in one-dimensional GC, resulting in improved confidence in identification of pollutants. The combination of passive sampling and TOF-MS ensures high sensitivity, and the information-rich datasets mean that the method can be applied to the detection of nontarget compounds with little additional effort.
In the last decade, regulators have faced increasing demands to protect and enhance water quality. In the European Union, these demands have led to the Water Framework Directive (WFD) for surface water, groundwater, and coastal waters, and the Marine Strategy Framework Directive for marine waters (1,2).
The majority of analytes of concern in water are organic compounds, most of which are sufficiently volatile to be amenable to analysis by gas chromatography–mass spectrometry (GC–MS). Clearly, it is desirable to be able to monitor all such analytes in a single run using one analytical method, but the legislative demand for increased sensitivity and wider analyte scope requires a fresh look at the sampling and analytical methods used.
Passive sampling exhibits considerable promise in this respect by concentrating pollutants within the sampler over time, and thus indirectly lowering detection limits (3,4). It also allows for the detection of trace (yet toxicologically relevant) contaminants over extended periods of time. Samplers can be deployed over extended periods, typically four weeks in a river system, providing a better estimate of a compound's mass loading on a watercourse and also substantially increasing the likelihood of capturing pollution events.
Previous work examined the use of two passive samplers — a semipermeable membrane device (SPMD) and a polar organic chemical integrative sampler (POCIS) — for determining the presence of pollutants in groundwater, and found that they provided an improvement on the results obtained with conventional grab-sampling techniques (5). Such samplers are thus especially useful in investigative monitoring work, where there is no guarantee that the compounds giving rise to poor water quality will be on a target list.
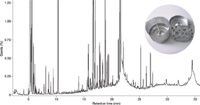
Figure 1: Analysis of river water by GCâMS passively sampled by a semipermeable membrane device (SPMD) deployed for 4 weeks.
SPMDs are used to monitor nonpolar organic compounds (defined as those with a log Kow >3) with a maximum cross-sectional diameter of 1 nm and a molecular mass less than 600 Da. Hydrophobic compounds such as polycyclic aromatic hydrocarbons (PAHs), polychlorinated biphenyls (PCBs), and organochlorine pesticides in the dissolved state (that is, those that are readily bioavailable) will partition into the SPMD and become concentrated over time.
To demonstrate the high compound loading and complexity of GC–MS chromatograms resulting from this sampling technique, Figure 1 shows the results obtained from GC–MS analysis of water sampled using an SPMD passive sampler from the River Loughor in South Wales, UK.
The complexity of such extracts presents a tough analytical challenge for one-dimensional (1D) GC, particularly in the detection of closely eluted compounds and the identification of trace-level nontargets ("unknowns"). Clearly, therefore, reaping the full benefits of passive samplers requires a reassessment of the traditional GC–MS approach.
In recent years, comprehensive two-dimensional GC (2D GC or GC×GC) has received increased attention for the analysis of complex samples, particularly in the areas of petrochemicals (6) and food analysis (7). The greater separation space available provides considerable advantages over 1D GC, and GC×GC is increasingly finding applications in mainstream analytical situations. We therefore realized that GC×GC could be an ideal approach to the problem of analyzing passively sampled pollutants in watercourses.
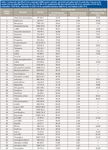
Table I: Compounds identified from a deployed SPMD passive sampler, extracted and spiked with 55 pesticides. Present in the sample but not identified by either GCÃGCâTOF-MS or GCâquadrupole MS were dimethoate (60-51-5), cyanazine (21725-46-2), endosulfan I (959-98-8), endosulfan II (33212-65-9), pentachlorobenzene (608-93-5), and triallate (2303-17-5).
The choice of GC×GC also naturally influences the mass spectrometer used. Although triple-quadrupole instruments are widely used for applications where sensitivity is paramount, time-of-flight (TOF) instruments are widely regarded as preferable for GC×GC applications. This is largely because of their inherently high scan rates (thousands of spectra accumulated per second), which allow them to handle the very narrow peaks produced by the second GC column. For this application, our desire for an analytical system able to identify targets and nontargets constrained our choice of TOF instrument to one able to produce spectra closely matching those in the National Institute of Standards and Technology (NIST) database. Table I gives an example of the sort of enhancement that can be achieved, by comparing the analysis of a spiked blank sample using GC×GC–TOF-MS with that using GC–quadrupole MS.
This paper discusses the results of our investigations, and examines the benefits of passive sampling combined with GC×GC–TOF-MS for the identification of pollutants in watercourses.
Experimental
Preparation of Standard Solutions
A standard solution (10 ng/µL) was prepared from custom mixes of polychlorinated biphenyls (Restek), PAHs (SPEX CertiPrep), and organochlorine, organophosphate, and triazine pesticides (Restek). (See Table I for the full list of compounds in the mixture.)
Passive Sampling
Standard-size SPMDs (91.4 cm × 2.5 cm low-density polyethylene tubing of 70–95 µm wall thickness) containing 1 mL of triolein were spiked with fluorene-d10, phenanthrene-d10 , and pyrene-d10 (all at 10 µg) as performance reference compounds (Environmental Service Technologies). The SPMDs were shipped in gas-tight metal tins flushed with argon and were kept at –18 °C until deployed.
SPMD Deployment and Retrieval
At the sampling site, the SPMD was placed onto a stainless steel holder and then into a stainless steel protective cage for rapid deployment (to minimize exposure to atmospheric contaminants). A field blank was used at the deployment site to account for contamination during transport to and from study sites and exposure to airborne contaminants during the deployment and retrieval periods.
After four weeks' exposure in the river, the SPMD was retrieved and sealed in the same tin as used for shipping to the field. Exposure periods across sampling sites were recorded. The frozen SPMDs including field blanks were shipped back to the laboratory and stored frozen until extracted.
Extraction of SPMD
Following removal of surface biofouling using n-hexane, gentle brushing with a soft toothbrush, and immersion in dilute acid, the surfaces of the SPMD were rinsed with water, acetone, and finally propan-2-ol. It was subsequently dialyzed twice in n-hexane at 18 °C (for 18 h and 6 h), and the combined dialysates were reduced to about 3 mL.
The dialysates were subjected to cleanup using size-exclusion chromatography (SEC) using an Agilent 1200 series HPLC system (Agilent Technologies). The SEC column was a 300 mm × 21.2 mm PL Gel column (10 µm particle size, 100 Å pore size), equipped with a 50 mm × 21.2 mm PL Gel guard column (Agilent Technologies). The mobile phase was 1:1 (v/v) n-hexane–dichloromethane, with a flow rate of 5 mL/min.
SEC-cleaned extracts were evaporated to 500 µL using a Turbovap (Biotage) under a flow of nitrogen at 40 °C, made up to 1 mL using n-hexane, and split into two equal portions. The first was transferred to a 2-mL GC autosampler vial, and the second was spiked with 5 µL of the standard solution.
Analysis
Extracts were analyzed using a BenchTOF-dx TOF-MS system (ALMSCO International) and a model 7890A GC system (Agilent Technologies) fitted with a ZX1 cryogenic modulator (Zoex Inc.). Oven programming and modulation parameters were adjusted to yield a wide analyte volatility range and high peak capacity.
The system used a PTV injector, a 1.8-mm i.d. baffled liner, helium carrier gas with a constant flow at 1.5 mL/min. The injection was performed in splitless mode for 2 min (then 100 mL/min purge). The temperature program was as follows: 60 °C for 0.05 min, 300 °C/min to 320 °C (1 min), 720 °C/min to 360 °C (cleaning phase) held to end of run. A 3-mL/min septum purge flow was used.
The first-dimension column was a 30 m × 0.25 mm, 0.25-µm df SGE BPX5 column, and the second-dimension column was a 3 m × 0.1 mm, 0.1-µm df SGE BPX50 column. The modulation loop was the same as for the second dimension. The column set used equivalent pneumatic impedance to 60 m × 0.2 mm (calculated from impedance factor look-up charts for first- and second-dimension columns used).
GCևC oven temperature program and modulation was as follows: main oven: 50 °C (2.0 min), 5 °C/min to 320 °C (8 min); secondary oven: not applicable; hot jet: 150 °C (2.0 min), 5 °C/min to 400 °C (hold time matched to total run time); cold jet: Dewar fill high 60%, Dewar fill low 50%; cold jet flow: 15 L/min; modulation period: 5 s; hot-jet pulse 350 ms; total run time: 64 min.
The TOF-MS settings were as follows: filament voltage: 1.6 V; ion source: 300 °C; transfer line: 300 °C; mass range: 40–500 amu; data rate: 50 Hz.
The platform-neutral software package GC Image (Zoex, Inc.) was used to process the native TOF-MS data.
Results and Discussion
The results of the GC×GC analysis of the spiked and unspiked SPMD extract are shown in Figure 2. In both cases, notice the large number of components present, and the good separation in both dimensions. This allows the identification of compounds that would have been problematic in 1D GC because of coelution. The extra complexity of the spiked sample is demonstrated by the insets.
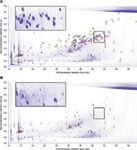
Figure 2: Analysis of (a) spiked and (b) unspiked extract from an SPMD passive sampler, with insets showing the same zoomed-in region (with contrast enhanced). In the spiked sample, representative PCBs, PAHs, and pesticides are indicated by red, yellow, and blue circles respectively.
Polychlorinated Biphenyls
PCBs were formerly used in many countries for a variety of purposes in industrial processes and in household products. Although now largely banned for many purposes, their continued use in certain situations and their environmental persistence means that contamination of watercourses may still occur.
Because the PCBs in the SPMD extract are chemically similar to each other, they cover a well-defined region of the 2D chromatogram. Assignment of chlorination level was readily achievable, and Figure 3 shows an overlay of extracted-ion chromatograms for molecular ions of 22 dichloro- to heptachlorobiphenyls.
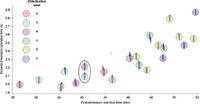
Figure 3: Two-dimensional contour plots of the spiked extract from the SPMD passive sampler, with chlorinated biphenyls indicated by circles colored by chlorination level. The circle highlights what would be a coelution in one-dimensional GC.
It is clear from Figure 3 that the second dimension has produced a significant improvement in separation. This level of speciation is important because of the need to report individual PCB congeners, not just isomeric groups, to environmental regulators. A case in point is the separation of a trichlorobiphenyl and a tetrachlorobiphenyl, which are coeluted (circled). Automated identification of these compounds with a 1D column setup would probably have required multiple runs under different conditions, so as to separate the compounds rather than having to rely on deconvolution. In addition, quantitation using extracted-ion chromatograms would have been compromised by the fact that these compounds have a number of shared ions in their electron ionization mass spectra.
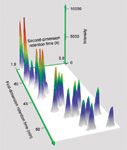
Figure 4: Three-dimensional surface plot showing the overlaid extracted-ion chromatograms for the molecular ions of dichloro- to heptachloro-biphenyls (m/z 222, 256, 292, 326, 360 and 394, each ±1 amu) for the spiked watercourse sample.
An additional feature worth noting is the peak shape (Figure 4), indicating the quality of the chromatography and the column modulation.
Polycyclic Aromatic Hydrocarbons
PAHs result from the incomplete combustion of organic substances, and have long been recognized to be harmful to human health. They are prone to bioaccumulate in fatty tissues, and their prescribed maximum values in drinking water are correspondingly low (8). Drinking water can become contaminated with PAHs from a variety of sources, including leachate from linings in water storage tanks and pipelines.
Figure 2 shows that 36 PAHs were identified in the spiked SPMD extract. As with PCBs, separation of individual compounds and isomers is highly desirable, so it is reassuring that all the PAHs are well separated.
One feature of the chromatogram is the wrap-around of five PAHs (at the right-hand side of Figure 2). Such wraparound is not an uncommon feature of GC×GC analyses when detecting analytes with high boiling points that are highly retained on the secondary GC column. Although undesirable, wrap-around usually is not detrimental to the quality of the analysis; in most cases it can be remedied by using a separate oven for the second GC column, with an increasing temperature offset during the course of the analytical run, so that higher-boiling compounds do not wrap around.
Pesticides
There are currently around 350 products approved for use as agricultural pesticide products in the UK, covering a wide range of structural classes. Given the continued widespread use of pesticides and their inherent toxicity, being able to monitor pesticides reliably and easily is an essential requirement for any analytical protocol.
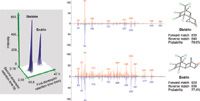
Figure 5: Three-dimensional surface plot showing dieldrin and endrin, and comparison of the obtained mass spectra (red, top) with the NIST 2011 library spectra (blue, bottom).
A selection of the 40 pesticides identified in the spiked SPMD extract are highlighted in Figure 2. Many pesticides have complex mass spectra with many fragment ions and low-intensity molecular ions, making identification difficult. In this case, the ability of TOF-MS to produce mass spectra closely matching those in the NIST spectral database was a key factor in its selection. This is illustrated by the mass spectra of dieldrin and endrin in Figure 5.
Screening of Unknowns
It is increasingly important for those in the water industry, and regulators in particular, to be aware of the potential for emerging contaminants to lead to poor water quality. Musks are one such group, being widely used in detergents and personal hygiene products. They are currently unregulated in the UK, but concerns over potential health effects (especially for polycyclic musks) have led to a desire for their presence in watercourses to be monitored, thus placing regulators in a strong position to inform potential future policy.
When nontarget ("unknown") contaminants are present at low levels in complex matrices, investigation using existing analytical approaches can be a laborious task, with little guarantee of success. Therefore, it is highly desirable for the analytical method to be capable of identifying unknowns with the minimum of additional effort.
The high data capture rate of TOF-MS makes it inherently suitable for the identification of nontarget peaks without recourse to a targeted GC–MS run, so it was of particular interest to apply our method to the nontarget peaks in our deployed SPMD sampler. Figure 6 illustrates what can be achieved, by showing the detection of several polycyclic musks.
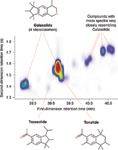
Figure 6: Combined two-dimensional extracted-ion chromatograms for m/z 215, 229, 243, and 258, showing identification of four stereoisomers of Galaxolide, four compounds with mass spectra very closely resembling Galaxolide, Traseolide, and Tonalide.
Conclusions
In conclusion, we have demonstrated in this article that a carefully chosen analytical technique can enhance the inherent advantages of passive sampling of watercourses over more traditional "grab" or "spot" sampling. In particular, the higher compound loadings resulting from the SPMD are satisfactorily dealt with by GC×GC, allowing separation of compounds that would otherwise be coeluted. The high data rate and sensitivity of TOF-MS makes it the natural partner to GC×GC, and in addition, the technique's ability to produce high-quality mass spectra enhances confidence in compound identification.
For the analyst, these features translate into the ability to detect a range of compounds of widely varying concentrations from a single analysis. Here, as well as identifying individual chemicals in three important groups (PCBs, PAHs, and pesticides), we were able to confidently identify unknowns with minimum additional effort. This makes the method as a whole suitable for investigative work — such as screening for emerging contaminants — as well as target-focused studies.
References
(1) European Commission, The European Water Framework Directive (WFD; 2000/60/EC) (http://eur-lex.europa.eu/LexUriServ/LexUriServ.do?uri=OJ:L:2000:327:0001:0072:EN:PDF).
(2) European Commission, The European Marine Strategy Framework Directive (MSFD; 2008/56/EC) (http://eur-lex.europa.eu/LexUriServ/LexUriServ.do?uri=OJ:L:2008:164:0019:0040:EN:PDF).
(3) J.N. Huckins, M.W. Tubergen, and G.K. Manuweera, Chemosphere 20(5), 533–552 (1990).
(4) D.A. Alvarez, J.D. Petty, J.N. Huckins, T.L. Jones-Lepp, D.T. Getting, J.P. Goddard, and S.E. Manahan, Environ. Toxicol. Chem. 23(7), 1640–1648 (2004).
(5) A. Gravell, G.A. Mills, and W. Civil, LCGC Europe 25(8), 404–416 (2012).
(6) T.C. Tran, G.A. Logan, E. Grosjean, D. Ryan, and P.J. Marriott, Geochim. Cosmochim. Acta 74(22), 6468–6484 (2010).
(7) J. Dallüge, M. van Rijn, J. Beens, R.J.J. Vreuls, and U.A.Th. Brinkman, J. Chrom. A 965(1–2), 207–217 (2002).
(8) Drinking Water Inspectorate (DWI). The Water Supply (Water Quality) Regulations 2000 (England and Wales).
Anthony Gravell and Praveen Kutty are with the Llanelli Laboratory at the Environment Agency Wales in Llanelli, Wales, UK.
Graham Mills is with the School of Pharmacy and Biomedical Sciences at the University of Portsmouth, in Portsmouth, UK.
David Barden and Steve Smith are with ALMSCO International at the Gwaun Elai Medi Science Campus in Llantrisant, Wales, UK.
Direct correspondence to: enquiries@almsco.com and anthony.gravell@environment-agency.wales.gov.uk

Analysis of Pesticides in Foods Using GC–MS/MS: An Interview with José Fernando Huertas-Pérez
December 16th 2024In this LCGC International interview with José Fernando Huertas-Pérez who is a specialist in chemical contaminants analytics and mitigation at the Nestlé Institute for Food Safety and Analytical Sciences at Nestlé Research in Switzerland, In this interview we discuss his recent research work published in Food Chemistry on the subject of a method for quantifying multi-residue pesticides in food matrices using gas chromatography–tandem mass spectrometry (GC–MS/MS) (1).
The Use of SPME and GC×GC in Food Analysis: An Interview with Giorgia Purcaro
December 16th 2024LCGC International sat down with Giorgia Purcaro of the University of Liege to discuss the impact that solid-phase microextraction (SPME) and comprehensive multidimensional gas chromatography (GC×GC) is having on food analysis.


