GCxGC with Fluidic Modulation on Enantioselective Oil Analysis
LCGC Europe
Describes a novel approach for the enantioselective separation of spearmint oil incorporating a fluidic modulation system.
Properly informed column selection greatly simplifies the process of method development and provides greater flexibility in instrument settings for comprehensive two-dimensional gas chromatography (GC×GC) with fluidic modulation. In the present investigation a long (20 m) narrow-bore (0.10 mm i.d.) column was used in the first separation dimension. In this way, the separation column itself provided sufficient pressure-drop to alleviate flow disturbance in the first dimension column caused by actuating the modulator valve. The use of a narrow-bore column in the first dimension is highly beneficial because it is also more suited to lower volumetric flow-rates and therefore permits use of a longer modulation period without causing sample loop breakthrough. Enantioselective separation of spearmint essential oil was performed to demonstrate performance of a fluidic modulation system.
Environmental monitoring in remote areas is of great interest and we have been working to determine the suitability of comprehensive two-dimensional gas chromatography (GC×GC) for this task. Conventional GC×GC instrumentation, which relies on thermal modulation (1), is not ideally suited for use in remote field laboratories, thus alternative modulation approaches have been investigated. One of these approaches is based on fluidic modulation, which was introduced by Seeley and co-workers in 2006 (2). The basic architecture of this fluidic modulation approach has been used in the design of the Agilent CFT Modulator (Agilent Technologies, Santa Clara, California, USA) (3). It is worth noting that the specific dimensions of the channels in the CFT device are not necessarily identical to those described by Seeley et al., but the fundamental approach is consistent. The monolithic structure of the CFT modulator and its use of leak-free SilTite ferrules (SGE Analytical Science, Ringwood, Australia) offer several advantages over homemade fluidic modulators. Notwithstanding, many investigators have found fluidic modulation using this device to be less than satisfactory and the limited number of publications using the technology may be partially ascribed to the difficulty in determining rugged modulation conditions.There are a few key considerations to optimizing GC×GC instrument settings for fluidic modulation. Some of these considerations are unique to the fluidic modulation and others are more generally applicable to GC×GC. Starting with the general considerations, a wide body of literature indicates that it is highly desirable to maintain a suitable modulation ratio (4). There is a rule of thumb [which has sound theoretical and practical underpinnings (5)] that suggests there should be four modulation slices across each first dimension peak. This rule of thumb ensures that peak capacity of the first dimension separation is not too greatly diminished by the modulation process. It is also highly desirable to minimize the extent of wraparound (6). Thus the elution window in the second dimension should not significantly exceed the modulation period. When the modulation period is exceeded there can be detrimental effects on resolution in the second separation dimension. There is often a practical compromise of each of these criteria, but the best GC×GC results typically come from carefully optimized systems that adhere strictly to both considerations. Stationary phase selection is a key consideration for all GC×GC approaches. Such considerations are addressed in detail elsewhere (7).
Among the important specific considerations for fluidic modulation, the critical consideration is that proper pneumatic conditions are applied in order to:
- ensure stop-flow modulation (at point X in Figure 1).
- provide sufficient time to sweep the modulator sample loop (Figure 1)
- prevent breakthrough from the sample loop during the modulation cycle.

Figure 1: Plan of a fluidic modulator, showing the sample loop (L), 3-way switching valve (V), connecting tubing and the connecting points of the first (Col 1) and second (Col 2) dimension columns.
In addition, a large volumetric flow ratio (column 2:column 1) has to be applied to assist peak-compression-in-time, which reduces the injection bandwidth into the second dimension column. Typically this flow ratio needs to be 10:1 or higher (8).
Maintaining appropriate pneumatic conditions, whilst satisfying the general considerations described above can be troublesome. An example drawn from the literature of fatty acid methyl esters analysis using fluidic modulation is shown in Figure 2 (9). In this example the instrument set-up comprised a first dimension separation column that had dimensions 30 m × 0.25 mm coupled to a second dimension separation column with dimensions 2 m × 0.25 mm. The film thickness of each column was 0.25 μm. The authors employed a column ensemble in which the first dimension column was coated with a 70% cyanopropyl polysilphenylene-siloxane stationary phase and the second dimension column was coated with a 5% polysilarylene/95% polydimethylsiloxane copolymer stationary phase. The most striking feature of this chromatogram is how the broad second dimension peaks sometimes fill the entire y-axis. The peak capacity of the second dimension is less than 1 in some places. The observed low performance may be a result of modulator breakthrough, incomplete flushing or a combination of both. These undesirable effects can be eliminated by informed column choice, along with appropriate instrument settings.
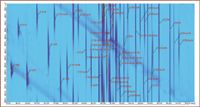
Figure 2: GCÃGCâFID 2D chromatogram of the standard mixture of 45 FAMEs (Reference 9, with permission).
The primary argument of the present article is that properly informed column choice greatly simplifies the process of method development and gives greater flexibility in instrument settings for fluidic modulation. Previously, Harvey et al. showed that is was possible to increase the modulation period to at least 9 s without adverse chromatographic affects (8) using a homemade fluidic modulation device. In the present investigation, the principles reported in earlier studies (8,10) have been applied with a CFT fluidic modulator. Enantioselective analysis of essential oils offers a good illustrative example of the benefit of multidimensional separations.
There are two options for performing enantioselective GC×GC separations. First, it is possible to follow the path laid by the myriad heart-cut enantio-MDGC applications for essential oils analysis (11) and use an achiral first dimension column coupled to an enantioselective stationary phase column in the second dimension. However, practical implementation of this approach is obstructed by the need for rapid second-dimension separations (12). The preferred approach is to use an enantioselective stationary phase column in the first dimension and follow this separation with one performed using an achiral stationary phase in the second dimension (13). The results from enantioselective GC×GC analysis of spearmint essential oil are presented here to highlight suitability of a fluidic modulation system for this dedicated application.
Methods
Enantioselective GC×GC analysis of spearmint essential oil was performed using an Agilent 7890A GC×GC instrument with CFT modulator and flame ionization detector (Agilent Technologies). The first dimension column was a 20 m × 0.10 mm i.d. capillary coated with a thin film (0.1 μm) of diethyl-t-butylsilyl β cyclodextrin in PS-086 stationary phase (Mega, Legnana, Milan, Italy). The first dimension column was connected to the CFT device using a SilTite ferrule (SGE Analytical Science, Victoria, Australia). The second dimension column was a 5 m × 0.25 mm i.d. capillary coated with a thin film (0.15 μm) of polyethylene glycol stationary phase (Agilent Technologies). The second column was connected to the CFT device using a SilTite ferrule. Carrier gas (H2) was supplied at a flow-rate of 0.4 mL/min (constant flow) in the first dimension from the split/splitless injector and 20 mL/min (constant flow) in the second dimension using the auxiliary pressure controller. The detector temperature was 280 °C and the injector was 230 °C. The injection volume was 1.0 μL throughout and a split ratio of 20:1 was employed for all analyses.
For qualitative comparison purposes, GC×GC analyses were also performed using a Shimadzu GC×GC system consisting of two independent GC2010 gas chromatographs, and a QP2010 Plus quadrupole mass spectrometer (Shimadzu, Kyoto, Japan). Data were acquired using the GCMS solution software (Shimadzu). The two GC ovens were linked through a heated (280 °C) transfer line. The primary GC (GC1) was equipped with an AOC-20i auto-injector and a split-splitless injector (280 °C). The first dimension column was a 25 m × 0.25 mm i.d. capillary coated with a thin film (0.25 μm) of diethyl-t-butylsilyl β cyclodextrin in PS-086 stationary phase (Mega). The second dimension column was a 1 m × 0.05 mm i.d. capillary coated with a thin film (0.25 μm) of polyethylene glycol stationary phase (Supelco). A modulator loop was formed using a 2 m × 0.25 mm i.d. uncoated column that was first passed through the heated transfer line between the two GC instruments. A dual-stage loop-type modulator (under license from Zoex Corporation, Houston, Texas, USA) was used for GC×GC analyses. The modulation period was 4 s and the duration of the hot pulse (325 °C) was 375 ms. Helium carrier gas was used at a constant flow-rate of 0.5 mL/min.
Results and Discussion
Harvey and co-workers showed by modelling the flow of carrier gas in a fluidic modulator that there is a distinct advantage of using a restrictor immediately before the sample loop (8). It is a critical performance criterion that the flow from the first dimension column is "stopped", otherwise modulation will be ineffective and the two separation columns will not be properly decoupled to permit GC×GC separation. However it is widely recognized that stop-flow is not a realistic expectation when the modulator valve is actuated. Instead, the direction of flow is reversed briefly upon valve actuation and the subsequent raising of the first dimension column outlet pressure. If the first dimension column has a low resistance to flow, then the direction of flow is affected along a significant length of the column. By using a restrictor column, with high resistance to flow, flow modelling showed that perturbation of flow in the first dimension separation column is limited to within the restrictor column. Practical implementation agreed with predicted enhanced modulator effectiveness (8).
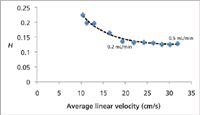
Figure 3: Experimental H/u curve justifies use of low first dimension flow rate. Plate height (H) was measured for n-C12 at 140 °C using calculated volumetric flow rates between 0.07 mL/min and 0.5 mL/min (H2).
In the present investigation the restrictor column (along with the corresponding connection in the GC×GC column ensemble) was eliminated and a long (20 m) narrow-bore (0.10 mm i.d.) column was used in the first separation dimension. In this way, the separation column itself provides sufficient pressure-drop to reduce flow disturbance in the first dimension and restrict the perturbation to a short length of the column. Using narrow-bore columns in the first dimension provides further benefit because their optimal performance is achieved at lower volumetric flow-rates (compared with wider-bore capillaries) and therefore permit use of a longer modulation period without causing sample loop breakthrough. To this end, it is interesting to determine how low the volumetric flow-rate can be without causing significant longitudinal diffusion and subsequent increase in plate height. The optimal carrier gas flow-rate is easily determined using the teachings of Blumberg and Klee (14) and a number of flow calculation software options are readily available for determining optimal pneumatic conditions in GC. Blumberg and Klee discuss two optimal pneumatic conditions, namely the efficiency optimized flow (EOF) and the speed optimized flow (SOF), which is higher than the EOF. In the present investigation the authors were interested in establishing a threshold lower than the EOF. Although using a sub-optimal flow-rate is generally considered foolish, for the specific case of fluidic modulation GC×GC, this compromise may be worthwhile if it improves the ruggedness of the instrument settings. It is a common belief that even a small departure from the default instrument settings for the CFT device can lead to sub-optimal modulation. Thus a series of injections were performed using an Agilent 6850 GC instrument (Agilent Technologies) to determine plate height (H) at different volumetric flow-rates for a 20 m × 0.10 mm i.d. Rtx-5 (0.10 μm df) column (Restek, Bellefonte, Pennsylvania, USA). Carrier gas (H2) was provided via the split/splitless injector. The detector temperature was 280 °C and the injector was 230 °C. Plate height was measured for n-C12 at 140 °C (k ~ 3) using calculated volumetric flow-rates between 0.07 mL/min and 0.5 mL/min (H2) corresponding to a linear velocity range spanning ca. 10 cm/s to ca. 32 cm/s using the 20 m column. The mean results (n = 3) are summarized in Figure 3. The H/u curve is remarkably flat between 0.2–0.5 mL/min (H2) so using flow-rates as low as 0.2 mL/min in a GC×GC setup is justifiable. Low first dimension flow-rates are further justified, as the injection bandwidth (w) into the second dimension column is a function of the modulation period (PM) and the flow ratio according to equation 1. Thus using a low first dimension column flow-rate may lead to improved observed performance in the second separation dimension by minimizing extra-column broadening in the second dimension separation column (10).

where 1F and 2F are the first- and second-dimension volumetric flow-rates respectively.
The dimensions of the internal sample loop in the CFT modulator are unknown, so optimization of instrument settings was performed by iterative approaches in the present investigation.
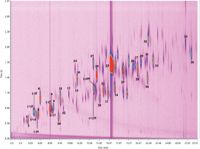
Figure 4: Two-dimensional separation space for the GCÃGC separation of spearmint essential oil using fluidic modulation. Refer to Table 1 for peak identities.
Essential oil analysis is made difficult by the wide dynamic range of the essential oil components. Spearmint essential oil is comprised of mono- and sesquiterpene hydrocarbons as well as mono- and sesquiterpene alcohols. Thus the sample components span a relatively wide volatility range and exhibit substantially different retention characteristics; consequently a relatively long modulation period is required to obtain a meaningful separation. In the present investigation, meaningful separation is achieved by extending the second dimension separation window to 3 s. While it could be argued that increasing the oven temperature would compress the second dimension elution window, this leads to a substantial loss of resolution in the second dimension column and should be avoided if possible. Figure 4 illustrates the GC×GC separation space from the fluidic modulation GC×GC system and the corresponding chromatogram from a thermal modulation GC×GC experiment is shown in Figure 5.
Although the two-dimensional peak capacity from the thermal modulation experiment is notably greater than that achieved by fluidic modulation, both results are highly satisfactory. A detailed comparison of the two approaches is beyond the scope of this discussion and the authors have not made any attempt to closely match the retention times in each system, but this comparison does permit one to draw an important conclusion; that appropriate column selection brings fluidic modulation into genuine contention as an alternative to thermal modulation GC×GC. A 3 s separation window provides adequate space with minimal wrap-around for separation of the terpenoid compounds present in the spearmint essential oil sample and the present column ensemble and flow arrangement easily permits a 3 s modulation period.
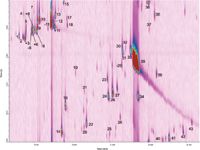
Figure 5: Two-dimensional separation space for the GCÃGC separation of spearmint essential oil using thermal modulation. Refer to Table 1 for peak identities.
Identification of the sample components was performed by GC×GC–MS and confirmed by injection of authentic reference standards; the identities of the separated components are reported in Table 1. Thirty-five terpenoid compounds were positively identified in the two-dimensional separation space. Extensive characterization was not attempted, although several other sample components were well resolved. Among the separated components, the individual optical isomers, including β-pinene, limonene, sabinene and terpinen-4-ol were resolved, both from one-another and from interfering sample components.

Table 1
Authentic reference standards of sufficient purity to perform quantitative analysis were available for three of these chiral compounds. Triplicate analyses were performed to determine retention time repeatability of using the fluidic modulation GC×GC approach, and to determine enantiomeric ratio of the resolved pairs. Retention time precision was outstanding; in fact the percentage relative standard deviaition (%RSD) for second dimension retention time was not greater than 0.45% for any of the target peaks in either separation dimension. Mean second dimension times (n = 3), and 95% confidence interval for (+)-β-pinene, (–)-limonene and (+)-terpinen-4-ol were: 0.815 ± 0.000 s, 0.849 ± 0.001 s and 1.250 ± 0.003 s respectively. Mean second dimension times (n = 3), and 95% confidence interval for (–)-β-pinene, (+)-limonene and (–)-terpinen-4-ol were: 0.810 ± 0.001 s, 0.825 ± 0.000 s and 1.277 ± 0.007 s respectively. Mean first dimension times (n = 3), determined from the retention time of the tallest modulation slice for (+)-β-pinene, (–)-limonene and (+)-terpinen-4-ol were: 5.75 min, 8.10 min and 14.30 min respectively. For (–)-β-pinene, (+)-limonene and (–)-terpinen-4-ol, the recorded first dimension retention times were: 5.90 min, 8.50 min and 14.55 min respectively. These results demonstrate the outstanding run-to-run repeatability using fluidic modulation, with the peak maxima being almost perfectly overlaid. Repeatability of quantitative analysis was also highly satisfactory. The mean results (n = 3) of enantiomeric ratio determination for these three pairs of enantiomers are summarized in Table 2.

Table 2
Excellent repeatability of the quantitative determination of enantiomeric ratio for these three pairs of optical isomers highlights the modulation performance. Without proper modulation the results would be compromized. In particular, unpredictable modulator breakthrough has been avoided by appropriate first dimension column selection. It would be impossible to realise this level of repeatability if sub-optimal modulation were employed. Carveol, (peak 23, Figure 4) is characterized by an obvious streaky appearance in the second dimension, however, this behaviour is also apparent in the separation using the cryogenic modulator (Figure 5) so it is postulated that this observation is not caused by fluidic modulation. In addition an extended tail of the corresponding peak is only observed in the cryogenic system. Marriott and co-workers (15), along with Beens et al. (16) have previously highlighted similar behaviour with GC×GC systems, putting this observed behaviour down to injector effects. Haglund et al. (17) ascribed the peak tailing to a modulation-induced effect. In the present investigation it is apparent that the primary cause is indeed a result of applying the cryogen.
Conclusion
Appropriate pneumatic conditions for fluidic modulation are readily achieved using long, narrow-bore columns in the first dimension of a comprehensive multidimensional GC column ensemble for fluidic modulation. By using long, narrow-bore columns operated at low volumetric flow-rates, favourable modulation period (without breakthrough) for complex multicomponent samples is readily achievable. Since narrow-bore columns provide high resistance to flow, their use also leads to effective stop-flow modulation and streaks in the two-dimensional separation space caused by ineffective modulation are easily avoided. Long columns (i.e., greater then 10 m) are best suited because they maintain optimal modulation ratio without having to resort to very short modulation period. Although narrow-bore columns have lower mass loadability than their wider-bore counterparts, the authors feel that the simplification of determining rugged pneumatic conditions and modulator timing parameters leading to the general benefits of GC×GC outweigh this negative characteristic.
Acknowledgements
Associate Professor Shellie is the recipient of an Australian Research Council Australian Research Fellowship (ARF) (project number DP110104923). This research was supported under Australian Research Council's Discovery Projects funding scheme (project number DP0771893), Australian Antarctic Science Grant 2930 and the University of Tasmania Rising Stars Program. The authors wish to thank Professor Luigi Mondello and co-workers at University of Messina for assisting with cryogenic modulation analysis.
Robert Shellie has been a member of ACROSS at University of Tasmania since 2005. He leads a research group that focuses on development and application of hyphenated techniques in chromatography to solve complex separation problems. Paul Harvey and Samuel Poynter are PhD candidates at University of Tasmania.
References
1. M. Pursch et al., Anal. Bioanal. Chem., 373(6), 356–367 (2002).
2. J.V. Seeley et al., Am. Lab., 38(9), 24–26 (2006).
4. W. Khummueng, J. Harynuk and P. Marriott, Anal. Chem., 78(13), 4578–4587 (2006).
5. R.E. Murphy, M.R. Schure and J.P. Foley, Anal. Chem., 70(8), 1585–1594 (1998).
6. P. Schoenmakers, P. Marriott and J. Beens, LCGC Eur., 16(6), 335–339 (2003).
7. J.B. Phillips and J. Beens, J. Chromatogr. A, 856(1–2), 331–347 (1999).
8. P.McA. Harvey, R.A. Shellie and P.R. Haddad, J. Chromatogr. Sci., 48(4), 245–250 (2010).
9. P. Manzano et al., J. Chromatogr. A, 1218(30), 4952–4959 (2011).
10. P.McA. Harvey and R.A. Shellie, J. Chromatogr. A, 1218(21), 3153–3158 (2011).
11. R.A. Shellie, Volatile components of plants, essential oils, and fragrances, in Comprehensive Analytical Chemistry, L. Ramos (Ed) Elsevier (2009) pp. 189–213.
12. R. Shellie and P.J. Marriott, Anal. Chem., 74(20) 5426–5430 (2002).
13. R. Shellie, P. Marriott and C. Cornwell, J. Sep. Sci., 24(10–11) 823–830 (2001).
14. M.S. Blumberg and L.M. Klee, J. Chromatogr. Sci., 40(5) 234–247 (2002).
15. R. Shellie et al., J. Chromatogr. A, 970(1–2) 225–234 (2002).
16. J. Beens et al., J. High Resolut. Chromatogr., 21, 63 (1998).
17. P. Haglund et al., J. Chromatogr. A, 962(1–2), 127–134 (2002).
Analysis of Pesticides in Foods Using GC–MS/MS: An Interview with José Fernando Huertas-Pérez
December 16th 2024In this LCGC International interview with José Fernando Huertas-Pérez who is a specialist in chemical contaminants analytics and mitigation at the Nestlé Institute for Food Safety and Analytical Sciences at Nestlé Research in Switzerland, In this interview we discuss his recent research work published in Food Chemistry on the subject of a method for quantifying multi-residue pesticides in food matrices using gas chromatography–tandem mass spectrometry (GC–MS/MS) (1).
The Use of SPME and GC×GC in Food Analysis: An Interview with Giorgia Purcaro
December 16th 2024LCGC International sat down with Giorgia Purcaro of the University of Liege to discuss the impact that solid-phase microextraction (SPME) and comprehensive multidimensional gas chromatography (GC×GC) is having on food analysis.

