Effects of Buffer Capacity in Reversed-Phase Liquid Chromatography, Part 1: Relationship Between the Sample and Mobile-Phase Buffers
LCGC Europe
What concentration of aqueous buffer should I use in the mobile phase when developing a re-versed‑phase liquid chromatography (LC) method for the analysis of ionogenic compounds?
What concentration of aqueous buffer should I use in the mobile phase when developing a reversedâphase liquid chromatography (LC) method for the analysis of ionogenic compounds?
Mobile-phase pH is an important variable in reversed-phase liquid chromatography (LC) methods that influences the retention of ionogenic compounds. For acidic analytes containing carboxylic acid functional groups, buffering the mobile phase well below the acid pKa leads to much higher retention compared to conditions where the mobile phase is buffered well above the pKa, and the acid is deprotonated and more waterâsoluble (and therefore more soluble in a waterârich reversed-phase mobile phase). For amine-containing analytes, we observe the opposite behaviour. In mobile phases buffered well above the pKa of cationic forms of the functional group (for example, trimethylammonium ion), the amine is deprotonated and neutral. In this case, the analyte is less water-soluble and more retained under reversed-phase conditions compared to a situation where the mobile phase is buffered at a pH well below the pKa where the amine is protonated, positively charged, and more water soluble. These varied responses of different functional groups to mobileâphase pH can be used to great effect during method development. Indeed, most modern systematic approaches to method development for samples containing ionogenic compounds begin with a set of prescribed methods that is intended to screen for the impact of mobile-phase pH on retention by using buffers at low- (about 2), mid- (about 7), and high- (about 10) pH.
Given the importance of mobile-phase buffers, much has been written about them in this “LC Troubleshooting” column over the years. A survey of John Dolan’s prior troubleshooting articles shows that buffer-related topics have been some of the most frequently discussed over the years. For example, Bill Tindall authored a three-part series in 2002 focused on fundamental concepts important to understanding pH in non-aqueous buffers (1), buffer selection and capacity (2), and buffer preparation methods (3). Last year, we discussed different approaches to buffer preparation in the laboratory, and the fact that some approaches lend themselves better to acquisition of highly repeatable retention data than others (4). In this instalment of “LC Troubleshooting”, we return to the important topic of buffers, this time focusing on what happens when there is a mismatch between the mobile-phase buffer pH and the pH that the sample is buffered at.
When Does a Mismatch Between Sample- and Mobile-Phase pH Matter?
One might argue that, in a perfect world, an LC method would be developed with intimate knowledge of the sample preparation method being used to prepare samples that will ultimately be analyzed using the LC method. In other words, the sample preparation step and the LC separation step would be developed in a dependent way such that they would definitely be compatible with one another. Here, we can speak about compatibility from a variety of perspectives, such as the organic content of the sample, the presence of surfactants, buffer type, and buffer pH. From the point of view of the LC method, the most straightforward situation is to complete the sample preparation step with a sample matrix that closely resembles the mobile phase used at the start of the LC method. However, this is not always practical. For example, particular analytes may not be stable in the sample for long periods of time in a matrix that is desirable for the LC method. In these cases, it is preferable to choose conditions that favour stability of the sample prior to the analysis. Moreover, it is common to see LC methods used for purposes quite different from the original intent of the method. In these cases, the sample matrices may be altogether different from those used when the LC method was originally developed. And so these types of situations can easily result in conditions where the sample is buffered at a pH that is several units different from the LC mobile phase pH, and it is helpful to understand if and when this might lead to problems.
Let’s Think This Through
It is instructive to think through the details of a scenario involving the injection of a sample buffered at a pH significantly different from that of the mobile phase. For the sake of simplifying the discussion, let us consider the injection of a sample buffered with 10 mM NaOH into a mobile phase buffered with 10 mM HCl (and also not worry about activity effects, to keep the math simple; in this case, we would estimate the pH of the 10 mM HCl as 2.0). Suppose we inject 1 µL of the NaOH sample into a 50 mm × 4.6-mm internal diameter (i.d.) column, and the conditions are such that the contents of the 1 µL sample plug mix with a total volume of 20 µL of mobile phase as it proceeds from the column inlet to the column outlet. Under these conditions, the mobile phase will effectively neutralize the injected sample. The sample contains about 1 × 10⁻⁸ moles of OH-, or about 10 nanomoles. If we assume that this ultimately mixes with 20 µL of mobile phase, then that portion of mobile phase carries about 200 nanomoles of H+. Of these 200 nanomoles of H+, 10 nanomoles will be consumed by neutralization of the 10 nanomoles of OH- to produce water, leaving 190 nanomoles of H+ and a slightly higher pH of 2.02. This slight change in pH would not be enough to significantly change the selectivity of most reversedâphase separations. However, one does not have to think about these details long before realizing that we can easily arrive at conditions where the pH change inside the column would be significant. For example, increasing the concentration of the buffer in the sample, or increasing the volume of sample that is injected, could easily lead to significant pH changes. Moreover, in these thought experiments we also quickly encounter questions that don’t have simple answers to; for example, what volume of mobile phase does the sample actually mix with? And, what happens in cases where the sample or the mobile phase are buffered with polyprotic buffering agents (for example, phosphates)? We will have more to say about these questions in future instalments of “LC Troubleshooting”. For now, we think it is most instructive to look at some experimental data to get a sense of the kinds of problems we can run into in situations like this.
On to the Data
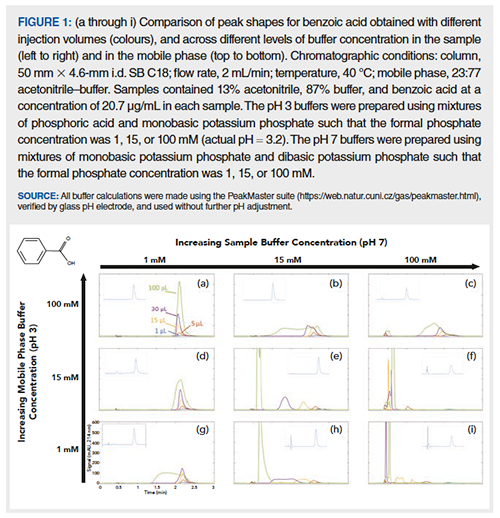
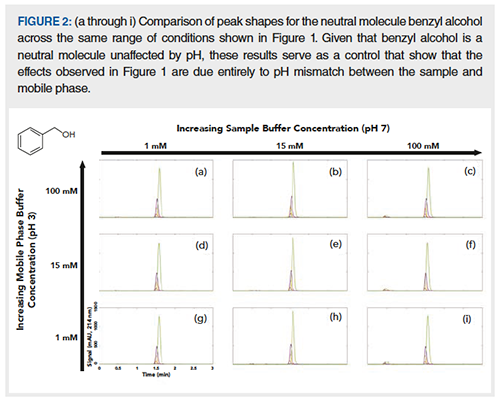
In previous work, we have used benzoic acid as a representative carboxylic acid to study the effects of pH mismatch between the two mobile phases used in the first and second dimensions of two-dimensional liquid chromatography (2D-LC) separations (5). In the experiments discussed below, we have explored similar conditions, but in a way that addresses questions one might face in developing a conventional oneâdimensional (1D)âLC reversedâphase method. Figure 1 shows a series of chromatogram overlays for the analyte benzoic acid that help us understand the interplay between three variables: 1) injection volume (1 to 100 µL); 2) sample buffer concentration (pH 7); and 3) mobileâphase buffer concentration (pH 3). The corresponding chromatograms for the neutral analyte benzyl alcohol are shown in Figure 2; these serve as a set of control experiments, as we would not expect this analyte to be affected by the buffer pH mismatch at all. In each of the nine sets of chromatogram overlays, the sample and mobile-phase buffer concentrations are fixed, and only the injection volume is varied. Moving from left to right within a row of panels, the mobile-phase buffer concentration is fixed, but the sample phase buffer concentration increases. Finally, moving from bottom to top within each column, the sample buffer concentration is fixed, but the mobile phase buffer concentration increases. Looking at this array of results, we make three observations immediately. First, when a small volume of sample is injected (see inset plots in Figure 1 for 1 µL injections), good peak shapes are observed for benzoic acid for all combinations of sample and mobileâphase buffer concentration. Second, when the sample buffer concentration is very low relative to the mobile-phase buffer concentration (panel [a] in Figures 1 and 2), even rather large injections (100 µL is about 20% of the dead volume of the column used here) produce nice peaks for both the neutral benzyl alcohol and the benzoic acid. Finally, when the mobile phase is weakly buffered, poor peak shape can result for the acidic analyte if the injection volume is high, even if the sample is also weakly buffered (for example, see Figure 1[g]). In the cases of intermediate buffer concentration in one or both of the sample and mobile phase, decreasing retention and peak broadening is observed for the benzoic acid (Figures 1[b, c, d, e, g, and h]). When the sample is heavily buffered at the 100 mM buffer concentration, most of the benzoic acid elutes near the column dead time in the deprotonated (anionic) form (Figures 1[f, i]). Under all of these conditions the benzyl alcohol peak is unaffected, with good peak shape and consistent retention (Figure 2).
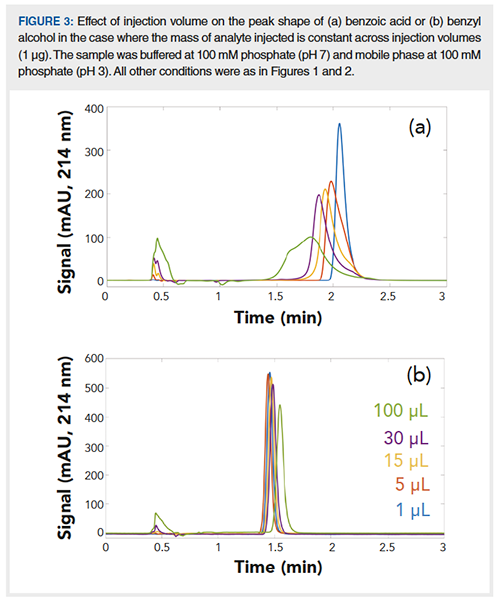
One potentially confounding factor in trying to rationalize these results is that the data in Figures 1 and 2 were collected using samples where the analyte concentration was held constant. Under these conditions, the peak area increases with increasing injection volume. Because the benzoic acid itself can affect the pH and buffer capacity of the sample, one could imagine that this could play a role in the results shown in Figure 1. An alternative way to do the experiment is to adjust the analyte concentration in the samples such that the same mass of analyte is injected at each injection volume. In this case, we would expect the peak area to be the same for a given analyte at each injection volume. The results of this type of experiment for one sample–mobileâphase buffer combination (100 mM in both sample and mobile phase) are shown in Figure 3. Here we see that the peak area is constant over the injection volumes from 1 to 100 µL for both benzoic acid and benzyl alcohol. However, for benzoic acid we see a decrease in peak height as injection volume is increased, because the peak becomes wider and wider. This result rules out the possibility that the benzoic acid itself affects the interplay between the sample and mobile-phase buffers that lead to the poor peak shapes observed in Figure 1.
Closing Thoughts
In this instalment of “LC Troubleshooting”, we have examined the effects of buffer concentration and injection volume on peak shape for the ionogenic analyte benzoic acid under reversed-phase conditions. We observe that, even over modest ranges of the variables studied, the resulting peak shapes for benzoic acid range from excellent to disastrous and completely useless. Considering the interplay between injection volume and the buffer concentrations in the sample and mobile phase is very important when buffer pHs of the sample and mobile phase are different enough to cause a change in the ionization state of the analyte. At this point, determining what combinations of variables lead to acceptable results is an empirical exercise and will depend on many other factors including the retentivity of the column and the hydrophobicity of the analyte. However, the good news is that these experiments are not hard, and a small investment of experimental effort can produce enough data to help analysts understand which conditions are more likely to lead to favourable results and robust methods.
References
- G.W. Tindall, LCGC North Am.20(11), 1028–1032 (2002).
- G.W. Tindall, LCGC North Am.20(12), 1114–1118 (2002).
- G.W. Tindall, LCGC North Am.21(1), 28–32 (2003).
- D.R. Stoll and D. Makey, LCGC Europe 32(7), 364–369 (2019).
- D.R. Stoll, K. O’Neill, and D.C. Harmes, J. Chromatogr. A 1383, 25–34 (2015). https://doi.org/10.1016/j.chroma.2014.12.054.
Thomas Lauer is currently a student researcher working in Dwight Stoll’s laboratory at Gustavus Adolphus College in St. Peter, Minnesota, USA.
Dwight R. Stoll is the editor of “LC Troubleshooting”. Stoll is a professor and co-chair of chemistry at Gustavus Adolphus College in St. Peter, Minnesota. His primary research focus is the development of 2D-LC for both targeted and untargeted analyses. He has authored or coauthored more than 60 peer-reviewed publications and four book chapters in separation science. He is also a member of LCGC’s editorial advisory board. Direct correspondence to: LCGCedit@mmhgroup.com

Understanding FDA Recommendations for N-Nitrosamine Impurity Levels
April 17th 2025We spoke with Josh Hoerner, general manager of Purisys, which specializes in a small volume custom synthesis and specialized controlled substance manufacturing, to gain his perspective on FDA’s recommendations for acceptable intake limits for N-nitrosamine impurities.

