Determination of Seventeen Phytocannabinoids in Various Matrices by UHPLC–HRMS/MS
LCGC Europe
A simple ultrahigh-performance liquid chromatography high resolution tandem mass spectrometry (UHPLC−HRMS/MS) method to determine seventeen phytocannabinoids was developed and validated for Cannabis plants, resins and their extracts, and oils. The analysis was challenging because of the complexity of matrices, the large differences in the concentration of phytocannabinoids and their pattern in various cultivars, and the structural similarity of these analytes.
A simple ultrahigh-performance liquid chromatography high resolution tandem mass spectrometry (UHPLC−HRMS/MS) method to determine seventeen phytocannabinoids was developed and validated for Cannabis plants, resins and their extracts, and oils. The analysis was challenging because of the complexity of matrices, the large differences in the concentration of phytocannabinoids and their pattern in various cultivars, and the structural similarity of these analytes. Method performance characteristics were obtained using internal reference materials. The analytes were isolated from dry hemp by repeated extraction using ethanol with recoveries in the range of 95–100%. For the resinous matrices and oils, samples were directly dissolved in ethanol. Repeatability was 2–12% for all analyte–matrix combinations. Limits of quantification (LOQs) were within the range of 0.5–1.0 mg/kg for dry hemp, 2.5–5.0 mg/kg for resins, and 0.25–0.50 mg/kg for oils. As a result of high matrix dilution, calibration standards in net solvent could be used for phytocannabinoids quantification because matrix effects were almost eliminated. Nevertheless, to ensure the trueness of generated data regardless of the matrix tested, internal standards of deltaâ9âtetrahydrocannabinol-D3 (â9-THC-D3), cannabidiol-D3 (CBD-D3) and cannabinol-D3 (CBN-D3) were also used.
Cannabis (Cannabis sativa L.) belonging to the Cannabaceae family, is an annual plant finding a number of uses as food (seeds, oil, or flour) and also in pharmaceutical and cosmetics production. Hundreds of unique secondary metabolites have also been identified in Cannabis plants, including a wide range of phytocannabinoids (1). In addition to these, a number of other biologically-active substances occur in the Cannabis plant, including terpenes and terpenoids (2). Given the variety of Cannabis components with a wide range of health effects, there is an increasing interest in Cannabis and Cannabis-derived products. Reliable methods for the analysis of the widest possible spectrum of Cannabis components are therefore needed to thoroughly characterize their concentration pattern (3).
Gas chromatography coupled to mass spectrometry (GC−MS) is one of the “official” analytical methods recommended in the older documents issued by the United Nations Office on Drugs and Crime (UNODC) (4) for cannabis-derived product control. However, because high temperatures are commonly employed in GC analysis, phytocannabinoid acids partly decarboxylate to yield their respective neutral molecules. Therefore, to avoid biased results, time-consuming derivatization has to be performed before the analysis (5). Currently, liquid chromatography (LC), which enables the simultaneous determination of both acids and neutral phytocannabinoids, represents the “gold standard” in analysis. Nevertheless, to achieve sufficient separation of individual phytocannabinoids, specifically when only a less-selective conventional ultraviolet–diode array detector (UV–DAD) is available, ultrahigh-performance separation columns with sub-2-µm stationary phase particles should be used (6,7). However, when target phytocannabinoids need to be determined in more complex matrices, that is, when more selectivity and lower detection limits are required, then mass spectrometric detection is clearly a preferred option (8). So far, LC–MS methods to determine a maximum of twelve (9) and thirteen (10) phytocannabinoids have been published.
In this article, we introduce a new simple analytical method employing ultrahigh-performance liquid chromatography coupled to high resolution tandem mass spectrometry (UHPLC−HRMS/MS) for simultaneous determination of seventeen phytocannabinoids in three common types of Cannabis-related materials: plant, resinous matrices, and oils. Because of the matrix similarity, the application scope includes both raw materials for preparation of various Cannabis-derived products (plants, resin, hemp seed oil) and also materials intended for direct consumption as dietary supplements (for example, crude resin extracts, oils enriched with phytocannabinoids).
Materials and Methods
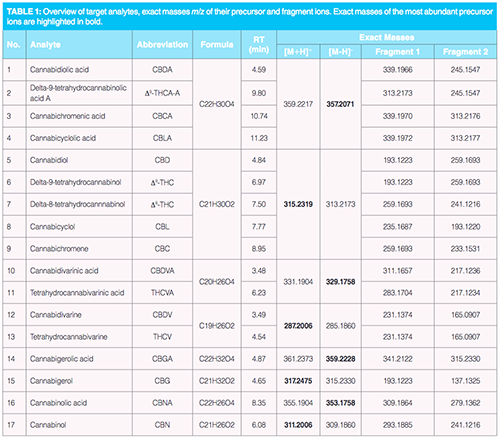
Chemicals: LC–MS-grade chemicals (methanol, isopropanol, ethanol, ammonium formate, and formic acid) and analytical standards of 17 phytocannabinoids (Table 1) with purity in the range of 98.5–99.8% were purchased from Merck. Deionized water (18 mΩ) was obtained from an internal Milli-Q system (Millipore).
Sample Preparation:
A) Cannabis Plants: A representative sample (0.5 g) was weighed into a centrifuge tube (50 mL), mixed with 20 mL of ethanol, and extracted on a horizontal laboratory shaker (IKA) for 30 min at 240 revolutions per minute (RPM). After centrifugation (10,000 RPM, 5 min, Hettich), the extract was removed and the sample repeatedly extracted using the same procedure described above. Both extracts were pooled in a volumetric flask (50 mL) and filled up to the line with ethanol.
B) Resinous Matrices: The sample (50 mg) was weighed into a volumetric flask (25 mL) and completely dissolved in ethanol using an ultrasonic bath (5 min). The flask was then filled up to the line with ethanol.
C) Matrices with High Oil Content: The sample (0.50 g) was weighed into a volumetric flask (25 mL) and completely dissolved in ethanol using an ultrasonic bath (5 min). The flask was then filled up to the line with ethanol.
Instrumental Analysis: Chromatographic separation was performed on an ultrahigh-performance liquid chromatography (UHPLC) UltiMate 3000 system (Thermo Scientific) equipped with a reverse-phased analytical column: Acquity UPLC BEH C18 (100 × 2,1 mm; 1,7 µm) (Waters). Mobile phases were as follows: (A) 95:5 water–methanol (v/v) and (B) 65:30:5 isopropanol–methanol–water (v/v/v), both A and B with 5 mM ammonium formate and 0.1% formic acid (v/v). The total run time of the method was 19 min and the injection volume was 3 µL. The gradient started at 5% of mobile phase B (0.3 mL/min) with steep linear change to 60% of B within the first minute, followed by a gradual change to 70% of B (in 10 min) and another steep change to 100% B (in 0.5 min) simultaneously with a flow rate increase to 0.4 mL/min. The column was then washed with 100% of B for 5 min and reconditioned to initial conditions for 2.5 min. For detection of target analytes, high resolution tandem mass spectrometry (HRMS/MS) using a Q-Exactive Plus orbital trap mass spectrometer (Thermo Scientific) was operated under full scan MS acquisition mode followed by parallel reaction monitoring (PRM). The positive/negative electrospray ionization (ESI±) parameters were as follows: (i) aux gas temperature 300 °C, (ii) sheath/aux gas (N2) flow 45/10 arb. u., (iii) spray voltage,3.5 kV, (iv) S-lens RF level 55. Detection conditions were for full scan MS acquisition mode: (i) resolution 70,000 full width at half maximum (FWHM), (ii) scan range 200–1000 m/z, (iii) automatic gain control (AGC) target 2e5, (iv) maximum inject time (maxIT) 50 ms and for PRM: (i) resolution 17,500 FWHM, (ii) scan range m/z 50 – m/z of fragmented analyte (+ 25 m/z), (iii) AGC target 2e5, (iv) maxIT 50 ms, (v) isolation window width 1 m/z, (vi) normalized collision energy (NCE) 28, 35, and 42%. Exact masses of target analytes and their fragment ions are summarized in Table 1. For their calculation, instrumental analysis and data processing, Xcalibur 4.0 (Thermo Scientific) was used.
QA/QC Samples: The quantification of analytes was performed using external calibration with solvent standards. Individual calibration standards (1, 5, 10, 25, 50, 100, 250, 500 ng/mL) were prepared by transfer of a calculated volume of a working standard mixture (100 ng/mL) of all analytes to amber glass vials, the addition of 100 µL of deuterated standard (a mixture of cannabidiol [CBD]-D3, â9-THC-D3, and CBN-D3, all 300 ng/mL), and calculated volume of ethanol to 1 mL. Limits of quantification (LOQ), estimated for analytes as the lowest calibration levels within the linear range, are summarized in Table 2.
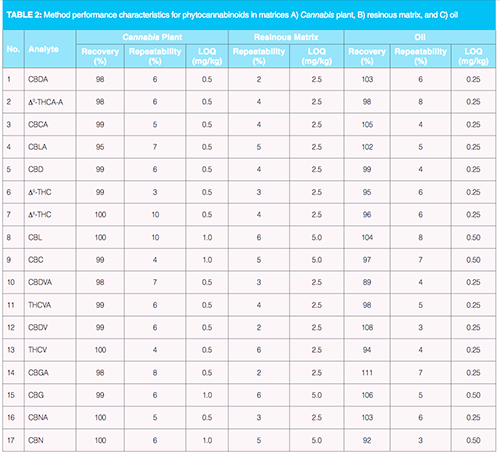
Recovery and repeatability was determined as follows: A) For Cannabis plant material, the recovery was determined by repeated extractions. Resinous matrices with very high content of phytocannabinoids can be directly injected into MS system after significant dilution in ethanol. Under these conditions, the matrix effects are almost negligible. To determine trueness of measurement in case of oils, analyses of spiked cold press flaxseed oil were performed. As the apparent recoveries were in the range of 89–111%, the matrix effects were not significant; B) for resinous matrices, only repeatability was determined because Cannabis resin consists mainly of phytocannabinoids, and resin matrix is easily dissolved in ethanol; C) for oils, recovery and repeatability were determined by spiking of flaxseed oil, a matrix similar in composition with hemp oil, at 1 mg/kg. Method performance characteristics are summarized in Table 2.
Results and Discussion
HRMS/MS Detection: In the first phase, protonated and deprotonated ions of 17 targeted phytocannabinoids were identified using direct infusion of pure standards of individual compounds (1000 ng/mL) into the ion source with a polarity switching. Utilization of stepped NCE at three selected levels allowed the identification of at least two fragment ions; their overview is summarized in Table 1. Utilization of PRM acquisition mode allowed reliable quantification of the targeted phytocannabinoids in MS/MS. Under set conditions, the cycle time (cycle of full scan MS acquisition mode and series of MS/MS spectra acquisition in both polarity modes) was approximately one second, then the peak of with at the baseline of 10 s was constructed of at least 10 points. Acquisition of high-resolution MS spectra without fragmentation is highly advantageous for potential retrospective data mining, for example, for the purpose of other (“new”) phytocannabinoids screening (11).
UHPLC Separation: To enable a short enough analysis of samples containing even higher amounts of lipids, which are strongly retained at the reversed phase, a “stronger” mobile phase had to be selected. On this account, isopropanol was added as a component to mobile phase B, which in the first experiments was composed only from methanol and water and is common in many reversed-phase separations (12,13).
Regarding the use of ammonium formate and formic acid, these were added to buffer the mobile phases and keep a low pH-essential for obtaining narrow peaks for phytocannabinoid acid. This effect could not be achieved by the use of ammonium formate because broadening of the acid elution zones (> 1 min) occurred.
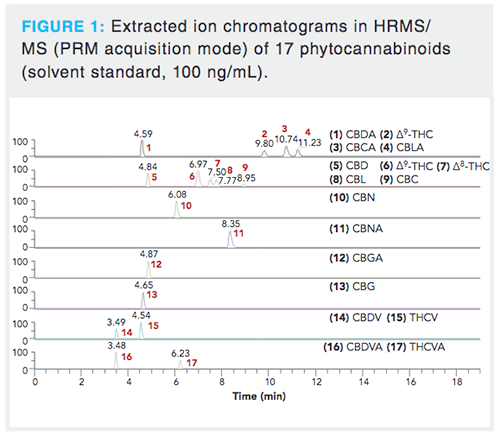
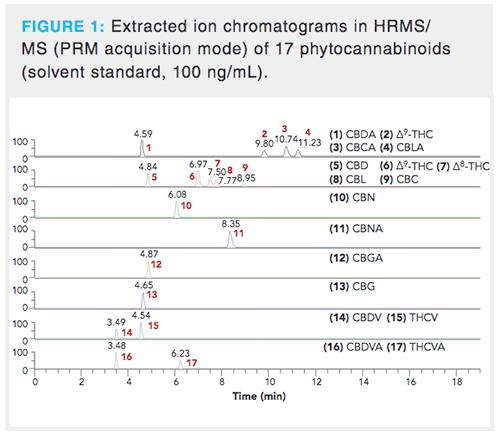
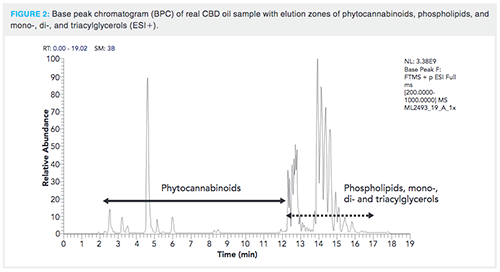
As soon as the composition of the most suitable mobile phase was chosen, we focused on the optimization of target analytes separation. A special attention was paid to separation of isomeric species as their spectral resolution is not possible because of practically identical MS/MS spectra.Tens of elution gradients were tested; the optimized separation is shown in Figure 1 and the record of a real CBD oil sample demonstrating elution zones of phytocannabinoids, phospholipids, and mono-, di-, and triacylglycerols in Figure 2. The average peak width was 12 s, in contrast to the > 20 s observed when comparable reversed-phase high performance liquid chromatography (HPLC) columns equipped with a 5-µm particle size were tested too. Thanks to increased peak capacity, sufficient baseline separation of isomeric phytocannabinoids â8-THC and CBL that could not be easily resolved by HRMS was achieved with a retention time (RT) difference of 16 s in the apex (14). Another potential separation issue was the need to separate deuterated CBD-D3 and CBG because deuterated CBD-D3 has the same precursor ion mass (m/z 318.2507) as the second isotope of CBG. However, they were easily resolved in MS/MS because their product ions contained unique fragment ions for each precursor.
Sample Preparation: Optimization of Cannabis plant samples was demonstrated for the analysis of three internal “reference” samples (dried flowers) covering the entire spectrum of targeted phytocannabinoids at the levels ranging within 2–20,000 mg/kg. As no certified matrix reference material is available, recoveries of the target analytes had to be investigated by repeated extraction with ethanol-shown earlier as the most suitable solvent. Six repeated extractions were performed on all three “reference” samples and the extracts were individually analyzed. Depending on the analyte’s concentration in the tested plants, the recoveries in the first extract were in the range of 85–95%. To further increase this value, akin to some other studies (15,16), a second extraction was performed. Regarding resinous matrices and oils enriched by Cannabis extracts (including CBD oils), simple sample dissolution in ethanol, a solvent compatible with reversed-phase chromatography, was used.
Method Validation: Six replicate analyses of each of the tested matrices were performed within the validation experiments. The use of the optimized UHPLC separation together with the HRMS/MS detection system used resulted in a high selectivity of measurements. Moreover, the employed conditions also enabled low LOQs for all matrices, which are specifically needed in case of hemp oils where the phytocannabinoid levels are low. On the other hand, resinous matrices and oils enriched by Cannabis extracts had to be considerably diluted by ethanol (1:10, 1:100, 1:1000, 1:10,000, v/v) prior to analysis to fit into the detector linearity range. Under these conditions, matrix effects were eliminated and the solvent calibration standard could be used for the analytes quantification. Deuterated standards of â9 -THC, CBD, and CBN, added directly to all samples after dilution and also to the calibration standards at the same level (30 ng/mL), would also compensate for potential matrix effects for these analytes. In most of the analyses, very good compliance of data for THC, CBD, and CBN generated by both calibration strategies was achieved.
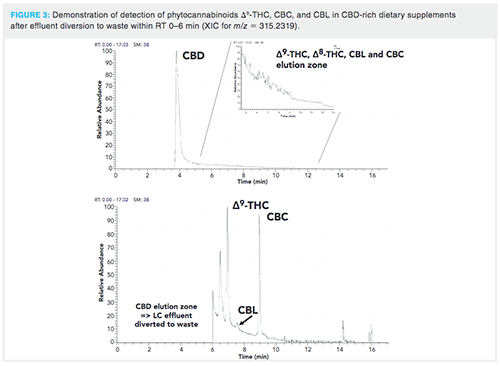
Analysis of Materials with High CBD Content: Instrumental determination of phytocannabinoids in various Cannabisâderived samples with high CBD content (for example, CBD oils) was associated with considerable issues related to accurate quantification of other analytes isomeric with CBD, such as Δ9-THC, Δ8-THC, CBL, and CBC. Following the quantification of CBD content, a second run of the same sample should be performed in which the major part of eluting CBD (RT in the range of 0-6 min) is diverted into waste. In this way, on optics saturation (presumably ion transfer capillary) and high background chemical noise could be eliminated and reliable quantification of all the above-mentioned analytes eluted after CBD can be reliably quantified. This is particularly important in the case of psychoactive Δ9-THC, the presence of which has to be carefully controlled to avoid harmful effects for the consumers of CBD products (17). An illustration of Δ9-THC, CBC, and CBL analysis in a commercially available CBD-rich oil is shown in Figure 3. Out of 20 such commercially-available oils with a high CBD content, Δ9-THC was detected at ‘‘not negligible’’ levels (up to 60% of Δ9-THC acute reference dose, ARfD, set by European Food Safety Authority, when following the recommended daily dose for the tested products) after an additional run with effluent diversion (data not shown) (18).
Conclusion
The developed UHPLC−HRMS/MS method was validated for simultaneous determination of 17 phytocannabinoids in a number of Cannabis-based matrices. Neither derivatization nor other time-consuming sample preparation steps are required. Thanks to low LOQs, significant dilution of samples prior to instrumental analysis can be performed and thus analytical standards in net solvents can be used for calibration. The method is applicable for both materials with a high content of phytocannabinoids (for example, Cannabis resin and concentrated extracts thereof, CBD-rich oils) and other matrices in which key phytocannabinoids as well as minor representatives of this group are of interest. This is the case, for example, when different Cannabis plant chemovars are to be fully characterized.
Acknowledgements
This work was supported by METROFOOD-CZ research infrastructure project (MEYS Grant No: LM2018100) including access to its facilities, by Technology Agency of the Czech Republic (Project No TJ02000238), by the projects OPPC CZ.2.16/3.1.00/21537, CZ.2.16/3.1.00/24503, and NPU I LO1601, and by specific university research (MSMT No 21-SVV/2019).
References
- C. Andre, J. F. Hausman, and G. Guerriero, Front. Plant Sci.7(19), (2016).
- M.A. ElSohly, M.M. Radwan, W. Gul, S. Chandra, and A. Galal, Phytocannabinoids: Unraveling the Complex Chemistry and Pharmacology of Cannabis sativa, 1st Ed. (Springer International Publishing, Switzerland, 2017); pp 1–36.
- F. Pollastro, A. Minassi, and L.G. Frasu, Curr. Med. Chem.25(10), 1160–1185 (2018).
- M.A. ElSohly, W. Gul, and M. Salem, Handb. Anal. Sep.6, 203–241 (2008)
- V. Gambaro, L. Dell’Acqua, F. Fare, R. Froldi, E. Saligari, and G. Tassoni, Anal. Chim. Acta.468(2), 245–54 (2002).
- J.J. DeStefano, B.E. Boyes, S.A. Schuster, W.L. Miles, and J.J. Kirkland, Advanced Materials Technology1368, 163–172 (2014).
- Q. Meng, B. Buchanan, J. Zuccolo, M.M. Poulin, J. Gabriele, and D.C. Baranowski, PLoS One15(5), 1–16(2018).
- B. Nie, J. Henion, and I. Ryona, J. Am. Soc. Mass Spectrom.30, 719–730 (2019).
- L. Vaclavik, F. Benes, M. Fenclova, J. Hricko, A. Krmela, V. Svobodova, J. Hajslova, and K. Mastovska, J. AOAC Int.106(6), 1822–1833 (2019).
- P. Berman, K. Futoran, G.M. Lewitus, D. Mukha, M. Benami, T. Shlomi, and D. Meiri, Sci. Rep.8, 14280 (2018).
- C. Hess, J. Murach, L. Krueger, L. Scharrenbroch, M. Unger, B. Madea, and K. Sydow, Drug Testing and Analysis9(5), 721–733 (2016).
- T. Cajka and O. Fiehn, Trends Analyt Chem. 61, 192–206 (2014).
- M. Yabré, L. Ferey, I.T. Somé, and K. Gaudin, Molecules23(5),1065 (2018).
- W. Gul, S.W. Gul, M.M. Radwan, A.S. Wanas, Z. Mehmedic, I.I. Khan, M.H. Sharaf, and M.A. ElSohly, J. AOAC Int.98(6), 1523–1528 (2015).
- M. Mandrioli, M. Tura, S. Scotti, and T.G. Toschi, Molecules24(11), 2113 (2019).
- M. Wang, Y. Wang, B. Avula, M.M. Radwan, A.S. Wanas, Z. Mehmedic, J. Antwerp, M.A. ElSohly, and I.A. Kahan, J. Forensic Sci.62(3), 602–611 (2017).
- EFSA CONTAM Panel (EFSA Panel on Contaminants in the Food Chain), EFSA Journal13(6), 4141 (2015).
- Commission Recommendation (EU) 2016/2115 of 1 December 2016 on the monitoring of the presence of Δ9-tetrahydrocannabinol, its precursors and other cannabinoids in food (OJ L 327, 2.12.2016, p. 103–104).
Frantisek Benes is a PhD student at the Department of Food Analysis and Nutrition, University of Chemistry and Technology, Prague (UCT Prague), Czech Republic.
Marie Fenclova is a research assistant at the Department of Food Analysis and Nutrition, University of Chemistry and Technology.
Petra Peukertova is a researcher at the Department of Food Analysis and Nutrition, University of Chemistry and Technology.
Zuzana Binova is a PhD student at the Department of Food Analysis and Nutrition, University of Chemistry and Technology.
Zbynek Dzuman works as a research assistant at the Department of Food Analysis and Nutrition, University of Chemistry and Technology.
Jana Hajslova is a professor at the Department of Food Analysis and Nutrition, University of Chemistry and Technology. She is the head of ISO 17025/2018 accredited laboratory and also heads a research group concerned with separation science in the field of food and environmental analysis.
