Development of a Multi-Product SE-UHPLC Method for the Determination of Size-Variants in Bispecific Antibody Formats
LCGC Asia Pacific
The versatile size-exclusion ultrahigh‑performance liquid chromatography (SE-UHPLC) platform method described here provides superior separation for bispecific monoclonal antibody formats compared to a previous method.
Photo Credit: ustas/stock.adobe.com
Elevated levels of aggregates in protein therapeutics are associated with an increased risk of triggering adverse immune responses in patients. It is thus of paramount importance to closely monitor these product-related impurities by the most suitable analytical tools. Size exclusion-high performance liquid chromatography (SE-HPLC) is the preferred method applied in quality control laboratories for the quantitative analysis of aggregates (high-molecular-weight forms), the antibody monomer itself, as well as low-molecular-weight forms. Size-exclusion ultrahigh-performance liquid chromatography (SE-UHPLC) using new columns with packings of particles ²3 μm provides significant gains in chromatographic efficiency by a higher resolution, enhanced selectivity, and shorter run times. Here, we present a multiâproduct SE-UHPLC platform method for the characterization of bispecific monoclonal antibody formats with superior separation characteristics compared to our existing SE-HPLC method, which can be readily applied for process optimization, stability testing, and release analytics.
Biotherapeutics and, more specifically, monoclonal antibodies (mAbs) rank among the fastest growing and most promising classes of drugs in basic research, as well as in clinical settings for various life-threatening diseases, such as cancer, infectious diseases, and immune-mediated disorders. In 2020, about 70 biotherapeutics are expected to be available for patients, and several hundred have been evaluated in, or are the subject of, ongoing clinical trials (1). Their story of success has boosted the development of more sophisticated, elaborate antibody designs, including a large variety of bispecific antibody formats intended to expand potential areas of application by incorporating multiple antigen-recognizing elements into a single framework (2–4). However, promiscuous pairing of polypeptide chains of two antibodies during expression poses a major challenge for molecular engineering, protein manufacturing, and purification to obtain the desired bispecific product (5). For this purpose, the last two decades have seen a variety of innovative technologies for the construction of bispecific antibodies, including the generation of quadroma cells (6), the heterodimerization of heavy chains by the “knobsâintoâholes” technology (7) or electrostatic steering (8), and the correct assembly of light chains by the CrossMab technology (9).
Owing to their complex structure, biotherapeutics generally feature a high degree of intrinsic heterogeneity and susceptibility to diverse chemical modifications, along with an inherent propensity for forming aggregates or decomposing to fragments during production, shipping, and storage (10–12). Particularly, elevated levels of aggregates in protein drug products are closely linked to an increased risk of adverse immune responses in patients, which may affect the safety, potency, and pharmacokinetic parameters (13–15), and are therefore considered critical quality attributes (CQA) by the International Conference on Harmonization (ICH) and the U.S. Food and Drug Administration (FDA) (16,17). Taking the characteristics of bispecific antibodies into account, even more sideâproducts can arise from incorrect association of identical heavy chains and light chains leading to nonfunctional or monovalent molecules (7,9). It is thus mandatory to closely monitor these productârelated impurities by robust and sensitive analytical tools.
Size variants are commonly characterized by employing size-exclusion chromatography (SEC), capillary electrophoresis (CE), and light-scattering based methods, such as multi-angle laser light scattering (MALLS) (18–20). For routine testing in quality control (QC) facilities, size exclusion-high performance liquid chromatography (SE-HPLC) is generally the method of choice for quantifying high-molecularâweight species (HMWs, such as dimers and other highâmolecular aggregates), and for determining the content of lowâmolecular-weight species (LMWs, such as lowâmolecular fragments) (21). The main advantages of this approach include its sensitivity, reproducibility, a relatively high sample throughput, and the mild elution conditions, which are mainly dependent on the mobile phase, temperature, flow rate, and column parameters (such as column length, resin type, or pore size) allowing analysis with minimal impact on the native conformational structure (19). However, conventional SE-HPLC methods are constrained by their comparatively low resolution.
Therefore, recent advances in column design with packings of particles ≤3 μm combined with the application of ultrahigh-performance liquid chromatography (UHPLC) are instrumental in keeping pace with the rapidly evolving field of complex antibody formats by providing major benefits in terms of peak resolution, peak capacity, and total run time compared to conventional SE-HPLC (22,23). Since routine quality control (QC) applications put specific demands on the reliability of the methods applied, a robust SE-UHPLC approach capable of covering a broad range of potential size-variants found in diverse bispecific mAbs offers a powerful tool for the analytical characterization and QC of a variety of different biopharmaceutical products. Here, we describe the development of a multiâproduct SE-UHPLC method designed for QC testing that a) meets the above-mentioned requirements, and b) demonstrates a maximum comparability with our legacy (still applied predecessor) HPLC-based method. This comparison is meant to facilitate method bridging, while taking advantage of the superior performance provided by UHPLC separation. Method suitability was furthermore successfully demonstrated in two independent validation studies with generated data presented in this work. Ultimately, we tested and discuss advantages and limitations of commonly used system suitability test (SST) approaches for the application of our new SE-UHPLC platform method.
Material and Methods
Material: The mAbs 1+1 CrossMab and 2+1 CrossMab (Roche Diagnostics GmbH) were selected to cover different bispecific mAb formats. Gel filtration standard (molecular weight standard, MWS) was purchased from Bio-Rad Laboratories. USP Monoclonal IgG System Suitability Reference Standard (Cat.# 1445550) was purchased from United States Pharmacopeial Convention (USP Convention).
Equipment: SE-HPLC and SE-UHPLC were performed on an UltiMate 3000 RSLC-system (Thermo Fisher) equipped with a HGP-3400RS Rapid Separation (RS) Binary Pump, an autosampler, a temperature-controlled column compartment, and an ultraviolet–visible (UV–vis) detector with detection at 280 nm. Different Thermo U3000 systems include a 100 or 250 µL syringe, a 100 or 250 µL sample loop, a 2.5, 11, or 13 µL UV flow-cell and a 0.13 × 250 mm capillary from the column to the detector. Data acquisition was controlled by the Chromeleon 7.2 software from Thermo Scientific. For validation, SE-UHPLC was additionally performed on an Acquity UHPLC H-Class Bio System (Waters Corporation) using the Empower 3 software equipped with a 100 µL syringe, a 15 µL sample loop, a photodiode array (PDA) detector including an analytical flow cell with 1.5 nL illuminated volume and capillaries with 0.127 mm inner diameter. Statistical parameters were calculated using the Validat Software package p1 (03/2014) Version 5.59.1623 (iCD. GmbH & Co. KG).
SE-UHPLC: SE-UHPLC was carried out using a TSKgel UP-SW3000 size exclusion chromatography (SEC) column (4.6 × 300 mm, packed with 2 µm silica-based beads, 250 Å pore size) from Tosoh Bioscience. The method was run with a mobile phase consisting of 200 mM potassium phosphate–250 mM potassium chloride, adjusted to pH 6.2. Standard running conditions were oven temperature 25 °C, eluent flow rate 0.3 mL/min, and overall run time 18 min. Drug material solutions were diluted to a final concentration of 10 mg/mL in bulk buffer. A volume of 5 µL was injected, corresponding to 50 µg total protein amount, onto column. For protein concentrations lower than 10 mg/mL, injection volumes were increased accordingly. Relative quantification was achieved by manual integration of the chromatographic peaks and calculation of the ratio of the relevant peak areas.
SE-HPLC: SE-HPLC was performed using a TSKgel G3000SWXL SEC column (7.8 × 300 mm, 5 µm particle size, 250 Å pore size) from Tosoh Bioscience. Running conditions were oven temperature 25 °C, flow rate 0.5 mL/min, total run time 30 min, and mobile phase 200 mM monobasic potassium phosphate (KH2PO4)–250 mM KCl, pH 7.0. Sample amounts of 5 µL of a 30 mg/mL protein solution were injected, corresponding to 150 µg on the column.
Results and Discussion
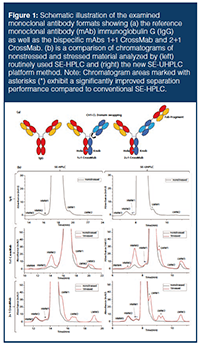
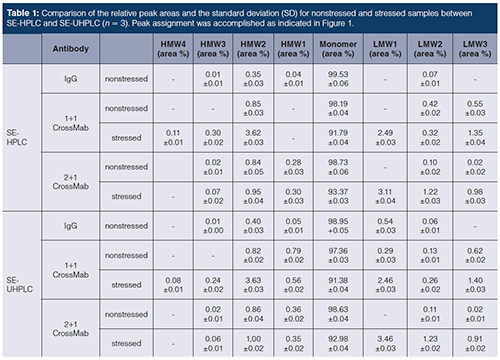
An SE-UHPLC Platform Method to Evaluate SizeâVariants of Bispecific Antibodies: Herein is described the capabilities of our SE-UHPLC method using the TSKgel UP-SW3000 column initially illustrated in relation to our conventional SE-HPLC release method using the TSKgel G3000SWXL column. Employed are a set of three different monoclonal antibodies (Figure 1[a]), including USP Monoclonal IgG System Suitability Reference Standard (RS) (24) as a standard immunoglobulin G (IgG) molecule, an asymmetric, bispecific IgG1-like antibody, generated by swapping of the CH1 and CL domains on one arm of the Fab region (1+1 CrossMab), and an asymmetric 2+1 bispecific antibody with head-to-tail fusion of a Fab fragment to the N-terminus of a single heavy chain via a flexible linker (2+1 CrossMab) (9). Visual comparison of the representative chromatograms for the separation of nonstressed and stressed (exposed to 40 °C for 6 weeks) drug solution material (Figure 1[b]) indicates a significantly improved separation power of our newly developed method at a simultaneous reduction of the total run time by nearly 50%. As described for the application of SE-UHPLC previously (22,25), notable differences of the chromatograms become primarily evident at the edges of the respective main peak by resolving closely related compounds comprising HMW and LMW species, such as mispaired homodimers (knobâknob and hole-hole species for 2+1 CrossMab formats), and truncated antibody variants lacking one Fab fragment (Fab/c species), respectively, which most often cannot be discerned by conventional SEC. In detail, the enhanced performance of SE-UHPLC is reflected by the occurrence of an additional peak in the HMW region (for IgG and 1+1 CrossMab), which can even be baseline separated for the 2+1 CrossMab (marked with blue asterisks), as well as clearly separable peaks next to the monomer (LMW region, green asterisks) for all tested antibodies. Furthermore, the comparability of SE-HPLC and SE-UHPLC performance with respect to the relative ratio of the single peaks of the HMW/LMW region and the antibody monomer was confirmed by side-byâside comparison of quantitative data for triplicates (n = 3) of nonstressed as well as stressed samples (Table 1), showing that both methods yield consistent results apart from unresolved peaks in SE-HPLC. In accordance with these data, the corresponding chromatograms of stressed samples (Figure 1[b]) substantiate the suitability of the developed SE-UHPLC as a stability-indicating method for the products being tested. Conclusively, application of our SE-UHPLC approach results in a greatly enhanced capacity to evaluate size variants representing productârelated impurities in bispecific antibody formats, whose close monitoring is urgently required during process optimization, stability assessment, and release analytics.
Method Development and Robustness Testing: Given that suitability for QC purposes relies heavily on the accurate and consistent quantification of underrepresented process-related impurities in drug solution material, method development steps were designed in a way to achieve high sensitivity along with sufficient separation efficacy, while confounding factors associated with SE-UHPLC application potentially affecting protein recovery and sample composition (onâcolumn aggregate formation) (26) were reduced as much as possible. Therefore, optimization steps involved assessment of flow rate, ionic strength of the eluent, column temperature, amount of protein on-column, injection volume, and, most importantly, column lot-toâlot variation by testing different manufacturers (data not shown), whereas eluent composition was largely adopted from the conventional HPLC method. In this study, we provide a brief insight into method development by outlining the results of four key factors comprising a) ionic strength, b) injection amount, c) injection volume, and d) lot-to-lot variability of the TSKgel UP-SW3000 column for the analysis of 2+1 CrossMab (Figure 2), allowing the justification of our designated parameters.
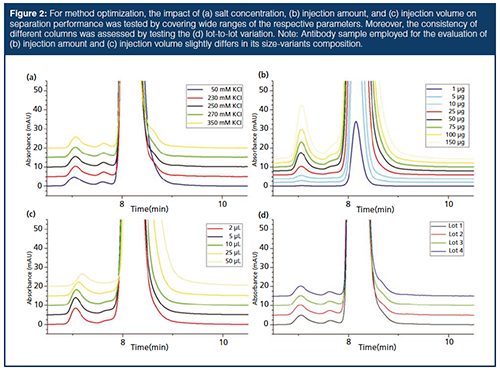
First, secondary electrostatic interactions between the protein and the stationary phase can lead to protein adsorption, peak distortion, retention time shifts, or conformational changes of the protein in dependence on the molecular properties, and, consequently, have a potential impact on the method’s reliability (26,27). For this purpose, a common mitigation strategy involves the application of high salt concentrations to the mobile phase. As described by Goyon and associates previously (28), potassium-based salts are given preference over sodium salts, due to their superior features to a) minimize undesirable interactions of the protein with silica surfaces more efficiently, and b) contribute to an improved stabilization of the protein structure according to their position in the Hofmeister series, resulting in a lower susceptibility to measurement artifacts. The compatibility of the TSKgel UP-SW3000 column with the eluent conditions used for our legacy SE-HPLC method was assessed for different antibody formats by employing salt concentrations from 50 to 350 mM potassium chloride (KCl). As expected, the best separation performance was achieved at high salt concentrations, while reduction of the ionic strength causes peak broadening in the HMW region and less definition of the peak shoulder eluting right after the monomer (Figure 2[a]). Despite the slightly enhanced chromatographic characteristics at an even higher ionic strength, the KCl concentration was set to 250 mM in order to ensure a maximum longevity of the column by keeping the total salt concentration including the buffer system (200 mM potassium phosphate) in compliance with the operating conditions of the manufacturer (below 500 mM).
Another point concerning the separation performance of SE-HPLC is sample loading, which involves both the protein amount loaded onto the column (mass load) and the injection volume. In general, a higher resolution is achieved at low protein amounts, but the sensitivity may not be sufficient in this case for the reliable quantification of low-abundant product-related impurities and vice versa, which we consider to be essential requirements of a QC method (22). Therefore, we first investigated appropriately balanced mass loading by varying sample concentration in a range from 0.2 to 30 mg/mL while keeping the injection volume constant, with the aim to achieve a high signal-to-noise ratio and adequate separation performance at the same time (Figure 2[b]). In accordance with the above-mentioned demands, 50 µg was selected as the preferred sample amount, since the injection of low protein amounts (1, 5, and 10 µg) results in very sharp and symmetrical monomer peaks, but the accurate determination of the present size-variants is restricted by a poor signal intensity of the respective peaks. On the contrary, by injecting excessively high protein amounts onto the column (100 and 150 µg), an increasing tendency for peak broadening can be observed, which impairs peak resolution and particularly hampers the separation of the peak shoulder in front of the monomer. Second, the effect of the sample volume on the separation performance was studied by injecting constant protein amounts (50 µg), but varying injection volume between 2 and 50 µL. As shown in Figure 2(c), with the smallest injection volumes demonstrating the best peak resolution (2 and 5 µL), whereas volume overload causes peak broadening, retention time shifts, and, especially at very high volumes, increasing peak tailing. By taking the precision of the autosampler and the applicability for low-concentration protein samples (during process development) into account, the standard injection volume for the method was set to 5 µL.
Finally, given that method robustness and reproducibility strongly depend on the consistent performance of the column employed, lot-to-lot variation was tested for different column lots of the TSKgel UP-SW3000 column (Figure 2[d]). Chromatograms of lot 1–4 feature very similar peak shapes and comparable results for the relative areas of the monomer, HMWs, and LMWs (data not shown), indicating a nearly constant separation efficacy and, conclusively, the column’s suitability for the developed method.
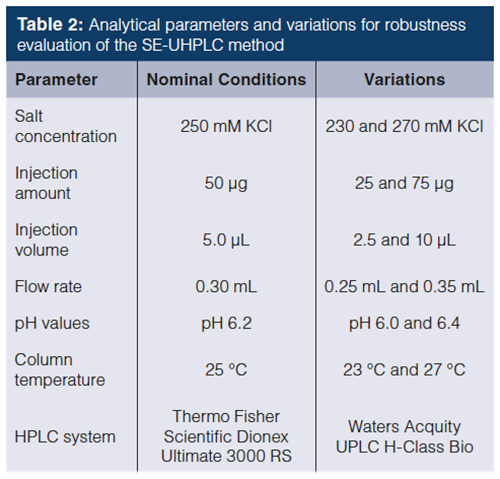
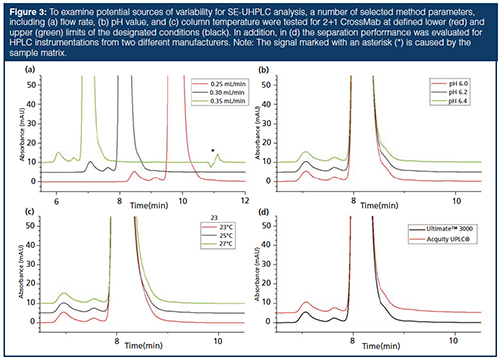
Robustness testing of our SE-UHPLC method was performed utilizing the one-variable-at-a-time (OVAT) approach, at the end of method development for multiple products, to provide an indication of its reliability during interâlaboratory usage and the subsequent validation process (29). Therefore, the impact of small but deliberate variations in seven method parameters, including salt concentration of the eluent, injection amount, injection volume (see Figure 2), flow rate (Figure 3[a]), pH value (Figure 3[b]), column temperature (Figure 3[c]), and, finally, by using HPLC instrumentations from different companies (Figure 3[d]), was assessed by comparing the chromatographic responses with the nominal conditions. The variations applied for robustness testing are summarized in Table 2. According to the overlays in Figures 2 and 3, chromatographic characteristics remain mostly unaffected by the variations induced for robustness testing, emphasizing the applicability of our method for routine use. Even though adaption of the flow rate (Figure 3[a]) results in a retention time shift and a higher number of theoretical plates accompanied by a higher resolution with decreasing flow rate, all expectations set on the separation performance were fulfilled within the tested range. In slight contrast to the definition of robustness (focusing on the impact of altered internal parameters), the term ruggedness, as it is delineated in the USP guidelines, determines the stability of the method against analyst-, instrument-, and laboratory-induced variations, and is, therefore, addressed by the evaluation of reproducibility in the next section.
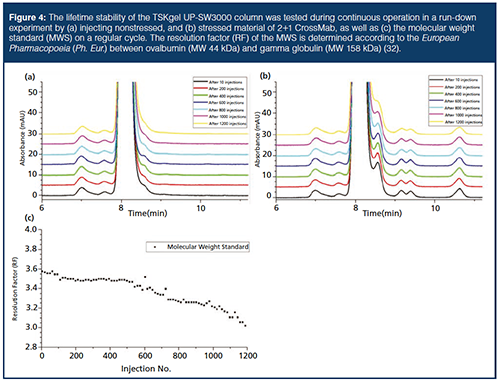
Because of column ageing, the applied method is inevitably susceptible to drifting responses (21). For this purpose, a robustness test evaluating the lifetime stability of a column is very helpful to track deteriorations of the column performance and consequently facilitate the definition of adequate system suitability test (SST) parameters. In this study, a TSKgel UP-SW3000 column was subject to a runâdown experiment under idealized, continuous operation conditions, by sequentially injecting 1200 samples onto the column and monitoring changes in the peak shape and resolution. Figure 4 shows representative chromatograms of (a) nonstressed and (b) stressed material from 2+1 CrossMab as well as the behaviour of the MWS with increasing injection numbers (c). The quality of separation remains very similar for more than 600 injections, then a gradual performance loss can be observed during the further procedure, which is primarily noticeable by the declining separation of the peak shoulder eluting next to the monomer in stressed material, whereas the resolution factor of the MWS decreases during the entire experiment. A significant drop of the column performance is apparent for both samples and the MWS between injection number 1000 and 1200. Therefore, sufficient separation performance could be achieved under the tested conditions for approximately 1000 successive injections. However, it should be noted that the average column lifetime is significantly reduced to roughly 400 sample injections in routine use, which is considered acceptable under pharmaceutical or industrial conditions (30). In our experience, the described difference can be attributed to multiple connecting/disconnecting (installation) steps, storage conditions, and frequently occurring variations of flow rate during the lifetime of a column in daily use.
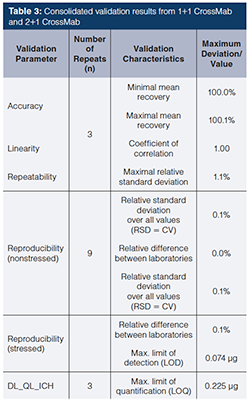
Method Validation: All validation studies were carried out per International Conference on Harmonization (ICH) Q2(R1) for specificity (data not shown), linearity, accuracy, repeatability, reproducibility, detection limit (DL), quantification limit (QL), and robustness (31). In brief, statistical parameters were calculated using a validated software package according to corporate guidelines on statistical interpretation of validation results. Evaluation of linearity, accuracy, and repeatability were performed in a combined experiment by injecting triplicates (n = 3) of nine amount levels ranging from 40% to 150% of the designated protein amount (50 µg). For linearity assessment, the averaged main peak area per level (in counts) was plotted against the expected protein amount to determine the correlation coefficient. Accuracy of the method was checked by calculating the mean recovery of the main peak (found area percent versus expected area percent) relative to the standard values. Repeatability of the method was evaluated by determining the maximal relative standard deviation (RSD) of the main peak. For reproducibility, three independent determinations of nonstressed and stressed material were performed in three different laboratories (n = 9) using different HPLC instrumentations. The evaluation of reproducibility was accomplished by calculation of the relative standard deviation over all values and of the relative difference between the nine results based on the difference between the maximum and minimum obtained value relative to the mean result from all the results obtained (in area percent [area %]) for the main peak. The assessment of the DL and QL was performed similarly to the combined experiment using an adapted concentration range instead. DL and QL of the method were established in triplicates (n = 3) based on the standard deviation of the response and the slope of the regression line. Robustness testing was conducted as described above by introducing small variations in diverse crucial parameters followed by visual inspection of the respective chromatograms (see Figures 2 and 3), and by determination of the relative changes in main peak area percent compared to the nominal value (data not shown).
The results from the analytical validation of 1+1 CrossMab and 2+1 CrossMab are summarized in Table 3 by displaying the consolidated maximum deviations or values for the DL and QL determinations, respectively.
Evaluation of System Suitability Test (SST) Parameters Development: Based on the results from robustness testing, the capabilities of two different SST approaches for monitoring test performance of our method are discussed in the following section. In general, suitable SST criteria are of paramount importance for routine testing in QC laboratories to ensure that emerging differences in the peak pattern, which typically are rather small, can be ascribed to productârelated changes, and are not caused by shortcomings of the method. For example, one of the parameters that is checked thoroughly for the application of SEC includes column performance or, more specifically, the phenomenon of peak fronting or tailing that is often closely linked with the number of injections being run on the column towards the end of its lifetime.
A commonly applied tool for controlling the separation efficiency involves the injection of commercially available protein standard solutions or MWSs as SSTs at regular intervals. By determining a threshold level for the retardation factor (RF) according to European Pharmacopoeia (Ph. Eur.) (32), the deterioration of column performance should be detected reliably in due time to reduce the risk of insufficient measurements, but also to exhaust the maximum capacity of the column. However, by aligning the decrease of the RF with the changes in relative area of the (a) HMW1, (b) HMW2, (c) sum of HMWs, or (d) the monomer for the standard IgG molecule and 2+1 CrossMab (Figure 5), we observed that the data correlate inadequately, making it difficult to define minimum requirements on a sufficient separation efficacy of the column (compare slope of regression lines from MWS and relative area percent of both mAbs). On the contrary, a significantly better correlation was achieved by directly comparing the relative areas for the monomer, HMW1, HMW2, or sum of HMWs between the Standard IgG and 2+1 Crossmab (compare slope of regression lines from relative area percent of both mAbs). These observations imply that the application of USP Monoclonal IgG System Suitability RS as a SST (according to USP <129> [24]) enables more precise monitoring of column performance for the analysis of mAbs with our SE-UHPLC platform method, which may originate from a comparable behaviour of the antibodies on the column, whereas the proteins of the MWS used for the determination of the RF differ in their molecular properties.
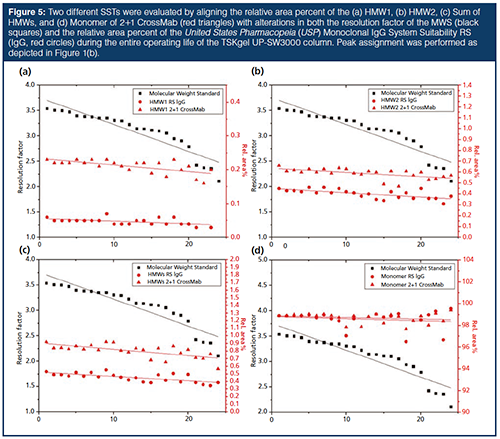
One drawback of this SST applied for our SE-UHPLC platform method comprises the noncompliance with the quantitative criteria defined by USP<129> (24), since, for example, the relative peak area of the LMW region (0.60 area %, see Table 1) exceeds the specification limit of 0.2 area %. However, the deviation can be justified with the improved resolution of our method, enabling the identification of an additional peak at the rear of the monomer, which is not visible in the chromatogram provided by USP <129> (24), but needs to be considered for integration (see Figure 1[b]). We, therefore, see a certain need for redefining USP <129> acceptance criteria, when high-resolution methods are applied.
Conclusions
Although SEC is the predominantly used technique for mAb size-variants analysis, it must be stated that it is a chromatographic mode with considerable restrictions in resolution and selectivity. The introduction of a new generation of SE-UHPLC columns with significantly improved separation characteristics sparked great interest in the biopharmaceutical industry, since the increasing importance of mAbs as a therapeutic modality and more recent advances in antibody engineering promote the evolution of more complex antibody formats, which in turn poses a major characterization challenge for analytical laboratories. In this study we present the development steps, robustness assessment, validation results, and the evaluation of appropriate system suitability test parameters for a multiâproduct SE-UHPLC approach using the TSKgel UP-SW3000 SEC column. The consistency of the results shown for both stressed and nonstressed antibody drug samples across various antibody formats with our legacy SE-HPLC method has been shown. In conclusion, our method provides a powerful and cost-effective platform technique for the characterization of mAbs with superior separation power, which has meanwhile been successfully implemented in our commercial QC facilities.
Acknowledgements
We would like to acknowledge Jennifer Rea, Wen-Li Chung, Alejandro Carpy, and all colleagues from the global Roche/Genentech SEC Analytical Expert Team (AET) for fruitful discussions, Carmen Heitler and Gabriel Hoffmann for their contributions to the study, and Patrick Bulau for carefully reviewing this manuscript.
References
- D.M. Ecker, S.D. Jones, and H.L. Levine, mAbs7, 9–14 (2015).
- U. Brinkmann and R.E. Kontermann, mAbs9, 182–212 (2017).
- F. Yang, W. Wen, and W. Qin, International Journal of Molecular Sciences 18(1), 48 (2016).
- G. Fan, Z. Wang, M. Hao, and J. Li, Journal of Hematology & Oncology8, 130 (2015).
- S. Krah, C. Sellmann, L. Rhiel, C. Schröter, S. Dickgiesser, J. Beck, S. Zielonka, L. Toleikis, B. Hock, H. Kolmar, and S. Becker, New Biotechnology39, 167–173 (2017).
- H. Lindhofer, R. Mocikat, B. Steipe, and S. Thierfelder, Journal of Immunology (Baltimore, Md. 1950) 155, 219–225 (1995).
- J.B. Ridgway, L.G. Presta, and P. Carter, Protein Engineering9, 617–623 (1996).
- K. Gunasekaran, M. Pentony, M. Shen, L. Garrett, C. Forte, A. Woodward, S.B. Ng, T. Born, M. Retter, K. Manchulenko, H. Sweet, I.N. Foltz, M. Wittekind, and W. Yan, The Journal of Biological Chemistry285, 19637–19646 (2010).
- C. Klein, W. Schaefer, and J.T. Regula, mAbs8, 1010–1020 (2016).
- J. Vlasak and R. Ionescu, mAbs3, 253–263 (2011)
- M. Vázquez-Rey and D.A. Lang, Biotechnology and Bioengineering108, 1494–1508 (2011).
- H. Liu, G. Gaza-Bulseco, D. Faldu, C. Chumsae, and J. Sun, Journal of Pharmaceutical Sciences97, 2426–2447 (2008).
- K.D. Ratanji, J.P. Derrick, R.J. Dearman, and I. Kimber, Journal of Immunotoxicology11, 99–109 (2014).
- E.M. Moussa, J.P. Panchal, B.S. Moorthy, J.S. Blum, M.K. Joubert, L.O. Narhi, and E.M. Topp, Journal of Pharmaceutical Sciences105, 417–430 (2016).
- M. Ahmadi, C.J. Bryson, E.A. Cloake, K. Welch, V. Filipe, S. Romeijn, A. Hawe, W. Jiskoot, M.P. Baker, and M.H. Fogg, Pharmaceutical Research32, 1383–1394 (2015).
- US Food and Drug Administration, Guidance for Industry: Assay development for immunogenicity testing of therapeutic proteins (FDA, Rockville, Maryland, USA, 2014). https://www.fda.gov.
- International Conference on Harmonization, ICH Q6B, Specifications: Test Procedures and Acceptance Criteria for Biotechnological/Biological Products (ICH, Geneva, Switzerland, 2003).
- H. Ye, Analytical Biochemistry356, 76–85 (2006).
- P. Hong, S. Koza, and E.S.P. Bouvier, Journal of Liquid Chromatography & Related Technologies35, 2923–2950 (2012).
- J. den Engelsman, P. Garidel, R. Smulders, H. Koll, B. Smith, S. Bassarab, A. Seidl, O. Hainzl, and W. Jiskoot, Pharmaceutical Research28, 920–933 (2011).
- S. Fekete, A. Beck, J.-L. Veuthey, and D. Guillarme, Journal of Pharmaceutical and Biomedical Analysis101, 161–174 (2014).
- R. Yang, Y. Tang, B. Zhang, X. Lu, A. Liu, and Y.T. Zhang, Journal of Pharmaceutical and Biomedical Analysis109, 52–61 (2015).â©
- A. Goyon, A. Beck, O. Colas, K. Sandra, D. Guillarme, and S. Fekete, Journal of Chromatography. A1498, 80–89 (2017).
- United States Pharmacopeia General Chapter <129> “Analytical Procedures of Recombinant Therapeutic Monoclonal Antibodies” (United States Pharmacopeial Convention, Rockville, Maryland, USA, 2017).
- M. Haberger, M. Leiss, A.-K. Heidenreich, O. Pester, G. Hafenmair, M. Hook, L. Bonnington, H. Wegele, M. Haindl, D. Reusch, and P. Bulau, mAbs8, 331–339 (2016).
- T. Arakawa, D. Ejima, T. Li, and J.S. Philo, Journal of Pharmaceutical Sciences99, 1674–1692 (2010).
- G. Brusotti, E. Calleri, R. Colombo, G. Massolini, F. Rinaldi, and C. Temporini, Chromatographia, 1–21 (2017).
- A. Goyon, A. Beck, J.-L. Veuthey, D. Guillarme, and S. Fekete, Journal of Pharmaceutical and Biomedical Analysis144, 242–251 (2017).
- Y. Vander Heyden, A. Nijhuis, J. Smeyers-Verbeke, B.G. Vandeginste, and D.L. Massart, Journal of Pharmaceutical and Biomedical Analysis24, 723–753 (2001).
- S. Fekete, K. Ganzler, and D. Guillarme, Journal of Pharmaceutical and Biomedical Analysis78–79, 141–149 (2013).
- International Conference on Harmonization, ICH Q2(R1), Validation of Analytical Procedures: Text and Methodology (ICH, Geneva, Switzerland, 2015).
- Chapter 2.2.46 “Chromatographic Separation Techniques” European Pharmacopoeia (European Directorate for the Quality of Medicines, Strasbourg, France, 2017).
Tobias Graf, Raphael Ruppert, Georg Hafenmair, Markus Haindl, Harald Wegele, and Michael Leiss are with Pharma Technical Development Analytics at Roche Diagnostics in Penzberg, Germany.
Alexander Knaupp is with Pharma Research and Early Development at Roche Diagnostics in Penzberg, Germany.
Sebastien Violini and Steffen Kiessig are with Pharma Technical Development Analytics at F. Hoffmann-La Roche in Basel, Switzerland.
Common Challenges in Nitrosamine Analysis: An LCGC International Peer Exchange
April 15th 2025A recent roundtable discussion featuring Aloka Srinivasan of Raaha, Mayank Bhanti of the United States Pharmacopeia (USP), and Amber Burch of Purisys discussed the challenges surrounding nitrosamine analysis in pharmaceuticals.
Regulatory Deadlines and Supply Chain Challenges Take Center Stage in Nitrosamine Discussion
April 10th 2025During an LCGC International peer exchange, Aloka Srinivasan, Mayank Bhanti, and Amber Burch discussed the regulatory deadlines and supply chain challenges that come with nitrosamine analysis.


