Determination of Volatile Organic Compounds in Water by In-Tube Extraction and Gas Chromatography with Ion-Trap Mass Spectrometry
Special Issues
Over the last 10 years, several solvent-free microextraction techniques for gas chromatography (GC) and mass spectrometry (MS) have been developed. Two of these techniques, solid-phase microextraction (SPME) and stir-bar sorptive extraction (SBSE), are available commercially for the analysis of volatile compounds, such as flavors in foods and beverages, and toxic organic compounds in environmental applications. Other techniques, such as open tubular trapping, inside needle capillary adsorption trap (1), in-tube SPME, capillary microextraction, needle trap, and headspace solid-phase dynamic extraction (2), were also developed for different applications. The basic principle for all of these techniques is essentially the same. Volatile and semivolatile compounds are adsorbed on a sorbent coating, often packed on the interior surface of a capillary column or stainless steel needle. After the sample is concentrated on the coating, the compounds are desorbed thermally in the heated injection port of a gas..
Recently, an automated dynamic headspace extraction technique called in-tube extraction was developed by CTC Analytics (Zwingen, Switzerland) for its Combi PAL autosampler and used with an ion-trap gas chromatography–mass spectrometry (GC–MS) system. In this device, analytes are adsorbed on a sorbent trap contained inside of a side-hole needle attached to a gas-tight syringe. Loading takes place by continuously passing the headspace above a sample across a sorbent trap inside the needle. This dynamic headspace extraction results in added sensitivity over conventional static headspace techniques. The analytes are then desorbed off the needle trap into a GC injection port and analyzed by ion-trap MS. Until recently, very little work had been done to determine optimized extraction procedures for in-tube extraction methods (3,4).
Presently, volatile organic compounds (VOCs) in drinking water typically are measured using one of two methods: purge-and-trap GC–MS or headspace GC–MS. Purge-and-trap GC–MS is a very sensitive technique, but it is subject to carryover and contamination due to long sample pathways in the concentrator. Also, compounds sensitive to active sites will degrade rapidly on dirty traps, poor connections, and cold spots. Headspace analysis eliminates several of these problems, but its sensitivity is not as good, particularly for less volatile compounds. In-tube extraction and thermal desorption is highly sensitive and is a good alternative to these conventional methods for the analysis of trace levels of organic chemicals.

Figure 1: Typical total ion chromatogram of VOCs at 5 μg/L.
This study developed an analytical method using in-tube extraction and an ion-trap mass spectrometer for VOCs and compared results with those obtained using a standard purge-and-trap reference method, U.S. EPA Method 524.2. The EPA method has specific quality control parameters for reproducibility, accuracy, and method detection limit (MDL), providing an excellent standard point of reference for the evaluation of the in-tube extraction technique.
Materials and Reagents
A total of 62 VOCs along with a volatile gases stock solution at 2000 mg/L and three internal standards at 2000 mg/L were purchased from Ultra Scientific (North Kingstown, Rhode Island). All solutions were in purge-and-trap-grade methanol. These stock solutions were further diluted in methanol to prepare substocks at 2, 20, and 200 mg/L and then spiked into 100-mL volumetric flasks to make 0.1-, 0.2-, 0.5-, 1-, 2-, 5-, 10-, 20-, and 50-μg/L standard solutions in reagent water. Internal standards were added to give a final concentration of 5 μg/L. A 12.5-mL volume of each standard solution was transferred into a 20-mL screw cap headspace vial with a PTFE-coated silicone septum.
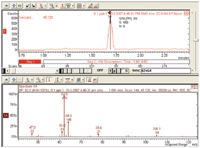
Figure 2: Extracted ion chromatogram of vinyl chloride at 0.1 ppb using the in-tube extraction technique.
GC–MS Method
All samples were analyzed using a Varian 450-GC GC system coupled to a Varian 240-MS ion-trap mass spectrometer with MS Workstation software. In-tube extraction was performed with a Combi PAL autosampler using Cycle Composer to run the in-tube extraction macros.
GC System Conditions
Injector: Varian 1079 PTV
Carrier gas: Helium at 1.2 mL/min
Column temperature: 35 °C, hold for 1 min, 10 °C/min to 180 °C, hold for 4.5 min
Column: Varian FactorFour VF-624ms GC column, 30 m × 0.25 mm, 1.4-μm df
Internal Mode MS Temperatures
Trap: 150 °C
Transfer line: 170 °C
Manifold: 50 °C
MS Acquisition Parameters in Full Scan
Segment One: 0–1.0 min, filament off
Segment Two: 1.0–4.6 min, electron ionization (EI) full scan with mass range of 46–120
Segment Three: 4.6–20 min, EI full scan with mass range of 45–250
Tuning type: BFB
Target: 20,000
Max Ion Time: 25,000 μs
μScan: 3
Emission current: 30 μA
Results and Discussion
Optimization of In-Tube Extraction Parameters and Materials
Different in-tube extraction trap materials — Carboxen 1000, Tenax TA, Carbopack C, Tenax GR, and Carboxen 1001 — were evaluated for the performance of trapping VOCs. Tenax TA and Tenax GR were found to have the best overall trapping capability for all the VOCs tested. Various parameters in the in-tube extraction method, such as desorption speed, extraction time, extraction temperature, and injection volume, were optimized to provide good sensitivity and precision.
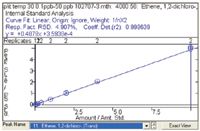
Figure 3: Example calibration curve for 1,2-dichloroethene using the in-tube extraction technique.
A chromatogram is shown in Figure 1. The in-tube extraction technique provides the necessary sensitivity, accuracy, and precision to meet the quality control criteria outlined in U.S. EPA 524.2.

Table I: Calibration statistics of VOCs using the in-tube extraction method
Method Validation
Nine calibration levels at 0.1, 0.2, 0.5, 1, 2, 5, 10, 20, and 50 μg/L were used for most compounds, with the exception of chloromethane, chloroethane, and 1,2-dibromo-3-chloropropane, as listed in Table I. The calibration range statistics meet or exceed criteria demonstrated in U.S. EPA 524.2. Methylene chloride had a relatively higher relative standard deviation (RSD), primarily due to background laboratory contamination in the reagent water. The GC column temperature in this method started at 35 °C instead of 10 °C as suggested in the EPA method.
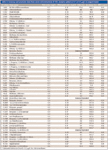
Table II: Accuracy and precision data from seven determinations of VOC analytes spiked at 0.1 or 0.5 μg/L in reagent water
MDL, Accuracy, and Precision of the Method
Seven replicate injections at both 0.1 and 0.5 μg/L were used to determine the precision, accuracy, and MDL of this method. Results in Table II indicate that the precision, accuracy, and MDLs using the in-tube extraction method are comparable to published data in the reference method. Seven replicates at 0.5 μg/L also were determined in reagent water, with mean accuracy between 74% and 105% for all of the VOC analytes with average %RSD of 5.13%. VOCs also were spiked into different matrices (treated surface water data shown) at 5 μg/L, with average recovery for all VOCs at 104%. The recovery of tribromomethane was found to be relatively low after background subtraction due to a significant amount detected in the treated water sample.

Table III: Recovery of VOC analytes in surface water (pond water) spiked at 5 μg/L after blank correction
Comparison of In-Tube Extraction and EPA Purge-and-Trap Method
Table IVshows a comparison between the purge-and-trap and in-tube extraction techniques in finished drinking water. Overall, both techniques demonstrated remarkably similar results in terms of overall percent recovery. As noted in the table, a significant amount of the disinfection byproducts chloroform and bromodichloromethane was found in the water, which explains the high biased recoveries.
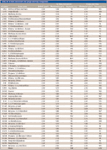
Table IV: In-tube extraction and purge-and-trap comparison
Conclusion
The in-tube extraction technique provides excellent precision, accuracy, and detection levels, comparable to standard purge-and-trap reference methods. The linear dynamic ranges evaluated for most compounds were 0.1–50 μg/L, with an average correlation coefficient and RSD of 0.999 and 10.9%, respectively. The method detection limits for most VOCs were between 0.01 and 0.05 μg/L. The advantages of in-tube extraction are
- easy integration into Combi PAL autosampler platform,
- less likelihood of contamination and carryover due to very short sample pathway,
- excellent fit with ion-trap MS, enabling very low detection levels, and
- overall ease-of-use and maximum up-time compared with complex purge-and-trap systems.
Haibo Wang and Ed George are with Varian, Inc., Walnut Creek, California.
References
(1) R, Kubinec, V.G. Berezkin, R. Górová, G. Addová, H. Mracnová, and L. Soják, J. Chromatogr., A 295–301 (2004).
(2) M.A. Jochmann, M.P. Kmiecik, and T.C. Schmidt, J. Chromatogr., B 208–216 (2006).
(3) P.E.M.D. Joos, G.M.A. De beuckleer, and S. De Koning, "Determination of Volatile Organic Compounds in Drinking and Surface Water with In-Tube-Extraction Comprehensive GC/Time-of-Flight Mass Spectrometry," Application note #5; CTC Analytics.
(4) M.A. Jochmann, X. Yuan, B. Schilling, S.B. Haderlein, and T. Schmidt, "In-Tube Extraction for Extraction of Volatile Organic Hydrocarbons from Groundwater," Application note #6; CTC Analytics.

Analytical Challenges in Measuring Migration from Food Contact Materials
November 2nd 2015Food contact materials contain low molecular weight additives and processing aids which can migrate into foods leading to trace levels of contamination. Food safety is ensured through regulations, comprising compositional controls and migration limits, which present a significant analytical challenge to the food industry to ensure compliance and demonstrate due diligence. Of the various analytical approaches, LC-MS/MS has proved to be an essential tool in monitoring migration of target compounds into foods, and more sophisticated approaches such as LC-high resolution MS (Orbitrap) are being increasingly used for untargeted analysis to monitor non-intentionally added substances. This podcast will provide an overview to this area, illustrated with various applications showing current approaches being employed.


