Detective Work, Part 2: Physical Problems with the Column
Particulate matter from the sample or the system can cause havoc in the chromatogram.
John W. Dolan, LC Troubleshooting Editor.
Particulate matter from the sample or the system can cause havoc in the chromatogram.
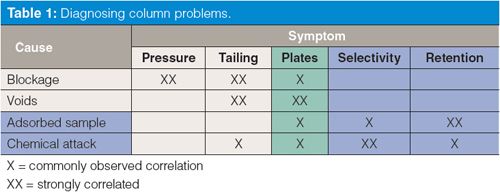
In last month’s “LC Troubleshooting” (1) we looked at the major causes and symptoms associated with failure of liquid chromatography (LC) columns. These are summarized in Table 1. The most common problems associated with physical failure of the column are blockage and void formation, which are expressed as symptoms of increased pressure and peak tailing, as well as a reduction in the column plate number. We examine these problems in the present discussion. Problems that are primarily associated with chemical changes in the column are usually caused by adsorption of sample components on the column surface or chemical attack on the column stationary phase. These commonly show up as changes in peak spacing and retention time. Chemical changes will be the subject of next month’s discussion.

Look for Changes
Perhaps the most common mode of column failure is indicated by an increase in column back pressure. Many times this increase is accompanied by increased peak tailing. Obviously, these symptoms are noticeable only when compared to the normal performance of the system.
Factors that determine the column back pressure include the column itself - length, diameter, and column packing particle size - as well as the mobile-phase composition, temperature, and flow rate. These are the primary contributions for traditional LC systems. With ultrahigh-pressure LC (UHPLC), the system plumbing can also contribute significantly to the back pressure because pumping 0.5–1 mL/min of mobile phase through 0.0625-mm i.d. tubing generates a significant amount of friction compared to the 0.125–0.175 mm i.d. tubing used in conventional LC systems. Normal values of system back pressure will vary between methods, so it is a good idea to note the normal pressure for each method. System suitability acceptance parameters often do not include a value for pressure, but pressure is easy to note when the method is set up for each batch of samples. Experience will tell you what is normal for each method with a new column. Over the lifetime of a column, the pressure may increase by 25% or more, and for most columns, pressure itself is not detrimental to normal performance. An exception is for some UHPLC methods where significant increases in pressure can cause changes in peak spacing (2,3).

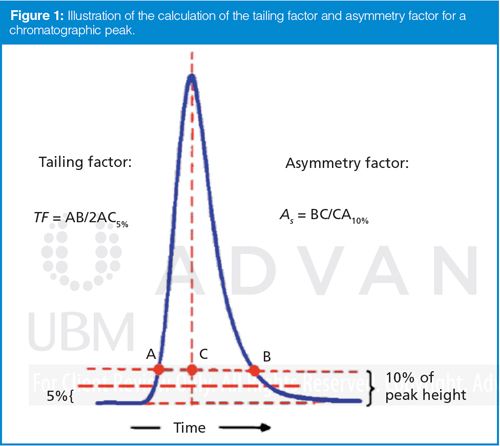
Most sample peaks exhibit some tailing; it is rare that all peaks exhibit the symmetric Gaussian shape of an ideal chromatographic peak. Usually peak tailing is tracked as part of the system suitability test by measuring the tailing factor, TF, or the asymmetry factor, As, as illustrated in Figure 1. TF and As give approximately the same tailing values for TF ≈ As < 2. TF is the standard measurement in the pharmaceutical industry; As is often used in other applications. As mentioned above, most chromatographic peaks tail a bit, and TF ≈ As ≤ 1.5 is usually acceptable and allows good peak quantification. When TF ≈ As > 2, corrective action is recommended for most methods.
What Does a Pressure Increase Mean?
It is normal for the column back pressure to rise over the lifetime of the column. Real samples that originate from a biological source, the environment, or a manufactured product often contain nonsoluble particulate matter. Depending on the extent of sample pretreatment, some of these particles can be injected and collect on the frit at the inlet of the column. Components subject to wear within the LC system itself, such as pump seals and injection valve seals, can also wear and shed particulate debris over time. As these particles collect on the column inlet frit, the column back pressure will gradually rise. The tolerance for increased pressure will depend on the method, but an increase of 25%, for example, from 200 bar to 250 bar, is usually tolerable as long as it does not exceed the upper pressure limit of the system (generally 400 bar for a conventional LC, 600–1000 bar or more for UHPLC). If the tolerated rise happens over the normal lifetime of the column (500 to >2000 injections is common), there is no need for corrective action. If the pressure rise is faster, such as over a single batch of samples or <500 injections, you should be able to increase the useful lifetime of the column by reducing the particulate load of the sample. Be sure to use reference conditions for a new column under normal operation, or you may find yourself performing unnecessary maintenance. Under gradient operation with water (or buffer) as the A-solvent and methanol as the B-solvent, different mixtures of water and methanol will change the pressure during a run. For example, relative to 100% water (pressure = 100), the mid-gradient pressure will rise by ~50% (~150 relative) and drop to half (~50 relative) at 100% methanol.
The simplest way to reduce the amount of particulate matter that reaches the column inlet frit is to add an in-line filter before the column. Such filters are inexpensive (relative to the cost of a column) and are available from most chromatography supplies vendors. The filters with user-replaceable frits are the most economic choice. Select an 0.5-µm porosity filter if you use a column with ≥3-µm-diameter particles; for smaller particles, an 0.2-µm porosity frit is recommended. These recommended frits have porosity equal to or smaller than the frit at the column inlet, so they will trap particles that would otherwise block the column. You can monitor the column pressure during method equilibration and decide if the observed pressure indicates that it is time to change the frit. Alternatively, if the pressure rise over time is predictable, you may schedule replacement of the in-line filter on a calendar or injection-count basis.
An alternative to the in-line filter is to use a guard column, or precolumn, upstream from the column. A guard column will stop particulate matter from the sample or system and provide some chemical protection of the column, as well. The downside of a guard column is that it can cost one-fourth (or more) of the price of a new column. If you opt to use a guard column, I suggest using an in-line filter upstream of the guard column to keep it from becoming blocked prematurely.
If the pressure rise over time is more rapid than is convenient to mitigate by regular in-line frit replacement, additional sample pretreatment may be necessary. You may find that filtration of the sample through a membrane filter (0.5- or 0.2-µm porosity) may be sufficient. Many times, centrifugation of the samples in a benchtop centrifuge provides similar particle removal. The use of solid-phase extraction (SPE) or liquid–liquid extraction (LLE) will remove additional sample contaminants, but it may not be appropriate if you need to analyze for impurities or degradants in the sample.
If particulate matter has accumulated on the frit at the inlet of the column, reverse-flushing the column can be a successful technique to remove particles, but don’t put too much faith in this procedure, because it is only successful approximately one-third of the time. To reverse-flush the column, simply reverse the column direction and pump 10–20 column volumes of mobile phase (15–30 mL for a 150 mm × 4.6 mm column) through the column directly to waste. The column can then be left in the reverse direction or returned to normal flow. Before you attempt reverse-flushing, check to be sure that your column will tolerate reverse flow. Most columns that contain 5-µm-diameter particles can be reverse-flushed; other column configurations may or may not be appropriate for reverse-flushing, depending on the frit configuration. Check with the column manufacturer if you are not sure if reverse-flushing is allowed. If you find that reverse-flushing is necessary, I advise that you then modify the system to add an in-line filter to stop the particles before they get to the column or guard column frit.
What About Peak Tailing?
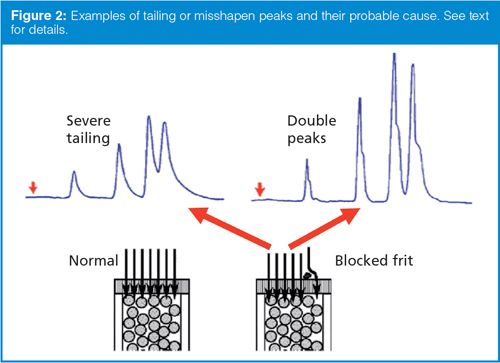
As most columns age, peak tailing will increase. In this discussion, we’ll be concerned only about the case in which peak tailing increases for all peaks in the chromatogram. (If tailing increases for only one or a few peaks in the chromatogram, it is an indication of a change in column or mobile phase chemistry, and will not be discussed here.) If all of the peaks tail, front, split, or otherwise show the same shape defect, the problem occurred before any separation took place. Examples of tailing or misshapen peaks can be seen at the top of Figure 2.

The most common cause of tailing of all the peaks is partial blockage of the frit at the inlet of the column. At the lower left of Figure 2 is a cartoon of the cross-section at the top of the column. The particles are held within the column by a frit at the inlet (and one at the outlet, not shown). The injected sample is represented by the arrows, each of which contains a mixture of the unseparated sample components. Under normal operation, these sample streams (arrows) all arrive at the head of the column at the same time, then the separation begins. Under these circumstances, all sample molecules start the separation process at the same time, so each sample band is homogeneous. The cartoon at the bottom right of Figure 2 is a representation of the same column inlet, but with a frit that is partially blocked by some sample debris. Now most of the sample streams reach the column at the same time and proceed as normal. However, some of the sample has to divert around the blockage, which causes it to arrive later than the other streams. This stream starts late, and the sample molecules all lag behind their normal counterparts. Because this delay occurs before any separation takes place, all peaks suffer the same defect. Another way to think of this delay is in an analogy to a 100-m dash in a track meet. If all the runners have the same capability and all the starting blocks are lined up properly, all the competitors will reach the finish at the same time - this situation is analogous to the column inlet under normal circumstances. If, on the other hand, three of eight lanes have the starting blocks shifted back 5 m, those athletes will run the same speed as their competitors, but will lag behind by 5 m, creating a “tail” on the grouping of runners - just as the sample is slightly delayed at the column inlet with a partially blocked frit. Because the nature of the disturbance in the flow at the frit may vary, peak defects may vary as well, and can include peak fronting or tailing, double peaks, or peak splitting with a similar appearance for all peaks in the chromatogram.
A partially blocked frit may or may not be accompanied by an increase in back pressure, depending on the magnitude of the blockage. The only way to correct a partially blocked frit is to reverse-flush the column, as was described earlier. Before the use of current column packing techniques, it was possible to remove the frit at the head of the column and replace it with a new one, but frit removal is very likely to ruin modern columns, so it is not recommended. If a partially blocked frit is suspected, it is best to prevent this blockage by using an in-line filter or a guard column to keep particulate matter from reaching the column. You should should evaluate the appropriateness of improving sample pretreatment.
Other Observations
Another problem that can occur at the inlet of the column is the creation of a void or other disturbance in the column packing bed. This problem may be caused by chemical attack on the particles or severe mechanical abuse; in the past when columns weren’t packed as well, settling of the packing material was another cause of fronting. Column voids because of chemical attack will be discussed in a future instalment of “LC Troubleshooting”. Historically, some workers filled in a column void with used packing material, but this approach is not a viable technique with modern columns. Void formation cannot be corrected, and the column should be replaced.
If you look at the symptoms and causes in Table 1, you’ll see that a reduction in the column plate number, N, is also seen when physical problems of blockage or column voids are observed. Any defect in peak shape will increase its width, thus lowering the plate number. Because plate number reduction is symptomatic of all modes of column failure, it is not a discriminating diagnostic tool. However, if the plate number is tracked as part of system suitability, it can alert you to column problems in general so you can look more carefully for a specific problem.
Summary
We’ve considered the most common cause of increased column back pressure and peak tailing for all peaks in the chromatogram: the accumulation of particulate matter on the column inlet frit. The source of the particles is most likely the sample, although deterioration of pump seals and injection valve rotors can also generate particulate matter. If the column is not protected otherwise, the particles collect on the column inlet frit. Sometimes the problem can be corrected by reverse-flushing the column, but reverse-flushing is often not successful and may not be allowed for some column configurations. A better approach is to replace the column and then take measures to avoid recurrence of the problem. These measures may be as simple as installing an inline filter to remove particles before they reach the column. Guard columns are another option. Changes in sample pretreatment can eliminate the problem entirely. Centrifugation of the samples may be sufficient pretreatment in many cases; in others, SPE, LLE, or other sample preparation steps may be necessary. In next month’s “LC Troubleshooting” we’ll consider problems associated with chemical changes to the column.
References
- J.W. Dolan, LCGC Europe28(11), 612–615 (2015).
- M.F. Fallas, U.D. Neue, M.R. Hadley, and D.V. McCalley, J. Chrom. A 1209, 195–205 (2008).
- M.F. Fallas, U.D. Neue, M.R. Hadley, and D.V. McCalley, J. Chrom. A1217, 276–284 (2010).
- “LC Troubleshooting” Editor
John Dolan has been writing “LC Troubleshooting” for LCGC for more than 30 years. One of the industry’s most respected professionals, John is currently the Vice President of and a principal instructor for LC Resources in Lafayette, California, USA. He is also a member of LCGC Europe’s editorial advisory board. Direct correspondence about this column should go to Alasdair Matheson, editor-in-chief, at amatheson@advanstar.com

Silvia Radenkovic on Her Research and Passion for Scientific Collaboration
April 3rd 2025Radenkovic is a PhD candidate at KU Leuven and a member of FeMS. Her research focuses on inborn metabolic disorders (IMD), like congenital disorders of glycosylation (CDG), omics techniques such as tracer metabolomics, and different disease models.
Evaluating Natural Preservatives for Meat Products with Gas and Liquid Chromatography
April 1st 2025A study in Food Science & Nutrition evaluated the antioxidant and preservative effects of Epilobium angustifolium extract on beef burgers, finding that the extract influenced physicochemical properties, color stability, and lipid oxidation, with higher concentrations showing a prooxidant effect.


