Comprehensive Screening of Pollutants in Household Dust Using High-Resolution Mass Spectrometry with Enhanced Chromatographic Resolution
Individuals spend a good portion of their lives indoors and are regularly exposed to a variety of harmful substances. Hazardous chemicals are ubiquitous, and chronic exposure via inhalation, dermal uptake, or ingestion can be detrimental to human health.The sources of pollutants in homes and places of employment include, but are not limited to, textiles, electronic devices, and building materials. Dust is a repository of a wide array of substances; therefore, it is an important indicator of chronic chemical exposure (1).
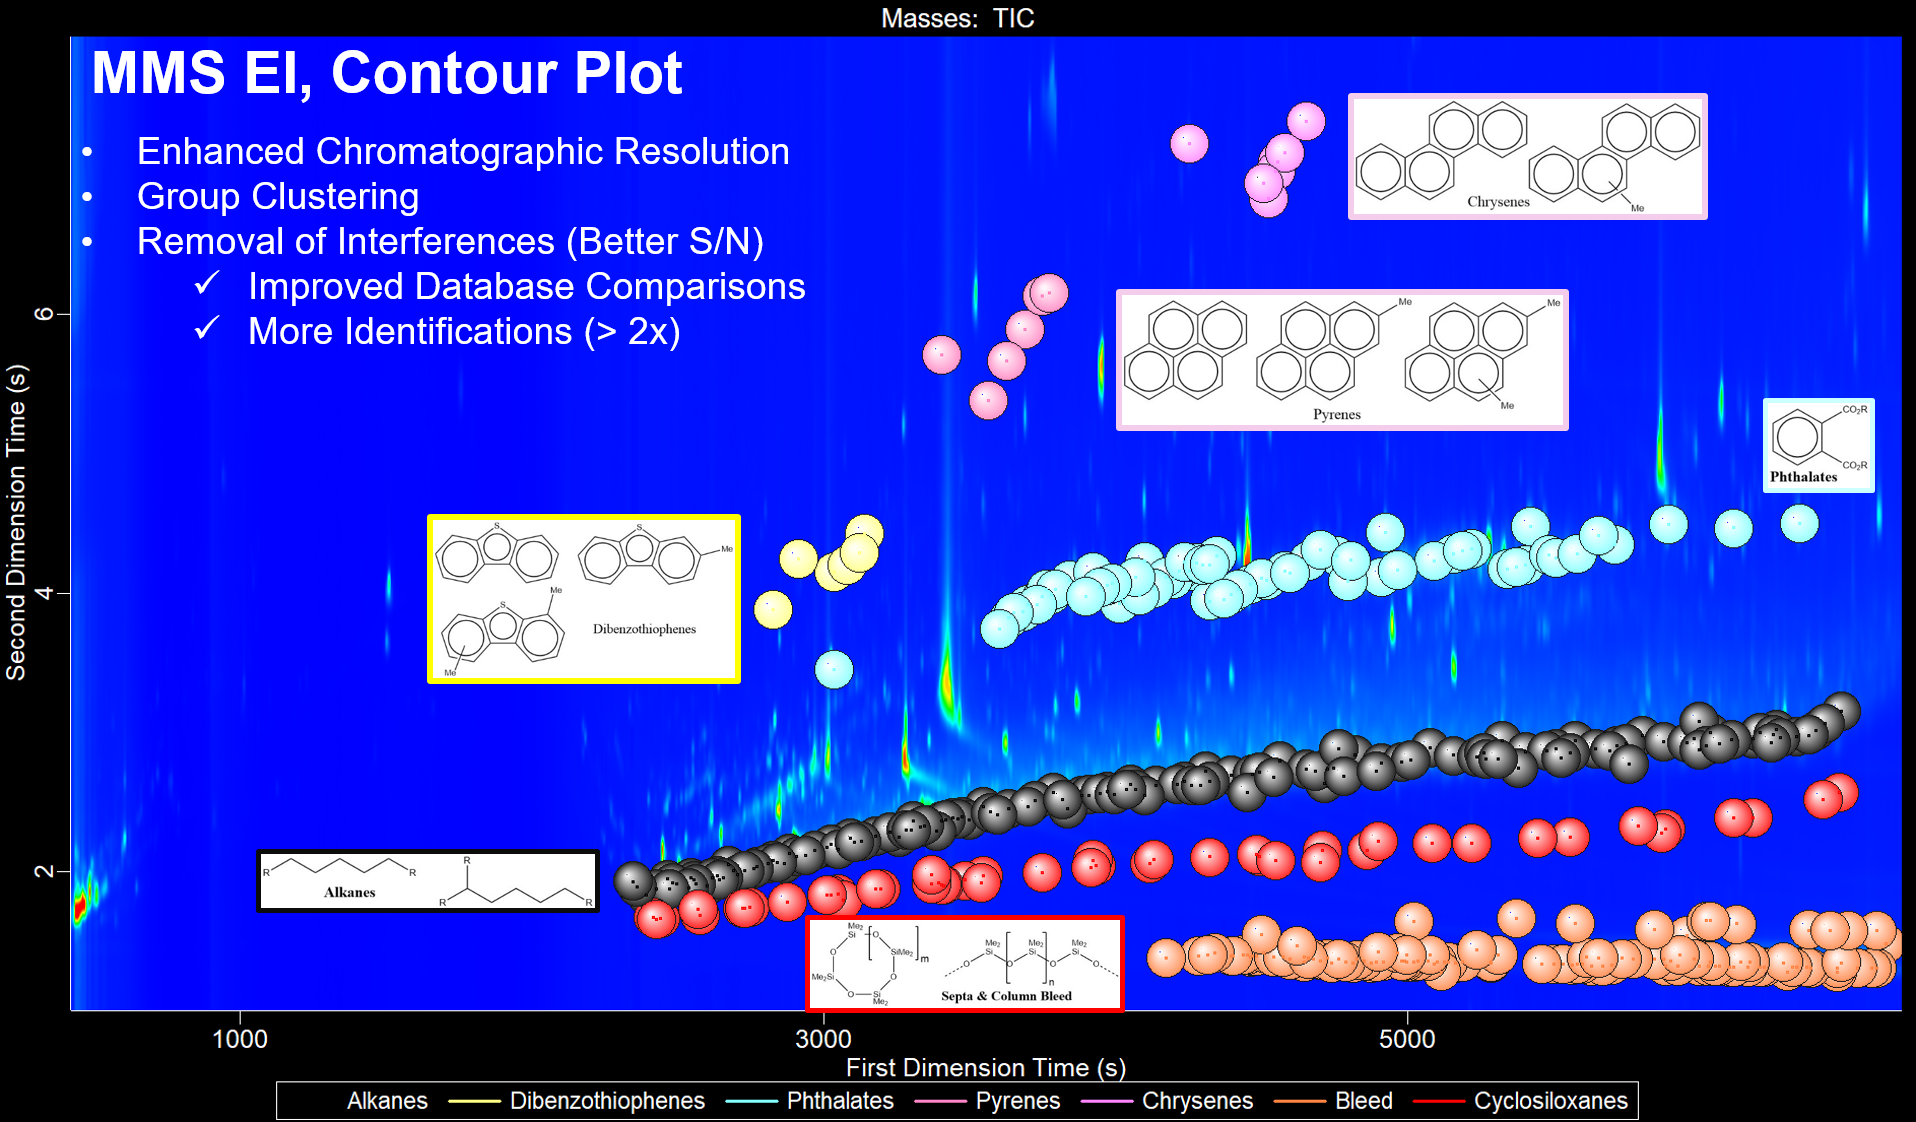
Figure 1: MMS EI, contour plot: a contour plot displaying some of the major constituents in the SRM. Features include enhanced chromatographic resolution, group clustering, and removal of interferences with improved S/N. Removed interferences improves database comparisons and identification.
Unfortunately, analyzing dust samples is challenging because of the enormous number of chemical constituents, variety of chemical classes with different physiochemical properties, and wide concentration ranges. Analysis by conventional gas chromatography–mass spectrometry (GC–MS) and liquid chromatography–mass spectrometry (LC–MS) techniques is hampered by overlapping chromatographic peaks and potential isobaric interferences in their mass spectra. Researchers have attempted to circumvent these problems by combining different instrumental techniques for analyzing targeted compounds in complex dust samples (2–4). More recent untargeted approaches have been conducted through multi-institutional collaborations and the utilization of numerous analytical techniques (5).
The focus of this study was to develop a methodology for the untargeted characterization of compounds in a dust standard reference material (SRM), office dust, and household dust. The instrumental technique used for the analysis combined comprehensive two-dimensional gas chromatography and high resolution time-of-flight mass spectrometry (GCxGC-HR-TOF-MS) using a novel ion source. The enhanced chromatographic resolution of GCxGC minimized coelutions, and isobaric interferences were reduced because of the high resolving power of the mass spectrometer. The technology resulted in data with exceptional peak alignment between ionization modes, better signal to noise (S/N), and an increase in the total number of compounds identified. Electron ionization (EI) data were utilized to identify compounds through spectral similarity searches of large databases and formula determinations for molecular, adduct, and fragment ions. Positive chemical ionization (PCI) and electron capture negative ionization (ECNI) spectra provided complementary molecular formula information to increase confidence in compound identification. Advanced software tools allowed for both untargeted data processing as well as retrospective targeted analysis of the comprehensive data. Instrument software afforded complete control over the autosampler, chromatograph, and mass spectrometer, in addition to automated instrument optimization for a seamless transition between the three ionization modes.
Experimental
Sample Preparation
Office and house dust samples were obtained from vacuum cleaner bags used over multiple weeks at a local home and place of business. A National Institute of Standards and Technology (NIST) SRM 2585 was purchased directly from the NIST website and used for method development (6).
Dust samples were weighed (0.14 ± 0.01g) and transferred to 10 mL glass centrifuge tubes. Then, 3 mL of extraction solvent (3:1 dichloromethane/hexane) were added, and the tube was capped. The heterogeneous mixture was vortexed for 10 s and then extracted for 20 min via sonication. The supernatant was removed, and the residue was extracted again with an additional 3 mL of solvent. The combined extracts were filtered using a syringe filter and placed under N2 gas to evaporate the solvents. The resulting residue was reconstituted in 400 μL of dichloromethane and transferred to 2 mL vials for analysis. The instrument used for data collection was a Pegasus HRT+ 4D. (LECO Corporation) equipped with a novel multimode source (MMS). The mass spectrometer was operated in EI, PCI, and ECNI modes with source temperatures of 250 °C for EI and 165 °C for both PCI and ECNI. The spectrometer was tuned with perfluorotributylamine (PFTBA) to give a resolving power of 25,000 for m/z 218.98514 and a mass accuracy less than or equal to 1 PPM. Data were collected at 200 spectra per second, and methane was used as a reagent gas for chemical ionization. The gas chromatograph was equipped with a LECO Dual Stage QuadJet Thermal Modulator and two different columns. The column set consisted of an Agilent DB-5MS UI (30 m x 0.25 mm i.d. x 0.25 μm film thickness) first dimension (1D) column, and a Trajan BPX-50 (0.60 m x 0.10 mm i.d. x 0.10 μm film thickness) second dimension (2D) column. The carrier gas was helium (1.0 mL/min constant flow), the injection was 2 μL splitless, and the inlet was programmed to start at 70 °C and increase to 300 °C at 500 °C/min. The oven temperature program started at 80 °C (1 min) before it increased to 140 °C at 20 °C/min (30 min hold). It then ramped up to 200 °C at 10 °C/ min and finally increased to 300 °C at 1.5 °C/min (5 min hold). The secondary oven was maintained at +5 °C relative to the primary oven. The modulation period was 8 s, and the temperature offset of +15 °C was relative to the secondary oven.
Data Processing
GCxGC-HR-TOF-MS data were processed using ChromaTOF brand software. Peak Find (untargeted) processing included automated mass calibration (PFTBA calibrant), peak finding with deconvolution, spectral similarity comparisons to large, well-established databases (NIST 20, Wiley 12), and formula determinations for high resolution, accurate mass (HRAM) molecular and fragment ions. The target analyte finding (TAF) processing feature of ChromaTOF was used to target trace compounds in the dust samples.
Results and Discussion
The EI data collected was relatively rich and intense because of the universal ionization capabilities and efficiency of the ionization method. PCI and ECNI are selective ionization modes for electron-rich and deficient compounds, respectively. ECNI mode exhibits not only selectivity but exceptional sensitivity for electron-deficient compounds. The utilization of all modes, together with the HRAM capabilities of the mass spectrometer, facilitated the identification of the compounds, thereby increasing the total number of annotated substances in the dust. Careful inspection of the EI data contour plot for the NIST SRM (Figure 1) clearly illustrated the enhanced separation of GCxGC, leading to better S/N, cleaner spectra, and improved spectral data- base similarity scores. Furthermore, the plot exhibited group clustering (or positioning) for easy visualization and quick identification of the compound groups of interest and the removal of undesirable column and septa bleed. Dust components highlighted in the plot include branched and linear alkanes, dibenzothiophenes, phthalates, parent and substituted pyrene, and chrysene polyaromatic hydrocarbons (PAHs). Group clustering directly correlated to compound physiochemical properties; thus, their ability to interact with column stationary phase was impacted. Increased efficiency in compound separation was accomplished through careful primary and secondary column selection. The two columns were coated with different stationary phases leading to dissimilar or orthogonal compound separation mechanisms. For a nonpolar primary column (100% dimethyl polysiloxane), there were stronger London dispersion force interactions between the stationary phase and compounds with greater molecular weights and increased surface area. For example, higher molecular weight linear alkanes were retained longer than smaller, branched alkanes. In the case of the secondary column with an increased percentage of aromatic groups (50% dimethyl/50% diphenyl polysiloxane), saturated hydrocarbons interacted less with the phase and are located at the bottom of the contour plot (y-axis) while unsaturated compounds such as PAHs are located at towards the top of the plot because they were retained more through stronger pi–pi interactions. The assigned bubble colors in the contour plot are related to compound classification, and their size is proportional to their relative areas.
After automated data processing, a large number of organic compounds were identified in the SRM including hydrocarbons, acids, amines, alcohols, aldehydes, ketones, esters, phenols, terpenes, fatty acids, sterols, and phosphates. Classes of substances identified included illicit and over-the-counter drugs, food and flavor substances, sunscreen components, tobacco-related alkaloids, and cannabinoids. Two examples are cotinine, the predominant nicotine metabolite in humans, and cocaine, a powerful tropane alkaloid obtained from coca leaves native to South America. The comparison of their deconvoluted mass spectra to databases resulted in spectral similarity match values of 895 and 936, respectively, out of a potential perfect score of 1000. Greater confidence in compound identification was achieved by examining the mass accuracy values (PPM = 106 x (m/zobs – m/zcalc / m/zcalc) for these compounds (-0.23 and 0.28 PPM respectively).
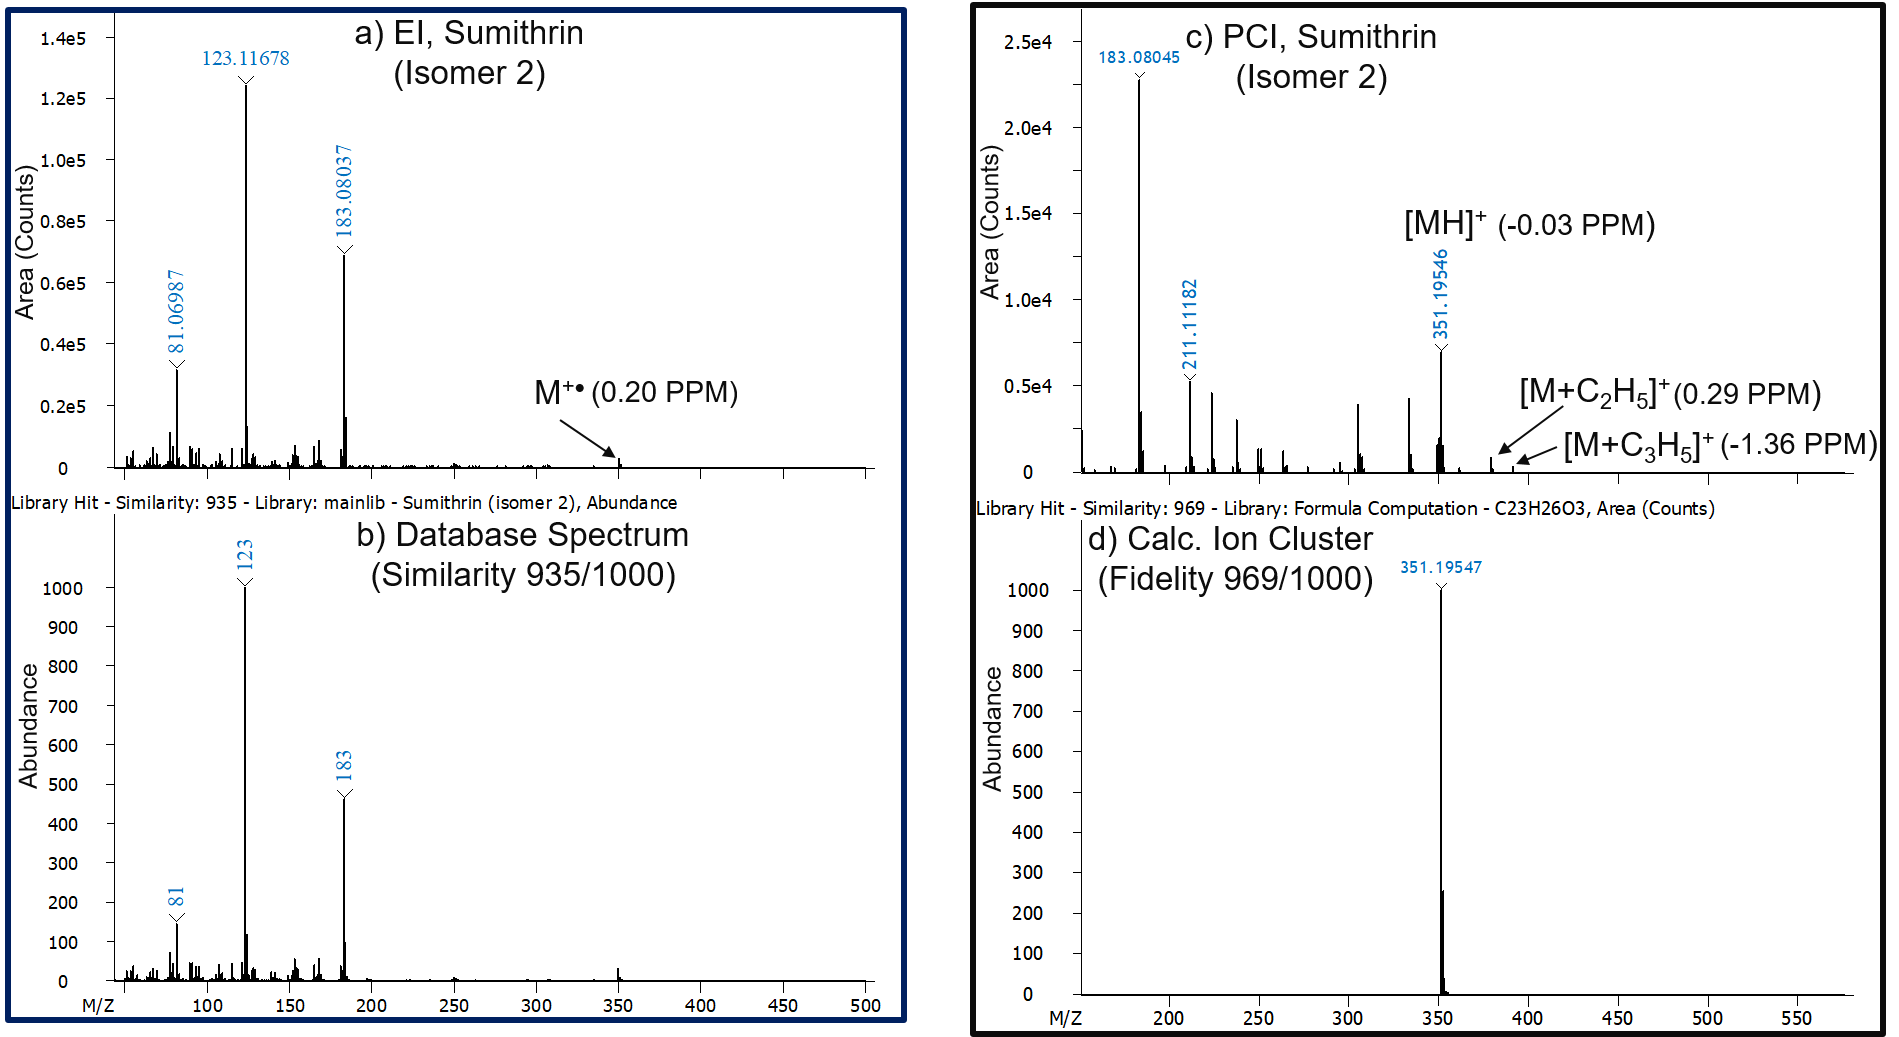
Substances of major environmental and human health concerns included halogenated organic compounds, pesticides, and persistent organic pollutants (POPs). These compounds were present in trace quantities, but they were easily characterized through analysis with a combination of EI and PCI or ECNI. The names, database similarity values, and molecular ion mass accuracies of selected hazardous substances are listed in Table I. Spectral similarity values for all compounds in Table I averaged 862/1000. Mass accuracy values ranged from -0.80 to 1.93 PPM for compounds with molecular ions in their mass spectra. The endocrine-disrupting, brominated flame retardant, 2,2’,4,4’,5,-pentabromodiphenyl ether (BDE-99), exhibited a similarity value of 892/1000 and mass accuracy of 0.34 PPM for its molecular ion. Mass accuracy values for major fragments were used to help characterize compounds when molecular ions were absent in their spectra. For example, tris-dichloropropylphosphate (TDCPP), a phosphorus flame retardant used widely in the 1970s in children’s pajamas has a strong fragment ion at m/z = 378.89870 ([M-CH2Cl]+,-0.03 PPM). Spectra for BDE-209 and TDCPP are shown in Figure 2.
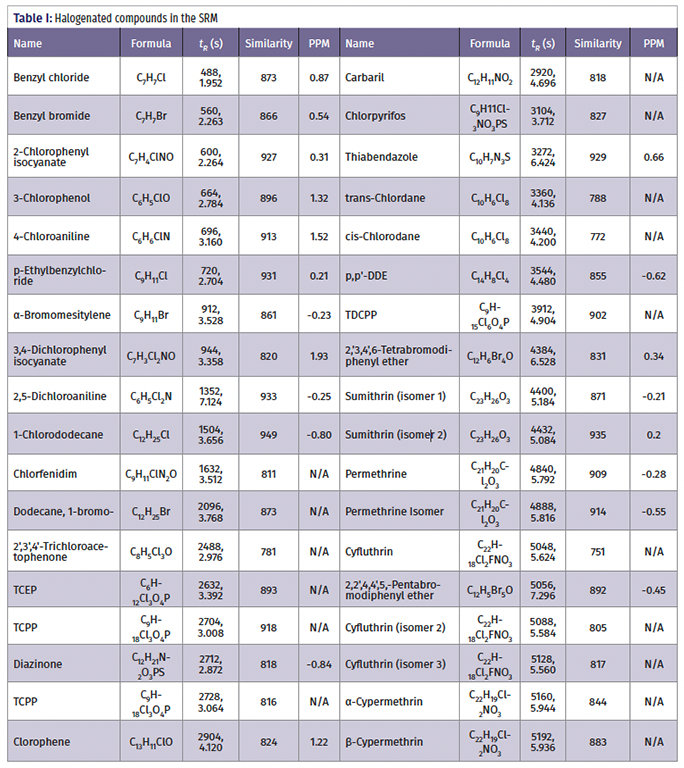
Figure 2: (a) Deconvoluted and (b) database EI mass spectra for BDE-99. (c) Deconvoluted and (d) database mass spectra for TDCPP.
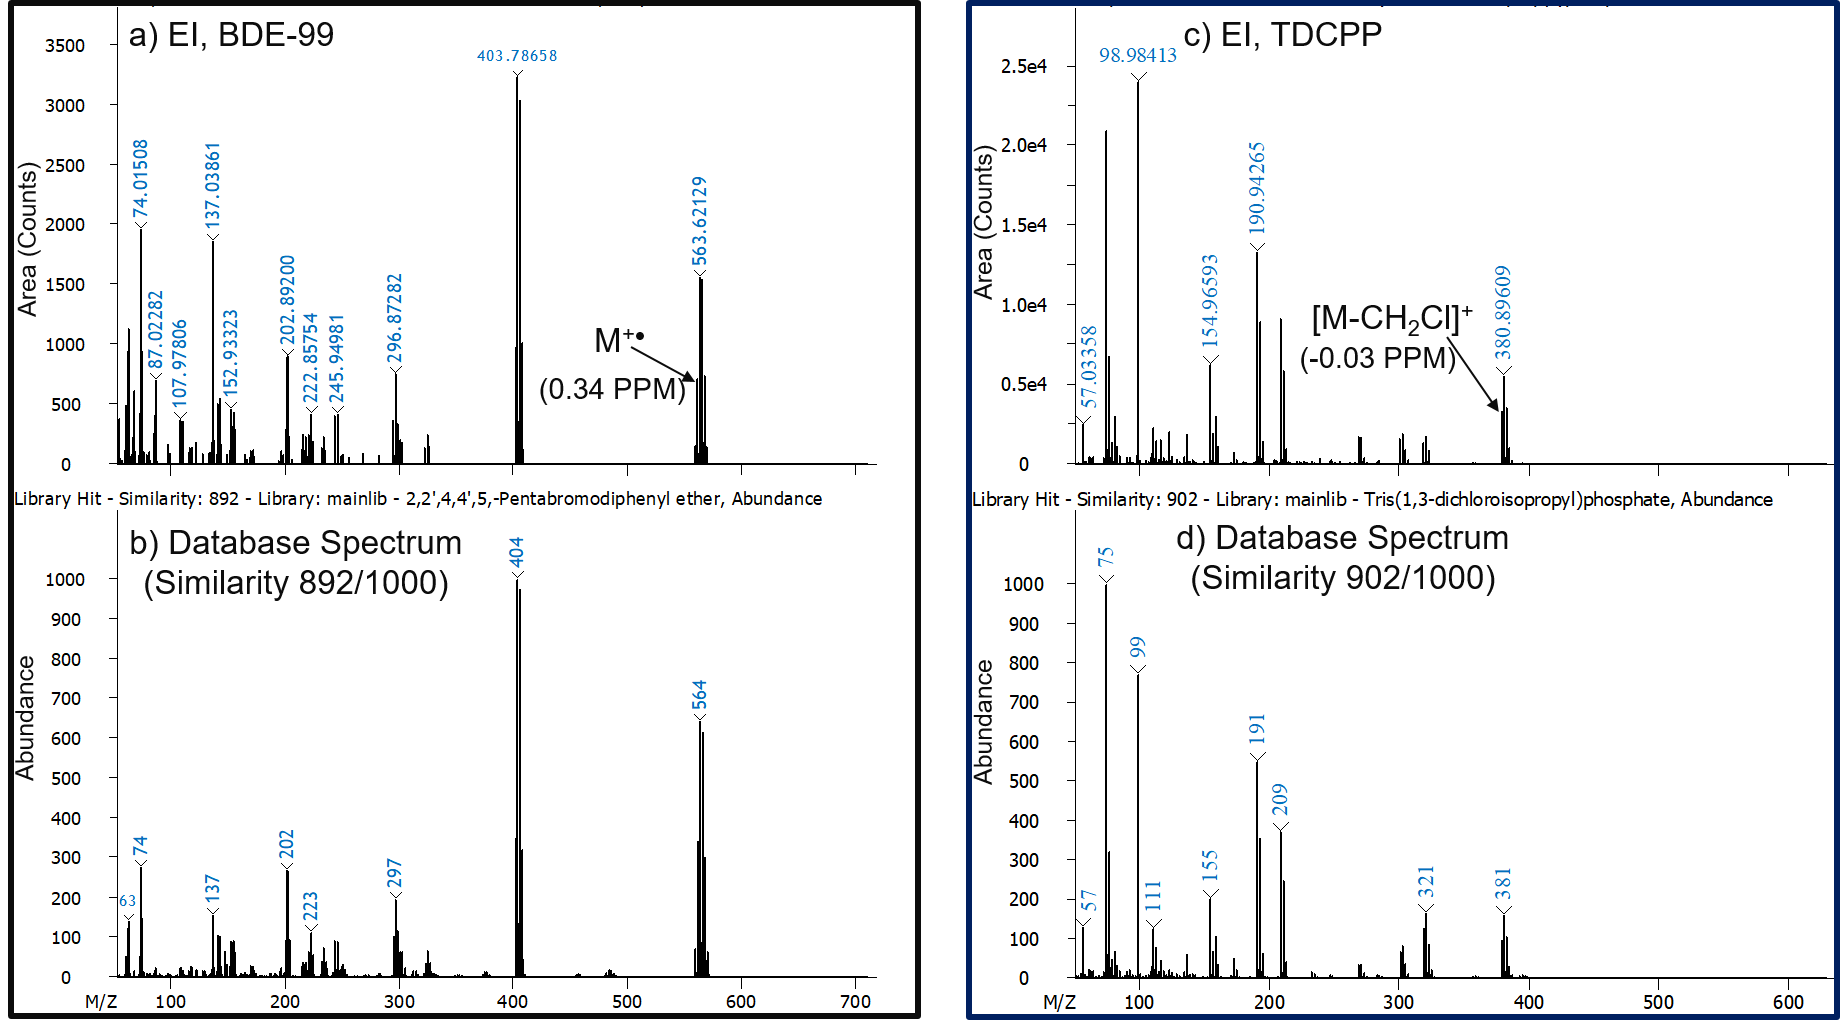
The pesticides identified in the SRM included organochlorines, organophosphates, carbamates, and pyrethroids. One example is sumithrin, a general insecticide of the pyrethroid family used for agricultural and household applications. Sumithrin, also known as D-phenothrin, is a neurotoxin used to kill mosquitoes, fleas, ticks, and head lice. Technical mixtures can be comprised of up to four stereoisomers because their structure contains two asymmetric carbon atoms. The EI Peak True and database mass spectra for the sumithrin isomer 2 are displayed in Figure 3 (similarity = 935/1000). The spectrum shows a small molecular ion with a mass accuracy of 0.20 PPM. The complementary PCI data displays excellent mass accuracy for the [MH]+, [M+C2H5]+, and [M+C3H5]+ adducts (m/z 351.19547, -0.03 PPM; m/z 379.22688, 0.29; and m/z 391.22624, -1.36 PPM). In addition, a comparison of the actual molecular ion cluster in the PCI spectrum for sumithrin and the theoretically generated cluster resulted in an excellent match (isotopic fidelity = 990/1000). The EI and ECNI for the electron-deficient pesticide, trans-chlordane, are displayed in Figure 4. The EI spectral similarity and mass accuracy values were 788/1000 and -0.22 PPM ([M-Cl]+). As expected, a significant increase in sensitivity (>10x), and production of an intense molecular anion (-0.05 PPM, Fidelity = 982/1000) was apparent when using ECNI.
Figure 3: (a) Deconvoluted EI and (b) database mass spectra for sumithrin (isomer 2) (c) Deconvoluted PCI mass spectrum for sumithrin (isomer 2) and (d) Calculated PCI ion cluster and isotopic fidelity score for sumithrin (isomer 2).
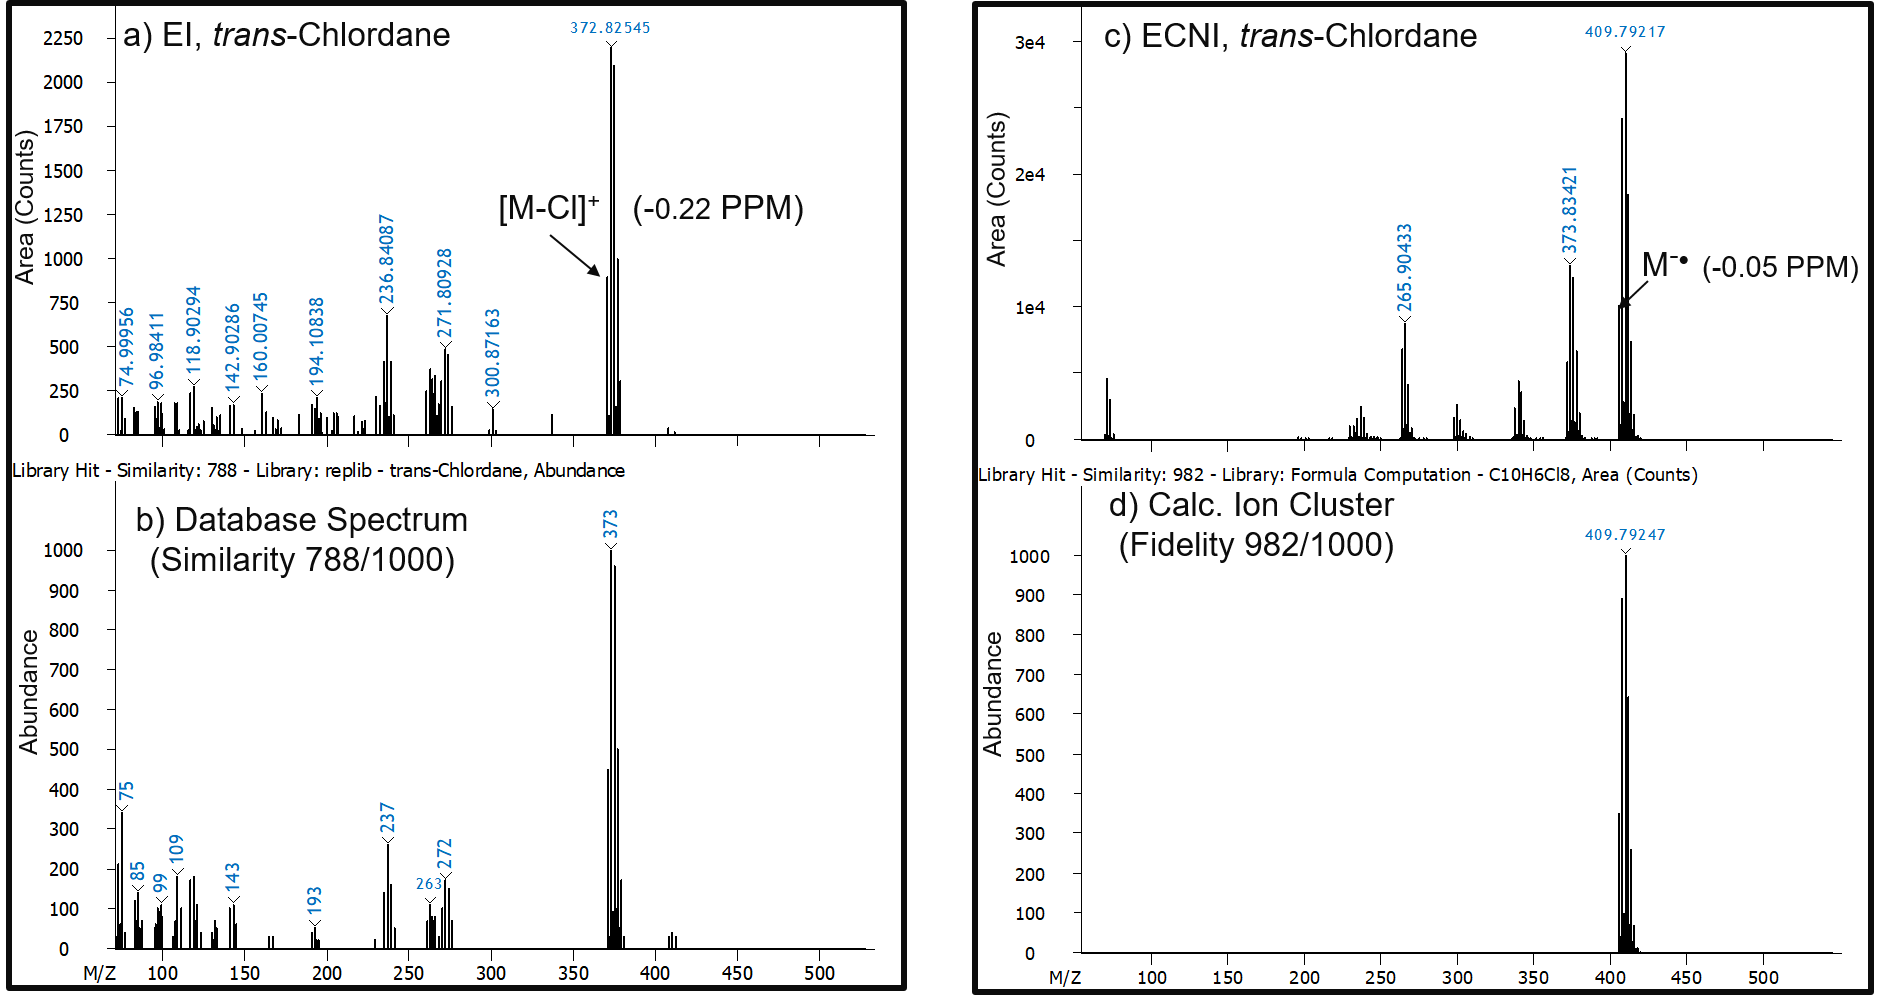
After analyzing the results of the untargeted data processing of comprehensive NIST SRM data, trace compounds of interest were identified and targeted in the comprehensive GCxGC data. Targeted processing is fast and ideal for trace analysis, quantitative analysis, or both. In this study, 40 halogenated pollutants were targeted on ECNI contour plots with pinpoint accuracy with two retention time (tR) values and two abundant HRAM masses. For example, the [M+2]-• (407.79539) and [M+4]-• (409.79247) ions were used to target trans-chlordane (C10H6Cl8) in comprehensive data files. The list of target pollutants included hexachlorobenzene, polychlorinated naphthalenes (PCNs), heptachlor isomers, chlordane isomers, polychlorinated biphenyls (PCBs), nonachlor isomers, and BDE-71. TAF processing results for the NIST SRM, household, and office samples are listed in Table II. These results demonstrated that NIST 2585 SRM contained more pollutants than either the office or household samples, which was expected because the NIST SRM consists of a large collection of dust samples from different sources, whereas the office and household samples were limited to specific locations.
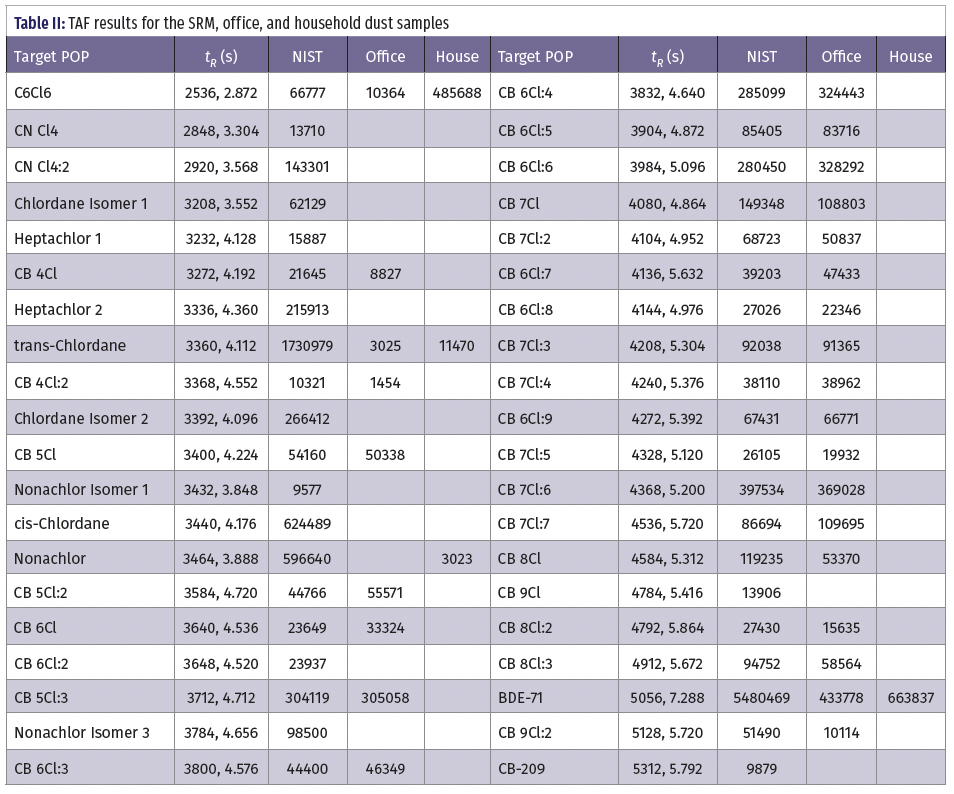
Figure 4: (a) Deconvoluted EI and (b) database mass spectra and similarity score for trans-chlordane. (c) Deconvoluted ECNI mass spectrum and (d) calculated ion cluster with isotopic fidelity score for trans-chlordane.
Summary
Household and office dust are good indicators of human exposure to hazardous substances. In this study, an improved analytical approach using GCxGC with high resolution mass spectrometry (HRMS) was utilized for the untargeted characterization of dust samples. Compounds were identified using a combination of database searches and formula determinations for molecular and fragment ions. Complementary PCI and ECNI modes of ionization produced data that improved confidence in compound identification. Dust analysis result comparisons demonstrated that there were more POPs in the SRM as compared to the household and office samples. The total number of compounds characterized in this study was much greater than the number reported in the certificate of analysis for SRM. For example, chlorinated naphthalenes and large numbers of polychlorinated paraffins were not listed in the SRM certificate; however, they were identified during this study.
References
- C. Moschet, T. Anumol, B.M. Lew, D.H. Bennett, and T.M. Young, Environ. Sci. Technol. 5(52), 2878–2887 (2018). DOI: 10.1021/acs.est.7b0576.
- H.M. Stapleton, T. Harner, M. Shoeib, J.M. Keller, M.M. Schantz, S.D. Leigh, and S.A. Wise, Anal. Bioanal. Chem. 384(3), 791–800 (2006). DOI: 10.1007/s00216- 005-0227-y.
- T.P. Whitehead, C. Metayer, M. Pe- treas, M. Does, P.A. Buffler, and S.M. Rappaport, Environ. Health Perspect. 121(5), 543–550 (2013). DOI: 10.1289/ ehp.1205821.
- C. Bergh, G. Luongo, S. Wise, and C. Ostman, Anal. Bioanal. Chem. 402(1), 51–59 (2012). DOI: 10.1007/s00216-011-5440-2.
- P. Rostkowski, P. Haglund, R. Aaliza- delh, N. Alyglzakis, N. Thomaidis, J.B. Arandes, et al, Anal. Bioanal. Chem. 411(10), 1957–1977 (2019). DOI: 10.1007/ s00216-019-01615-6.
- NIST, SRM 2585 - Organic Contaminants in House Dust. https://www-s.nist. gov/srmors/view_detail.cfm?srm=2585 (accessed January 15, 2022).
David E. Alonso, Todd Richards, and Joe Binkley are with LECO Corporation, in St. Joseph, MI. Direct Correspondence to: joe_binkley@leco.com

New Method Explored for the Detection of CECs in Crops Irrigated with Contaminated Water
April 30th 2025This new study presents a validated QuEChERS–LC-MS/MS method for detecting eight persistent, mobile, and toxic substances in escarole, tomatoes, and tomato leaves irrigated with contaminated water.

.png&w=3840&q=75)

.png&w=3840&q=75)


.png&w=3840&q=75)


.png&w=3840&q=75)


