Comprehensive Characterization of Monoclonal Antibodies Using a Microfluidic Chip-Q-TOF Platform
Special Issues
Accurate, sensitive, and comprehensive characterization of monoclonal antibodies is an absolute necessity to the pharmaceutical and diagnostic industries to meet regulatory requirements and ensure the efficacy and safety of the final product. Microfluidic chip-based high performance liquid chromatography technology interfaced with the mass accuracy of quadrupole time-of-flight mass spectrometry provides the ability to rapidly and efficiently assess the quality of intact monoclonal antibodies, confirm their amino acid sequence, and determine their glycosylation state, while consuming very small amounts of these precious products.
Recombinant monoclonal antibodies (mAbs) are the basis for a wide range of commercially important therapeutic and diagnostic products. These proteins are a mainstay in a wide range of diagnostic applications and technologies for measuring protein and drug levels in serum, identifying infectious agents, detecting tumor antigens and auto-antibodies, and quantifying hormones and other substances of biological importance. The market for monoclonal antibody drugs was nearly $32 billion in 2008 and represented over 30% of the global biologic drug market, according to a recent report (1). There are more than 20 FDA-approved mAb drugs already on the market, encompassing treatments for autoimmune disorders, transplant rejection, multiple sclerosis and Crohn's disease, macular degeneration, and a wide variety of cancers. These drugs are highly specific and tend to have fewer side effects than small-molecule drugs (2).
LC–MS Is an Essential Tool for mAb Characterization
Monoclonal antibodies usually are produced from mammalian cell lines (hybridomas), then purified, concentrated, and exchanged into an appropriate formulation buffer prior to being sold. Posttranslational modifications (PTMs), including glycosylation, are made to mAbs during their biosynthesis, and efficacy, clearance, and immunogenicity of the mAbs can be highly dependent upon the protein sequence as well as the absence or presence of specific PTMs (3). Although mAbs are relatively stable biomolecules, a number of chemical modifications and degradation reactions can occur during manufacturing, formulation, and storage. Highly reliable and sensitive methods for the characterization of protein purity and structural integrity are therefore absolutely necessary to assure the proper activity and safety of the finished mAb product.
Mass spectrometry (MS) has become essential for the structural characterization of mAbs, due to its superior resolution. Many structural features can be determined using MS, including intact protein mass, amino acid sequence, disulfide linkages, carbohydrate structure and profile, and a multitude of posttranslational and postproduction modifications (2). The coupling of high performance liquid chromatography (HPLC) with MS provides a very powerful tool for the characterization and identification of mAbs. LC–MS often is used during early development to screen cell culture supernatants produced using different single-cell clones from a given host cell line. LC–MS also is used during process optimization for cell culture and fermentation to maximize product yield and minimize undesirable PTMs, degradation products, and aggregates. LC–MS can provide the ability to optimize isolation and recovery of the recombinant proteins, including downstream purification. It also can help identify formulation matrices that offer optimal protection from chemical degradation and activity loss associated with conformational changes (3).
Microfluidic Chip-Based LC–MS
The high cost of development and production of mAb diagnostic and therapeutic proteins mandates the need for highly sensitive analytical methods that consume very little of the precious product. The need for sensitivity has driven the development of very small bore HPLC columns. However, the use of such nanoflow LC systems with a nanospray MS interface necessitates the use of small capillary tubing connections, which can result in frequent clogging, leaking or poor spray.
An alternative approach involves the use of unique microfluidic chips that integrate all of the necessary components directly onto a reusable biocompatible polymer chip (4,5). An HPLC-chip-MS interface module provides solvent and sample delivery to the chip, high-pressure switching of flows, and automated chip loading and positioning in the MS source. The reusable microfluidic chip integrates the sample enrichment and separation columns of a nanoflow LC system with microvalve connections and the nanospray tip for interfacing with a mass spectrometer.
An HPLC-chip can be fabricated from polyimide film that is resistant to most solvents, tolerates a wide pH range, and is compatible with the analysis of peptides and proteins. Laser ablation is used in combination with vacuum lamination of the film to create a multilayer microfluidic device (4). Resulting microchannels are packed with column materials, and metals are applied by thin-film deposition to create the electrical contacts for electrospray.
Integration of all components on the chip provides well-defined peaks that are two to three times narrower than those produced by conventional nanocolumn systems. Small elution volume and enhanced peak height provide greater sensitivity. Zero-dead-volume connections deliver the full separation efficiency of the analytical column to provide better resolution. Peak dispersion is virtually eliminated, resulting in narrower, better-defined peaks and improved separations. All of these attributes enable better injection-to-injection reproducibility.
A specialized interface containing the loading mechanism for chip positioning and the microvalve for nano-LC connections connects to the mass spectrometer. This interface positions the chip orthogonal to the MS inlet, and it also makes the necessary electrical and fluid connections to the chip. The interface process is automated, requiring the user only to slide the chip into the port. The interface module is also fully integrated and controlled by an existing HPLC system.
A wide range of column chemistries and mass spectrometers have been matched with the chip to provide solutions for mainstream applications such as intact protein analyses, protein identification and quantitation, and analysis of PTMs.
Intact Protein Analysis
The routine analysis of mAbs can be performed reliably with very small amounts of sample using an HPLC-chip–MS system. The HPLC-chip is coupled to a quadrupole time-of-flight (Q-TOF) mass spectrometer to analyze intact mAbs. To illustrate the different facets of mAb analysis, a commercially available mAb was used in the following experiments. The first step is to examine the mAb in its intact form. Charge deconvolution of the electrospray mass spectrum reveals three main forms of the mAb complex (Figure 1). The peak with a mass of 148,812.81 Da corresponded to the mAb with two units of glycan (G0F) attached, and was determined with a mass accuracy of 5.7 ppm (6). The peak with a mass of 147367.94 represents the mAb with only one unit of glycan attached, and the 145922.00 Da peak is the mAb with no glycan attached. Another peak at 148974.97 Da was assigned to the addition of a hexose unit to the G0F glycan part of the antibody (observed mass increase of 162.16 Da; calculated mass is 162.14 Da), denoted as G1F in the inset of Figure 1.
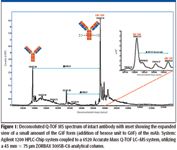
Figure 1
To confirm the assignment of the peak mass for the unglycosylated species at mass 145922.00 Da, the mAb was deglycosylated enzymatically. The mass spectrum of the deglycosylated mAb exhibits a well-defined charge state species with minimal adducts or satellite peaks, and the deconvoluted spectrum features a single molecular species at 145924.41 Da (data not shown). The calculated mass from sequence, accounting for N to D conversion that occurs during the deglycosylation reaction, is 145923.24 Da, with a resulting mass accuracy of 8 ppm. This determined mass indicates that all glycan moieties have been removed from the mAb, and it is also in close agreement with the mass assignment for the unglycosylated form (145922.00 Da) of the mAb in Figure 1.
Complete reduction of the mAb using dithiothreitol (DTT) was performed to obtain more insight into the structure by separating the light and heavy chains. HPLC-chip-MS analysis provided a measured mass of 23746.5 Da for the light chain. The calculated mass from sequence is 23746.63 Da, with a resulting mass accuracy of -5.45 ppm. The heavy chain had a measured mass of 50675.58 Da, while the calculated mass from sequence is 50675.68 Da, which equates to a mass accuracy of 1.9 ppm.
The amount of sample consumed in each of these analyses was in the low nanogram level. Thus, the high sensitivity and sub-10 ppm mass accuracy of an HPLC-chip–Q-TOF-MS system can enable rapid identification of protein heterogeneity and confirmation of glycosylation states, while requiring almost 1000 times less sample than conventional capillary HPLC methods.
Sequence Confirmation
Confirmation of the primary structure of therapeutic monoclonal antibodies is of prime importance before product release, and peptide mapping using LC–MS is an established analytical tool for mAb amino acid sequence confirmation (7). Tryptic digestion and peptide analysis of a purified mAb on an HPLC-chip–Q-TOF-MS system can yield a base peak chromatogram (BPC) that reveals the peptide peaks, with an absence of undigested protein peaks (8) (Figure 2a). The extracted ion chromatograms of some of the peptides from both the heavy and light chains demonstrate the narrow peak width and chromatographic definition that can be obtained using such a system (Figure 2b).
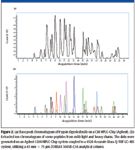
Figure 2
Dedicated, sophisticated software can be used to identify and accurately compute the masses of the peptides elucidated by HPLC-chip–Q-TOF analysis of the purified mAb. Rather than rely on peak detection alone, this software determines whether each peak belongs to a compound by looking for associated peaks that may be isotopes, peaks that can be adducts (for example, M + sodium), and peaks with multiple charges. All of these peaks are associated together to form a feature. Each feature is a discrete molecular entity (such as a peptide) that is defined by the combination of retention time and mass. This type of analysis removes unspecific chemical noise ions, as they cannot be assigned to a feature due to unclear isotopic distribution. The process of molecular feature extraction from the TOF data acts as a filter that simplifies the process of identifying each peptide and assigning a true, raw mass to it.
Applying the molecular feature extraction process to the peptide chromatographic data yielded masses for peptides from both the light and heavy chains of the digested mAb. Software also was used to generate a theoretical digestion list of peptide masses, based upon the known sequences of the light and heavy chains, and these were matched to the masses of the experimentally derived peptides within an error margin below 5 ppm (Figure 3). All of the identified peptides are in fact within 4 ppm mass accuracy, and the measured average mass deviation was only 1.35 ppm. This degree of accuracy provides a high level of confidence that each peptide is being assigned correctly.

Figure 3
The matched peptides cover 95% of the heavy chains and 85% of the light chains. However, in the characterization and quality control of mAbs, every single amino acid must be accounted for. This is accomplished using two more proteases, Glu-C from Staphylococcus aureus and chymotrypsin. The data obtained from these digestions (not shown) cover the sequences that were not elucidated by trypsin digestion. This analysis can also be performed in Q-TOF-MS-MS mode to confirm peptide masses and assure thorough sequence coverage.
Glycosylation
Glycosylation of monoclonal antibodies is one of the common posttranslational modifications. The glycan moieties have a key role in immunogenicity, effector function, and clearance, thus impacting the safety and efficacy of mAb therapeutics. Glycosylation patterns similar to those found in human serum-derived antibodies could be important, and efficacy also could be influenced by specific glycoforms. The glycosylation of a mAb is influenced by the cell clone in which it is produced, as well as the cell culture conditions such as pH, temperature, and medium. Glycosylation must therefore be characterized and monitored in great detail.
An HPLC-chip–Q-TOF MS system has been used to map the glycosylation site on a mAb after trypsin digestion. The BPC of the peptides exhibits excellent chromatographic resolution, and the mAb glycopeptide is eluted at 4.42 min (Figure 4a). Applying the molecular feature extraction software analysis, masses were generated for all of the peptides from both the light and heavy chains. These were matched to a theoretical digestion list of peptides 5 ppm error, with preferred glycosylation modifications included in the sequence of the antibody. The mass of the glycopeptide eluted at 4.42 min matched the theoretical target mass with a mass deviation of only 2.14 ppm. The mass spectrum of the glycopeptide is shown in Figure 4b, along with its amino acid sequence. The 4+ and 3+ charge state peaks are both easily discernible at the high resolving power of the MS system.
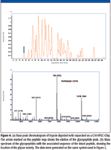
Figure 4
In addition to the accurate mass measurement of glycopeptides in MS only mode, an HPLC-chip–Q-TOF-MS system can generate MS-MS data to elucidate characteristic sugar oxonium ion fragments that can be used to confirm the identity of the glycopeptide. The product ion spectrum of the triply charged precursor of the glycopeptide showed major ion signals in the lower and mid m/z range attributed to glycan fragmentation, and some minor ones attributed to glycopeptides (data not shown). The peptide sequence (TKPREEQYNSTYR) has only one asparagine residue/NXT motif that is a known site of glycosylation in mAbs. Therefore, it was deduced that the glycan is attached to the asparagine residue of the NST motif in the peptide sequence.
The glycan was released enzymatically from the mAb in order to further characterize it. The released glycan was analyzed on a graphitized chip, which retains the glycan better than the regular C18 reversed-phase column. One of the advantages of working with a microfluidic chip-based system is that modularization can allow rapid switching from one chip to another and therefore, one type of analysis to another, which is not really possible with classic nano-LC systems. The extracted ion chromatogram of the glycan shows that it is split into a pair of peaks, due to anomerization of carbon at the reducing end (Figure 5a). The MS-MS spectrum of the glycan reveals the diagnostic ion at 204.085, which is also the most intense ion (Figure 5b). The possible fragment structures measured within 2 ppm mass accuracy also are shown. This spectrum confirms the GO diantennary structure expected for the mAb glycan.
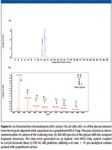
Figure 5
Conclusions
An HPLC-chip–Q-TOF-MS system is a powerful tool for full characterization of commercially important monoclonal antibodies. Consuming only nanogram amounts of the precious sample, it can provide accurate characterization of the intact protein, complete peptide mapping and amino acid sequence coverage, and confirmation of the glycan structure attached to the protein complex. This accurate and versatile tool meets the needs of diagnostic and pharmaceutical companies to monitor the purity and structural integrity of mAbs from screening of cell culture supernatants, through production process optimization and purification, and on to formulation.
Keith Waddell is LC–MS Application Solutions Manager and Ravindra Gudihal is an Applications Scientist with Agilent Technologies, Santa Clara, California.
References
(1) Monoclonal Antibody Therapeutics 2009-2024, Marketing Report, Vision Gain Inc., London, UK.
(2) Z. Zhang et al., Mass Spectrom. Rev., 28, 147–176 (2009).
(3) C.A. Srebelus Barnes and A. Lim, Mass Spectrom. Rev. 26, 370–388 (2009).
(4) H. Yin et al., Anal. Chem. 77, 527–533 (2005).
(5) M.H. Fortier et al., Anal. Chem. 77, 1631–1640 (2005).
(6) R. Gudihal et al., Primary characterization of a monoclonal antibody using Agilent HPLC-Chip Accurate-Mass LC/MS technology, Agilent Application Note 5990-3445EN (2008).
(7) F.M. Greer, Pharm. Tech. 25(1), 83–90 (2001).
(8) R. Gudihal and K. Waddell, Peptide mapping of a monoclonal antibody using a microfluidic-based HPLC-Chip coupled to an Agilent Accurate-Mass Q-TOF LC/MS, Agilent Application Note 5990-4587EN (2008).

Polysorbate Quantification and Degradation Analysis via LC and Charged Aerosol Detection
April 9th 2025Scientists from ThermoFisher Scientific published a review article in the Journal of Chromatography A that provided an overview of HPLC analysis using charged aerosol detection can help with polysorbate quantification.
Analyzing Vitamin K1 Levels in Vegetables Eaten by Warfarin Patients Using HPLC UV–vis
April 9th 2025Research conducted by the Universitas Padjadjaran (Sumedang, Indonesia) focused on the measurement of vitamin K1 in various vegetables (specifically lettuce, cabbage, napa cabbage, and spinach) that were ingested by patients using warfarin. High performance liquid chromatography (HPLC) equipped with an ultraviolet detector set at 245 nm was used as the analytical technique.
Removing Double-Stranded RNA Impurities Using Chromatography
April 8th 2025Researchers from Agency for Science, Technology and Research in Singapore recently published a review article exploring how chromatography can be used to remove double-stranded RNA impurities during mRNA therapeutics production.


