Chemical Warfare Agent Spectral Imaging for Real-Time Identification and Localization
Special Issues
In this article, the authors discuss the need for protection against chemical attacks and the role of passive imaging spectroradiometers in the detection of remote chemical agents.
Military personnel face a number of threats on the battlefield. Chemical and biological attacks are some of the most insidious threats since they are silent and hard to detect and can have devastating effects. Chemical and biological weapons have been referred to as "the poor man's atomic bomb" because of the low cost and relative ease of fabrication using materials and supplies that are used extensively for civilian purposes and thus easily accessible. Despite the Convention on the Prohibition of the Development, Production, Stockpiling and Use of Chemical Weapons and on their Destruction (1) signed by many nations in 1993, there is evidence that some countries are fabricating and stockpiling such weapons.
Because of their ease of fabrication and use, chemical weapons might also be used by terrorist cells. The tools to detect chemical attacks are thus very relevant for homeland security. In fact, the threat of chemical attacks is more likely to come from nonmilitary-related toxic industrial chemicals (TIC) because of their availability and low cost. As a consequence, the requirements for modern chemical agent detectors now also include a long list of TICs.
The ideal chemical agent sensor must detect, identify, and ultimately quantify several chemical species (chemical warfare agents [CWA] or TICs) in the areas interrogated. Because of the lethality of the target species, the ideal chemical sensor must operate remotely, up to 5 km from the threat and in near real time, to provide the alert in about 1 min. Chemical agent analysis requires identification capability, to select the course of action (for example, to identify what type of suit to don) and spatial localization capability, to determine where the threat is present. With the localization and meteorological information, one can predict when the threat may reach populated areas, what actions to take, and where not to send troops (contamination avoidance).
Given this great need, various technologies are already in existence for the detection of CWA and TICs. The most developed and deployed solutions are point sensors (2) that operate using several techniques, including ion mobility spectrometry, conventional infrared absorption spectroscopy, colorimetric chemistry, and flame ionization. These sensors can be characterized as sniffers and operate on the principle of sampling the surrounding air to analyze its constituents, searching for chemical agents. While most of these techniques can be very sensitive and good at differentiating various chemical species, they lack the capability to detect chemicals remotely. This leads to deployment problems when large areas need to be protected and to difficulties of decontamination after an event has occurred. One can thus understand why the development of remote sensors has been supported for decades to complement point sensors.
The most mature operational chemical remote sensor is the U.S. Army Joint Service Lightweight Standoff Chemical Agent Detector (JSLSCAD) (3). According to General Dynamics, "The JSLSCAD is a small, fully automatic, passive standoff chemical, nerve, blister, and blood agent vapor detector. The sensor is a portable sensor system capable of detecting chemical clouds from a fixed site (tripod) as well as 'on-the-move' mounted on a vehicle."
The JSLSCAD sensor is a spectroradiometer operating in the thermal infrared region of the electromagnetic spectrum. This passive method of chemical analysis relies on the unbalance of emission and absorption of chemical species in the field of view of the instrument. If the gas is warmer than the temperature of the background, the spectral bands of the molecules in the gas appear in emission, while the same bands are seen in absorption when the gas is colder (4). This technique is analogous to the conventional laboratory infrared absorption spectroscopy except that in the case of passive spectroradiometry, the source of radiation is the background or the gas itself. The JSLSCAD sensor features a single field of view that is scanned 360° in the surrounding environment using an optical–mechanical scanner. When a gas is detected, the sensor applies verification algorithms based upon spectral information to identify the chemical species and confirm the presence of the threat.
Although current chemical remote sensors have proven their value, there is still room for improvement given the critical need for detection. There exists a consensus that more or better spectral–spatial–temporal information would lead to better detection. In particular, it is believed that the gathering of several fields of view (that is, imaging) will improve the quality of the detection. Imaging is now included in the roadmaps of future generations of chemical remote sensors (5). In theory, a single-pixel sensor can be configured to do imaging, but because of the overhead of the dead time between spectra, the use of single-pixel sensors is quite inefficient at collecting high-resolution images. Imaging spectrometers with large focal plane arrays operated in the staring mode are approximately 10–100 times more efficient at this task.
Requirements for Remote Chemical Agent Detectors
The requirements for chemical agent detectors usually focus on the list of agents, threshold concentrations, probability of detection, time for detection, and probability of false positives. See for example the specification for the "Commercial joint services lightweight standoff chemical agent detector" (6) issued by Joint Program Executive Office for Chemical and Biological Defense.
System modeling is necessary to flow down these agent requirements to instrument requirements. This operation usually is performed by the provider of the solution and requires fairly complex radiative transfer models. The light reaching the sensor is governed by the emission and absorption of all gas layers in front of the target gas as well as the emission from the background behind the target (4).
The emission of any material is given by its emissivity times the Planck function, while absorption in a gas is modeled by Beer's law (7). Both Planck's relation and Beer's law are nonlinear functions. It is possible to implement numerical algorithms (8,9) to solve this radiative system by coding the full nonlinear physical model and an iterative solving procedure.
To simplify the calculations, it is also possible to linearize the problem. The brightness temperature difference between the spectrum measured in the presence of a gas and the spectrum measured in the absence of the gas can be expressed by equation 1, assuming the gas concentration is low, which is expected for detection close to threshold (10).

where L is the measured radiance (W/cm2/sr/cm–1)
LBG is the background radiance (W/cm2/sr/cm–1)
BT() is the brightness temperature (K)
α is the gas absorption coefficient (m2/mg)
c is the gas concentration (mg/m3)
l is the gas pathlength (m)
TG is the gas temperature (K)
TBG is the background temperature (K)
Once this linear assumption is made it becomes possible to exploit the wealth of existing methods developed in the field of chemometrics and multivariate analysis. Several researchers have developed efficient methods (11,12) in order to retrieve simultaneously varying quantities from complex observables such as spectra data. The choice of a detection algorithm among the various methods is generally based on three key factors: the composition of the analyzed pixel, the type of model used to estimate the variability of the target and background spaces, and the model used to describe the mixed pixels. Several examples of retrieval can be found in the literature (10,13,14).
Spectral Resolution Requirements
The spectral resolution is an important instrumental parameter because it defines the capability of the instrument to resolve the various spectral features of the chemical species of interest. For gases around room temperature and pressure, the FWHM of individual gas lines is dominated by pressure broadening and is on the order of 0.1 cm–1 (15). However, it is not necessary to resolve individual lines but rather to choose a spectral resolution in which most species can be distinguished from one another. Figure 1 shows the spectral signatures of nine gases at a spectral resolution of 4 cm–1 in the 850–1300 cm–1 (7.7–1.8 μm) spectral range. These gases are spectrally representative of CWA signatures. For example, it is clear that the TEP and DMMP signatures are quite similar around 1050 cm–1. A certain spectral resolution must be utilized for the DMMP shoulder at 1075 cm–1 to be resolved and usable to discriminate against the TEP measurements. Similarly, a certain spectral resolution must be utilized to correctly represent the sharp CH3OH peak at 1035 cm–1 to distinguish this gas from the ozone, which otherwise displays a very similar spectrum.
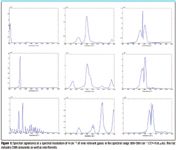
Figure 1
The motivation for utilizing a coarser spectral resolution is to improve the signal-to-noise ratio (S/N) of the measurement. Equation 2 describes how the noise equivalent spectral radiance (NESR) varies with spectral resolution Δσ. For an equal observation time t, the NESR is inversely proportional to the spectral resolution Δσ. For example, the NESR at 4 cm–1 should be four times higher than at 16 cm–1. Consequently, choosing an unnecessarily fine spectral resolution adversely affects the sensitivity of the instrument.

where NEP(σ) is the noise equivalent power (W/ √Hz)
Δσ is the spectral resolution (cm–1)
AΩ is the instrument optical throughput (cm2sr)
ε(σ) is the instrument efficiency ()
t is the observation time (s)
The spectral resolution chosen for most passive FTS chemical agent detectors ranges from 4 cm–1 to 32 cm–1. The coarser spectral resolution is typically used for searching and detecting without definite identification. The finer spectral resolution is typically used for more detailed spectral analysis and identification of gases on interest.
Spectral Range Requirements
The spectral range of chemical agent detectors is chosen with three criteria in mind:
- To be a remote sensor and detect over long distances, the instrument must use a spectral range in which the atmosphere is transparent. The atmosphere absorbs in several regions of the electromagnetic spectrum, mainly because of water vapor and carbon dioxide molecules. The chemical agent detector must then operate in the so-called atmospheric windows where the absorption is low and the transmission is high. Figure 2 shows the conventional 3–5 μm MWIR window and the 8–12 μm LWIR window over 1-km and 5-km path lengths.
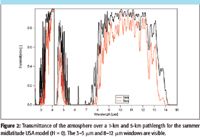
Figure 2
- The spectral range obviously must coincide with the location of spectral features of the chemical species of interest. In analytical chemistry, the region from about 850 to 1300 cm–1 (7.7–11.8 μm) is called the fingerprint region. The bands in this region originate from vibrational modes, resulting in a rich but unique absorption pattern. It is thus possible to differentiate between most compounds by measuring this region. Figure 1 illustrates this statement well: each gas is quite distinguishable from the others. Other spectra regions, including the 3–5 μm atmospheric window, feature less usable bands and are used much less often.
- The spectral range also must be chosen to maximize the S/N. Because the driver in a passive chemical measurement is the temperature contrast between the gas cloud and the background, it is more appropriate to express the noise of the sensor using the noise equivalent temperature difference (NeDT) instead of the noise equivalent spectral radiance (NESR). Assuming typical values of NESR = 2 nW/cm2/sr/cm–1 for a sensor operating in the MWIR (3–5 μm) and NESR = 10 nW/cm2/sr/cm–1 for a sensor operating in the LWIR (8–12 μm), we calculate the corresponding NeDT for a reference emitter at room temperature (300 K) as shown in Figure 3. The MWIR range rapidly degrades toward the shorter wavelengths and requires a larger temperature contrast to yield the same S/N. The temperature contrast varies greatly according to the environment and the viewing geometry. On sunny days, the objects are heated while the sky (viewed directly or through diffuse reflection) is very cold, yielding good contrast. On cloudy days or at night, the gradients are smaller. In normal environments the temperature gradients vary from 0.2 to 2 K. For such environments, Figure 3 demonstrates that the MWIR S/N would be insufficient except for a very narrow spectral range. The situation is even worse for other atmospheric windows at shorter wavelength than the MWIR. Atmospheric windows at wavelengths longer than the LWIR also exist, but good detectors for these ranges are not practical to use in the field.
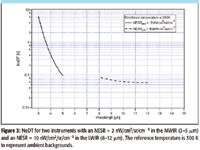
Figure 3
Temporal Requirements
The published requirements for detection response time range from a fraction of a minute to 2 minutes (6). These specified times must be shared among all of the sensor views performed to cover the field of regard.
Figure 4 shows the temporal evolution of a field release of SF6 (purple cloud) at a rate of 1.25 kg/min and demonstrates that the temporal evolution of a gas cloud is relatively slow on a field of regard shown (6.4° horizontal). The time interval between frames is 6.2 s. In the horizontal direction, the cloud is moving with the wind at a speed of approximately 5 m/s. The diffusion of the cloud in the vertical direction is approximately 1.3 m/s. It is interesting to note the presence of gas swirls indicative of turbulence.
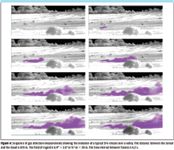
Figure 4
Although the clouds move relatively slowly, the movement is fast enough and the shape of the plume changes so that any raster scanning must be extremely rapid to adequately build an accurate representation (imaging) of the plume.
Sensitivity Requirements
The sensitivity is the cardinal requirement for any passive remote chemical agent detector and is usually represented by the NESR. The NESR, described in equation 2, represents the minimum radiance detectable by the sensor (that is, the radiance for which the S/N is equal to 1). In typical passive chemical agent sensing scenarios, an NESR of 5–10 nW/cm2/sr/cm–1 for a spectral resolution of 4 cm–1 meets the detection and identification requirements for most chemical agents. This is also visible in Figure 3, considering that the typical temperature gradients are above 0.2 K.
The clouds generated during chemical attacks are relatively dense and produce fairly large absorption/emission features. The concentration levels specified are integrated column densities in mg/m2, or as the product cl in equation 1.
Equation 2 shows that the sensitivity variation is inversely proportional to the square root of the observation time. Sensitivity comparison between various instruments must be performed for an equal field of regard (spatial range), for an equal instantaneous field of view (spatial resolution), for an equal spectral resolution, and for an equal observation time.
Field of Regard and Instantaneous Field of View Requirements
The field of regard is the angular region that the sensor must interrogate. The instantaneous field of view (IFOV) is the angular resolution or the extent of a single pixel. Ideally, the instrument IFOV should be twice as small as the dimension of the cloud. If the instrument IFOV is larger than twice this value, the measurement is impure (a mixture of background and target). In the case of a mixture, the signal is diluted, leading to lowered sensitivity, and the retrieval algorithm is complicated by the fact that it has to perform spectral "unmixing" (12).
In Figure 4 the cloud is fairly small, about 10 m in the vertical dimension. For all the releases that we have measured, we have seen typical vertical cloud dimensions of 10–50 m. This dimension yields an ideal angular resolution of 1–5 mrad at 5 km to 5–25 mrad at 1 km.
For the data depicted in Figure 5, the ideal IFOV of 6 mrad (optimized for the measurement of the cloud) is too large to preserve the visual spatial information for medium scale objects (ground texture, bushes, and trees). An IFOV of 1–2 mrad is required to preserve this information at 870 m. For longer distances (up to 5 km), the situation is even more demanding and requires a narrower IFOV. The preservation of the visual cues from medium scale objects is not a requirement, but it brings invaluable benefits in the data analysis. Indeed, with enough spatial resolution as shown in the three bottom images of Figure 5, one does not need to rely on boresighted cameras to locate a detected event. In these three cases, the thermal imagery that can be derived from the imaging spectrometer provides a spatial map with no boresighting errors.

Figure 5
The published requirement for field of regard ranges from 60° cylindrical range with a detection time of 30 s to 360° × 60° (azimuth × elevation) with a detection time of 90 s (6). The 360° × 60° scenario tends to be a worst-case scenario since one usually knows where the threat may come from, given the physical characteristics of the land (mountains or forests) and wind information. Other scenarios of smaller extent are also considered, such as 120° × 45° (azimuth × elevation) and 60° × 30° (azimuth × elevation).
Imaging Spectroradiometry
Imaging spectroradiometers are uniquely positioned to meet the requirements for the next generation of remote chemical agent detectors. There are numerous methods for constructing imaging spectroradiometers. Given the high dimensionality and volume of the data to be acquired, most sensors use detector arrays that provide several simultaneous measurement channels.
A common way to construct an imaging spectroradiometer is to use a dispersive element (grating or prism) and to reimage the spectrometer entrance slit onto a two-dimensional photodetector array (for example, on a CCD). This type of instrument is able to capture instantaneously one spatial line of the field of regard; what is admitted by the slit. To get the full field of regard, the instrument pointing must be scanned across the scene. In the case of aircraft or space-borne instruments, the motion of the platform usually provides this scanning. For fixed site operation (such as tripod or mast-mounted instruments), a scanning mechanism must be provided to build the second spatial dimension. Furthermore, scanning usually must be repeated to provide the temporal dimension.
A somewhat simpler way to construct an imaging spectroradiometer is to use a conventional imaging configuration and to add spectral modulation somewhere in the optical path. Numerous nonmultiplex spectral modulation methods have been used in which the bands of interest are admitted sequentially using multiple bandpass filters (often mounted on a filter wheel) or tunable bandpass filters (for example, a Fabry–Perot etalon [10]).
Multiplex spectral methods can present some sensitivity advantages when scene-independent noise components are present (such as detector readout noise). Multiplex methods include Michelson-type interferometers, also known as Fourier transform (FT) spectrometers. In an FT spectrometer, the scene light is spit into two beams whose optical paths are varied differentially and recombined to allow interference. The FT spectrometer also presents the advantage to achieve very high spectral resolution while keeping a large light throughput capability, another criterion for sensitive measurements. FT spectroscopy is also the spectral technology used in JSLSCAD (3) and the operational remote chemical detectors used before JSLSCAD.
The best example of a commercial IR imaging spectroradiometer based on FT technology is the Hyper-Cam, a man-portable imaging spectroradiometer developed by Telops. This sensor offers a flexible combination of sensitivity and spatial, spectral, and temporal resolutions compliant with the requirements for passive remote detection of gases. It has proven its dependable performance and effectiveness as a standoff chemical agent detector in numerous field campaigns (13,14). The Hyper-Cam-LW features 320 × 256 pixels over a basic 6.4° × 5.1° field of regard, a user-selectable spectral resolution between 0.25 and 150 cm–1 over the 8–11.8 μm spectral range, and a 0.15 K sensitivity for each pixel of the scene at 16cm–1 spectral resolution for a 0.5-s observation time. The Hyper-Cam has a mass of 17 kg (37.4 lb) and a volume of 0.025 m3 (0.88 ft3), ideal for operation in the field.
The Hyper-Cam instrument relies on the latest advances in high-speed infrared focal plane arrays and the impressive processing power of modern signal processing electronics. The sensor is capable of generating calibrated data (Fourier transformed and radiometrically calibrated) in real time at the highest data rate. This real-time processing allows lossless compression by a factor of approximately 10–20, a welcome factor for such a high-throughput instrument.
The Hyper-Cam sensor was designed from the ground up so the control and the data acquisition are specifically optimized for FT spectroscopy. In particular, each datacube is tagged with extensive sensor health data to enable automated processing and performance enhancement when needed. For example, sampling jitter can be reduced by using the recorded samples positions. Post-acquisition corrections are applied to the interferogram (17).
Spatial Characteristics
To meet the requirements discussed earlier, the Hyper-Cam instrument IFOV and field of regard can be adapted by using two telescopes with the optical magnification listed in Table I. These telescopes are wide angle and increase the angular ranges in the field.

Table I: Three Hyper-Cam configurations for chemical sensor
Configuration A covers the 360° × 60° (azimuth × elevation) field of regard by changing the line of sight of the instrument three times using a motorized panoramic platform. In this case, the time to detect must be divided by three for each stare, minus the time required to change the azimuth. Configuration B covers the 120° × 45° (azimuth × elevation) scenario without any need to change the instrument line of sight; the instrument is operating in the staring mode. In configuration C, the instrument is also staring and covering the 60° × 30° (azimuth × elevation) field of regard.
Spectral Resolution and Temporal Characteristics
The Hyper-Cam instrument allows performing trades between its datacube rates and the spectral resolution and detector windowing by selecting parameters in the control software. Figure 6 displays the datacube measurement rate versus spectral resolution for a few detector windowing choices. Configurations A and C in Table I are represented by the green circles in Figure 6, while configuration B is represented by the blue crosses.
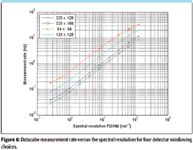
Figure 6
If the sensor is operated at a spectral resolution of 16 cm–1 initially to perform a quick detection, a complete dataset is obtained in 12 s, 1.3 s, and 1.7 s for configurations A, B, and C, respectively, assuming that it takes 2 s to change the instrument line of sight by 120° (azimuth) for configuration A.
A single-pixel FT spectroscopy sensor would take much longer to raster scan the same area, principally because of the limited duty cycle of the interferometer sweeping mirror reversal time, which takes 5–10 ms in the best cases. Assuming a measurement rate of 100 Hz, a single-pixel sensor would take over 25 min, 6 min, and 8 min to cover configurations A, B, and C, respectively. The time advantage of the Hyper-Cam instrument can be utilized to average the spectra and therefore increase the S/N and to provide a much faster response time.
Highly resolved chemical images have only recently become possible through the advances of fieldable imaging spectroradiometers. Researchers are beginning to discover their inherent qualities and how to best exploit their potential. Advantages of the high spatial resolution enabled by the imaging spectroradiometer include:
- Using a small IFOV causes less signal dilution because pixels are either filled or empty by the target of interest. A pure pixel leads to a better S/N. The background in a small pixel is also less likely to be a mixture of backgrounds. This may simplify the retrieval method or improve the quality of the result.
- More resolved images enable a better localization of the cloud and its source. Visually interpretable images can be derived from high spatial resolution datacube, eliminating boresighting errors. Figure 7 shows a chemical image of TEP (red) superimposed on a brightness temperature image of the scene. Both images are derived from the acquired datacubes and thus are perfectly co-registered.
- High-quality images are acquired because of the absence of artifacts caused by (raster) scanning and because complete datacubes are acquired in seconds.
- New scenarios are being investigated regarding the possibility to use a human in the loop for chemical alarm validation. Every human has extensive training in visual processing from our everyday activities such as driving or even walking in a crowd. We believe that it is possible to reduce false alarms by having an operator interpret the high spatial resolution video sequences filtered for specific chemical compounds as displayed in Figure 4 and Figure 7. The operator would be able to view the sequences in which activity is detected and determine whether there is a threat in the scene. The human brain is a powerful analyzer/discriminator of the presence of objects like clouds, further improving the method.
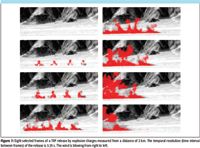
Figure 7
Conclusion
The requirements for remote chemical agent detectors are demanding for traditional sensors. The imaging spectroradiometer is a new tool to tackle this difficult problem. In particular, the imaging Fourier transform spectrometers have several desirable characteristics, including excellent imaging and sensitivity even at high spectral resolution. Researchers are only beginning to discover their inherent qualities and untapped potential.
We have presented an adaptation of an existing commercial imaging spectroradiometer using wide angle telescopes to cover large fields of regard up to 360° azimuth span. These configurations are orders of magnitude faster than existing solutions in data acquisition speed. Perhaps one of this instrument's greatest advantages is its flexibility, allowing users to investigate optimized solutions using the same instrument with various fields of regard, spectral resolutions, and spatial windows, all of which can be changed in the field.
Martin Chamberland, Vincent Farley, Philippe Lagueux, and André Villemaire are with Telops, Quebec, Canada.
References
(1) http://treaties.un.org/Pages/ViewDetails.aspx?src=TREATY&id=487&chapter=26&lang=en
(2) G. Murray and G. Southard, Instrumentation & Measurement Magazine IEEE 5, 12–21 (2002).
(3) http://www.gdatp.com/products/detection_systems/JSLSCAD/JSLSCAD.htm
(4) N. Gat, S. Subramanian, J. Barhen, M. Sheffield, and H. Erives, Proc. SPIE 3082 (1997).
(5) http://www.jpeocbd.osd.mil/packs/DocHandler.ashx?DocId=09_080520_APBI_CA.pdf
(6) Commercial joint services lightweight standoff chemical agent detector, RFP issued by the Joint Program Executive Office for Chemical and Biological Defense (2004). http://www.jpeocbd.osd.mil/packs/default.aspx?pg=1122
(7) http://scienceworld.wolfram.com/physics/BeersLaw.html
(8) R. Lachance, J-M. Theriault, C. Lafond, and A. Villemaire, Proc. SPIE 3383, 124–132 (1998).
(9) R. Harig, G. Matz, and P. Rusch, Proc. SPIE 4574, 83–94 (2002).
(10) C. Gittins and W. Marinelli, J. Jensen, Fifth Joint Conference on Standoff Detection for Chemical and Biological Defense (2001).
(11) N. H. Timm, Applied Multivariate Analysis: Methods and Case Studies, (Springer, 2002).
(12) Chein-I Chang, Hyperspectral Data Exploitation (Wiley-Interscience, New York, 2007).
(13) A. Vallières, A. Villemaire, M. Chamberland, L. Belhumeur, V. Farley, J. Giroux, and J. Legault, Proc. SPIE 5995, 147–157 (2005).
(14) V. Farley, M. Chamberland, P. Lagueux, A. Vallières, A. Villemaire, and J. Giroux, Proc. SPIE 6661 (2007).
(15) W. Benedict and L. Kaplan, J. Chem. Phys. 30, 388 (1959).
(16) F. Bouffard, J. Theriault, and P. Tremblay, Proc. SPIE 5584, 122–134 (2004).
(17) S. Roy, J. Genest, and P. Giaccari , Appl. Opt. 46, 8482–8487 (2007).

Evaluating Body Odor Sampling Phases Prior to Analysis
April 23rd 2025Researchers leveraged the advantages of thermodesorption, followed by comprehensive two-dimensional gas chromatography coupled to time-of-flight mass spectrometry (GC×GC/TOF-MS), to compare and assess a variety of sampling phases for body odor.

.png&w=3840&q=75)

.png&w=3840&q=75)


.png&w=3840&q=75)


.png&w=3840&q=75)


