Charge Detection Mass Spectrometry: Analysis of Gene Therapy Vectors
Conventional mass spectrometry is limited by heterogeneity to relatively small molecular weights from a biologics perspective. Charge detection mass spectrometry—where masses of individual ions are directly measured—overcomes this limitation and allows measurements into the gigadalton (GDa) range. An important application of this emerging technology is the analysis of gene therapy vectors. Their large size and complexity present analytical challenges that must be addressed for this promising therapeutic approach to reach its full potential.
During the last few years, gene therapy has re-emerged as a promising approach (1,2). There are now two FDA-approved therapies, with hundreds more in clinical trials. Both approved therapies use adeno-associated virus (AAV) as a vector. There are also clinical trials using adenovirus and lentivirus vectors. Adenovirus is also the basis of several novel SARS-CoV-2 vaccines. AAV, with a molecular weight (MW) of approximately 5 megadaltons (MDa), is a small virus. Adenoviruses and lentiviruses are much larger, with MWs well over 100 MDa. All these species are beyond the range of conventional mass spectrometry (MS). Their large size and complexity make analytical characterization challenging (3,4), while, at the same time, the prospect of expanding patient numbers makes detailed characterization more critical. Can MS play a role?
Electrospray allows large biomolecular assemblies to be ionized and launched into the gas phase where accurate MWs can be determined by MS (5,6). Ions generated by electrospray are often multiply charged, with megadalton-sized ions typically having more than 100 charges. In conventional MS, only the m/z ratio is measured. Because the ions are produced in a distribution of charge states, a series of m/z peaks occur for each mass. The charge can be deduced from the spacing between the peaks, and then the m/z of each peak is multiplied by its charge to give the mass. Heterogeneity, because of post-translational modifications, counterions, and trapped solvents, broadens the m/z peaks, making it difficult to assign charge states. Heterogeneity generally increases with size, and, in most cases, the charge cannot be determined for ions larger than 1 MDa without prior knowledge of the mass. Charge detection mass spectrometry (CDMS) is one way to overcome this limitation. CDMS is a single particle technique where the m/z and charge are measured simultaneously for each ion. These quantities are then multiplied to give the mass for each ion. The measurement is repeated for many different ions, and then the masses are binned into a histogram to give the mass distribution.
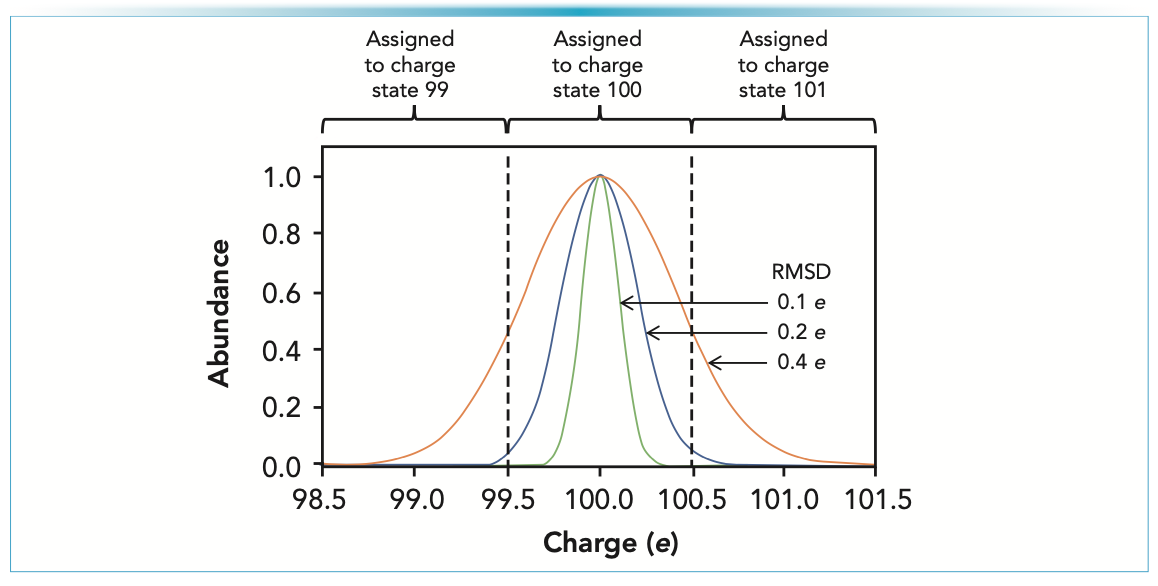
The charge on a single ion is small, and measuring it accurately has been the main challenge in CDMS since the first measurements on electrosprayed ions in the 1990s (7,8). To assign a single ion to its correct integer charge state, the measured charge must fall in a window ±0.5 e (elementary charges) of the integer charge. If the uncertainty in the charge measurement is too large, many ions will be assigned to the wrong (neighboring) charge states. As explained in Figure 1, when the root mean square deviation (RMSD) increases beyond 0.2 e, the number of misassigned ions increases rapidly (9).
FIGURE 1: Accuracy of charge measurements in CDMS. The figure shows plots of the charge distributions for RMSDs of 0.1, 0.2, and 0.4 e. To be assigned to an integer charge of 100 e, the measured charge must fall between 99.5 and 100.5 e. With a measurement RMSD of 0.1 e (green line), all the distribution falls within the 99.5–100.5 window and would be assigned to the correct charge state. On the other hand, if the measurement RMSD is 0.4 e (orange line), a substantial fraction of the distribution falls outside the 99.5–100.5 window, and these ions would be incorrectly assigned to lower (99) or higher (101) charge states. For a charge RMSD of 0.2 e (blue line), the fraction of ions falling outside the window is small, and most ions are assigned to the correct charge state.

To perform CDMS measurements, ions are trapped in an electrostatic linear ion trap where they oscillate back and forth through a detection cylinder (10–12). When an ion enters the cylinder, it induces a charge that disappears when the ion exits. The periodic signal generated by the trapped ions is sensed by a charge sensitive amplifier, and the resulting time domain signal is analyzed by fast Fourier transforms. The oscillation frequency is used to determine the m/z ratio, and the magnitude of the fundamental is related to the charge. If the detection cylinder is long enough, the full charge of the ion is induced on the cylinder, and the resulting signal is independent of the ion’s trajectory. This independence is key to measuring the charge accurately. The main factor limiting the accuracy of the charge measurement is then electrical noise. For a fixed noise level, the uncertainty in the charge measurement can be reduced by extending the measurement time. An uncertainty approximately 0.2 e is achievable routinely (13,14). The measurement time can be reduced by performing measurements on several ions at a time (15), though it is still longer than conventional MS.
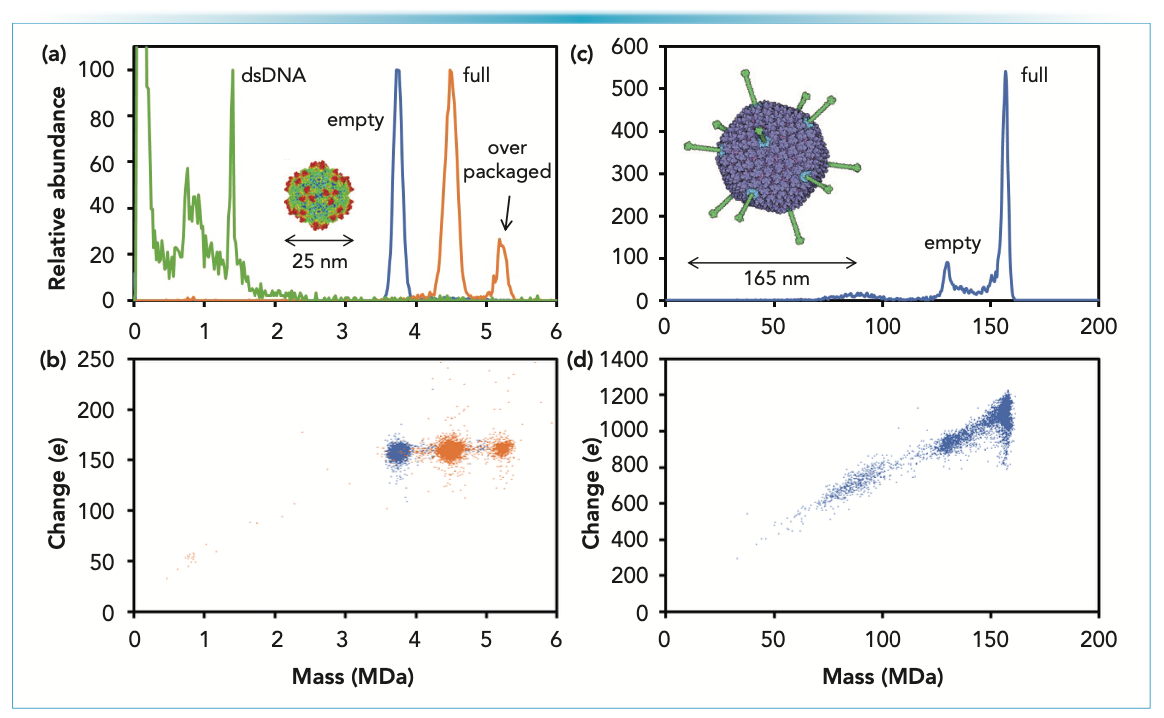
Figure 2a shows CDMS measurements for AAV vector serotype 8 (AAV8) derived from HEK cells. AAV is a small virus consisting of a capsid (a protein shell) that surrounds a single-stranded DNA genome. First, the capsid assembles, and then the genome is packaged, leading to particles that package the full genome and empty particles. The blue line in Figure 2a shows the mass distribution measured for empty AAV8 particles separated using a cesium chloride (CsCl) gradient. There is a single peak centered on 3.74 MDa. The AAV8 capsid is icosahedral and contains 60 capsid proteins. However, there are three different types of capsid protein: VP1, VP2, and VP3 that are present in a ratio of approximately 1:1:10. The sequence masses of VP1-3 for AAV8 are 81,667 Da, 66,692 Da, and 59,805 Da, respectively. Thus, the expected average mass of the empty capsid is 3.732 MDa. The measured mass (3.74 MDa) is slightly larger. It is common in native MS for measured masses to be slightly larger than the expected mass because of counterions, salt molecules, and trapped solvents. The peak is broad because the capsids contain different combinations of VP1–3. The width of the peak matches a multinomial distribution, indicating that the number of VP1-3 in each capsid is random (16).
FIGURE 2: CDMS measurements for gene therapy vectors adeno-associated virus and adenovirus. (a) Mass distributions for AAV8 empty (blue line) and AAV8 with a CMV-eGFP genome (orange line). The inset shows an image of AAV. The green line shows the spectrum measured for AAV8-eCMV-GFP after incubation to release the genome. The sharp peak at 1.37 MDa is because of the CMV-eGFP genome that has base paired in solution. (b) Charge versus mass scatter plots for AAV8 empty (blue dots) and AAV8-CMV-eGFP (orange dots). Each point is the charge and mass measurements for a single ion. (c) Mass distribution measured for HAdV5. The inset shows an image of adenovirus. (d) Charge versus mass scatter plot for HAdV5.

The orange line in Figure 2a shows the CDMS mass distribution measured for AAV8 with a CMV-eGFP genome. The AAV genome is single-stranded DNA, approximately 4700 nt for the wt virus. The CMV-eGFP genome is 2207 nt, with an average mass of 0.680 MDa. The peak in Figure 2a at 4.49 MDa is attributed to particles that have packaged the full CMV-eGFP genome. The expected mass is the mass of the empty capsid plus the mass of the genome; in this case, 3.74 + 0.68 = 4.42 MDa. The measured mass is 70 kilodaltons (kDa) larger than expected. The difference is attributed to counterions and small DNA fragments. The CMV–eGFP genome is small enough that two genomes could fit into the capsid. There is a peak at 5.22 MDa, which could be because of two genomes, but other studies suggest that this peak is probably because of a single strand of heterogeneous DNA (fragments of plasmid and host DNA) (17).
The packaged DNA can be better characterized by extracting it and analyzing it by CDMS. The green line in Figure 2a shows the mass distribution measured after incubating AAV8-CMV-eGFP at 80 °C for 15 min. After incubating the peaks at approximately 5 MDa, the intact capsids with cargo have disappeared, and there are many low mass fragments. Although not evident from Figure 2, there are also a significant number of high mass species with masses that extend beyond 100 MDa. These species result from the aggregation of AAV disassembly products. The notable feature of the green spectrum in Figure 2a is the sharp peak at 1.37 MDa. This peak is at a mass slightly larger than expected for the double-stranded CMV-eGFP genome (1.359 MDa). Although the packaged genome is ssDNA, + and – strands are packaged with roughly equal probability. Once released, the ssDNA can base pair in solution. The small deviation between the measured and expected masses of the dsDNA (11 kDa) is attributed to counterions.
Figure 2b shows the charge versus mass scatter plots for the empty AAV8 (blue) and AAV8-CMV-eGFP (orange). The charge deposited on a large electrosprayed ion depends on its size. In this case, the empty and full AAV8, and the overpackaged AAV8-CMV-eGFP all have approximately 160 charges. The fact that the charges are similar indicates that the genome is being packaged inside the capsid. If it was on the capsid surface, the charge would be larger.
The packaging capacity of AAV is relatively small, thus limiting the size of the therapeutic genome that can be used. Adenovirus, one of the largest non-enveloped viruses, is much larger than AAV (see insets in Figure 2a and 2c), and can accommodate a large genome. A mature adenovirus contains 13 different proteins, and over 2500 protein molecules. The mass distribution measured for human adenovirus type 5 (HAdV5) is shown in Figure 2c (18). The peak at 156.1 MDa is attributed to the mature particle with a genome, and the smaller peak at 129.6 MDa is assigned to immature particles that have not packaged a genome (19). The corresponding charge versus mass scatter plot is shown in Figure 2d. The full particle has an average charge approximately 1100 e. The average charge for the empty particle is approximately 900 e. The surface of adenovirus’s icosahedral capsid is decorated with fibers that play a role in cell entry. The empty particle is missing the fibers, which is why the empty particles have a significantly lower charge than the full.
The results presented here for AAV and the adenovirus illustrate the value of extending the mass range of conventional MS into the gigadalton regime. At the time of writing, CDMS is only available in a few research laboratories (20–22). However, it is being commercialized and will soon become more widely available. Recently, individual ion measurements have been performed on an orbital ion trap (23,24). The induced charge depends on the ion trajectory in this case. Consequently, the charge uncertainty is large, approximately 4% for individual ions, and the resolving power is low.
Conflict of Interest Disclosure
The author is a shareholder in Megadalton Solutions, a company engaged in commercializing CDMS.
Acknowledgments
This work was supported by the National Institutes of Health under award number R01GM131100.
References
(1) D. Wang, P.W.L. Tai, and G. Gao, Nat. Rev. Drug Discovery 18, 358−378 (2019). DOI: 10.1038/s41573-019-0012-9
(2) A.M. Keeler and T.R. Flotte, Ann. Rev. Virol. 6, 601−621 (2019). DOI: 10.1146/annurev-virology-092818-015530
(3) E.A. Green and K.H. Lee, Curr. Opin. Biotech. 71, 65−76. (2021). DOI: 10.1016/j.copbio.2021.06.025
(4) A.L. Gimpel, G. Katsikis, S. Sha, A.J. Maloney, M.S. Hong, T.N.T Nguyen, J. Wolfrum, S.L. Springs, A.J. Sinskey, S.R. Manalis, P.W. Barone, and R.D. Braatz, Mol. Ther. Methods Clin. Dev. 20, 740–754 (2021). DOI: 10.1016/j.omtm.2021.02.010
(5) J. Loo, Int. J. Mass Spectrom. 200, 175−186 (2000). DOI: 10.1016/S1387-3806(00)00298-0
(6) S. Mehmood, T.M. Allison, and C.V. Robinson, Annu. Rev. Phys. Chem. 66, 453−474 (2015). DOI: 10.1146/annurev-physchem-040214-121732
(7) S.D. Fuerstenau and W.H. Benner, Rapid Commun. Mass Spectrom. 9, 1528−1538 (1995). DOI: 10.1002/rcm.1290091513
(8) S.D. Fuerstenau, W.H. Benner, J.J. Thomas, C. Brugidou, B. Bothner, and G. Siuzdak, Angew. Chem. Int. Ed. 40, 541−544 (2001). DOI: 10.1002/1521- 3773(20010202)40:3<541::AID-ANIE541>3.0.CO;2-K
(9) D.Z. Keifer, D.L. Shinholt, and M.F. Jarrold, Anal. Chem. 87, 10330−10337 (2015). DOI: 10.1021/acs.analchem.5b02324
(10) W.H. Benner, Anal. Chem. 69, 4162−4168 (1997). DOI: 10.1021/ac970163e
(11) N.C. Contino and M.F. Jarrold, Int. J. Mass Spectrom. 345−347, 153−159 (2013). DOI: 10.1016/j.ijms.2012.07.010
(12) J.A. Hogan and M.F. Jarrold, J. Am. Soc. Mass Spectrom. 29, 2086−2095 (2018). DOI: 10.1007/s13361-018-2007-x
(13) A.R. Todd, A.W. Alexander, and M.F. Jarrold, J. Am. Soc. Mass Spectrom. 31, 146−154 (2020). DOI: 10.1021/jasms.9b00010
(14) A.R. Todd and M.F. Jarrold, J. Am. Soc. Mass Spectrom. 31, 1241−1248 (2020). DOI: 10.1021/jasms.0c00081
(15) C.C. Harper, A.G. Elliott, L.M. Oltrogge, D.F. Savage, and E.R. Williams, Anal. Chem. 91, 7458−7465 (2019). DOI: 10.1021/acs.analchem.9b01669
(16) E.E. Pierson, D.Z. Keifer, A. Asokan, and M.F. Jarrold, Anal. Chem. 88, 6718−6725 (2016). DOI: 10.1021/acs.analchem.6b00883
(17) L.F. Barnes, B.E. Draper, Y.-T. Chen, T.W. Powers, and M.F. Jarrold, Mol. Ther. Methods Clin. Dev. 23, 87−97 (2021). DOI: 10.1016/j.omtm.2021.08.002
(18) L.F. Barnes, B.E. Draper, and M.F. Jarrold, Anal. Chem. 94, 1543−1551 (2022). DOI: 10.1021/acs.analchem.1c02439
(19) E.K. Mullins, T.W. Powers, J. Zobel, K.M. Clawson, L.F. Barnes, B.E. Draper, Q. Zou, J.J. Binder, S. Dai, K. Zhang, O. Friese, H.A. Runnels, M.F. Jarrold, and L.C. Thompson, Front. Bioeng. Biotechnol. 9, 753480 (2021). DOI: 10.3389/fbioe.2021.753480
(20) R. Antoine, Rapid Commun. Mass Spectrom. 34, e8539 (2020). DOI: 10.1002/rcm.8539
(21) C.C. Harper, D.D. Brauer, M.B. Francis, and E.R. Williams, Chem. Sci. 12, 5185−5195 (2021). DOI: 10.1039/D0SC05707J
(22) B.L. Barney, R.T. Daly, and D.E. Austin, Rev. Sci. Instrum. 84, 114101 (2013). DOI: 10.1063/1.4828668
(23) J.O. Kafader, R.D. Melani, K.R. Durbin, B. Ikwuagwu, B.P. Early, R.T. Fellers, S.C. Beu, V. Zabrouskov, A.A. Makarov, J.T. Maze, D.L. Shinholt, P.F. Yip, D. Tullman-Ercek, M.W. Senko, P.D. Compton, and N.L. Kelleher, Nat. Methods 17, 391−394 (2020). DOI: 10.1038/s41592-020-0764-5
(24) T. P. Wörner, J. Snijder, A. Bennett, M. Agbandje-McKenna, A.A. Makarov, A.J.R. Heck, Nat. Methods 17, 395−398 (2020). DOI: 10.1038/s41592-020-0770-7
Martin F. Jarrold is with the Chemistry Department of Indiana University, in Bloomington, Indiana. Direct correspondence to: mfj@indiana.edu

New Method Explored for the Detection of CECs in Crops Irrigated with Contaminated Water
April 30th 2025This new study presents a validated QuEChERS–LC-MS/MS method for detecting eight persistent, mobile, and toxic substances in escarole, tomatoes, and tomato leaves irrigated with contaminated water.

.png&w=3840&q=75)

.png&w=3840&q=75)


.png&w=3840&q=75)


.png&w=3840&q=75)


