But Why Doesn’t It Get Better? Kinetic Plots for Liquid Chromatography, Part 2: Making and Interpreting the Plots
Choosing a liquid chromatography (LC) column for a particular application can be a surprisingly challenging task. On the one hand, column manufacturers provide us many options to choose from, including particle types, pore sizes, particle sizes, and different lengths and diameters. On the other hand, we usually do not have time to experimentally evaluate many combinations of these parameters, and sometimes we end up picking something similar to the columns that are already available. The “kinetic plot” is a powerful graphical tool that can help leverage the best available theory to help us understand how different combinations of parameters (that is, particle size, length, among others) will perform in regard to the time needed to get to a particular column efficiency (and thus resolution), and therefore make well-informed decisions when choosing columns.
In last month’s installment of “LC Troubleshooting,” we discussed the basic idea of a “kinetic plot” and how we can ultimately use this graphical tool to make informed decisions when choosing columns, and understand why a column might not be delivering expected performance improvements. The fixed-length kinetic curve is a transformation of the same information in a conventional van Deemter curve with the added benefit that the kinetic plot can also easily take into account pressure limits of a liquid chromatography (LC) system (1). This month, we continue this discussion by first considering different ways of constructing fixed-length kinetic curves, either from experimental data or from data obtained from other sources, and then going on to show how kinetic performance limit (KPL) curves can be obtained by extrapolation starting from a single set of H vs. u data (that is, a van Deemter curve). Finally, we discuss the effect of particle size on the KPL curves, and show how different particle sizes are optimal for different ranges of analysis time and plate numbers.
Construction of Fixed-Length Kinetic Curves
Figure 1 shows the relationship between the conventional van Deemter curve representation and the dependence of the plate height on the mobile phase velocity. This relationship was discussed in detail in Part I of this series, but it is repeated here because it plays a central role in the continuing discussion. Here, N is the column efficiency (plate number), L is the column length, H is the plate height, t0 is the column dead time, and u0 is the mobile phase velocity. It is critically important to understand that all the data in the figure corresponds to a column with a fixed length, and that moving along each of the curves corresponds to a change in the flow rate, and thus, a change in the pressure drop across the column.
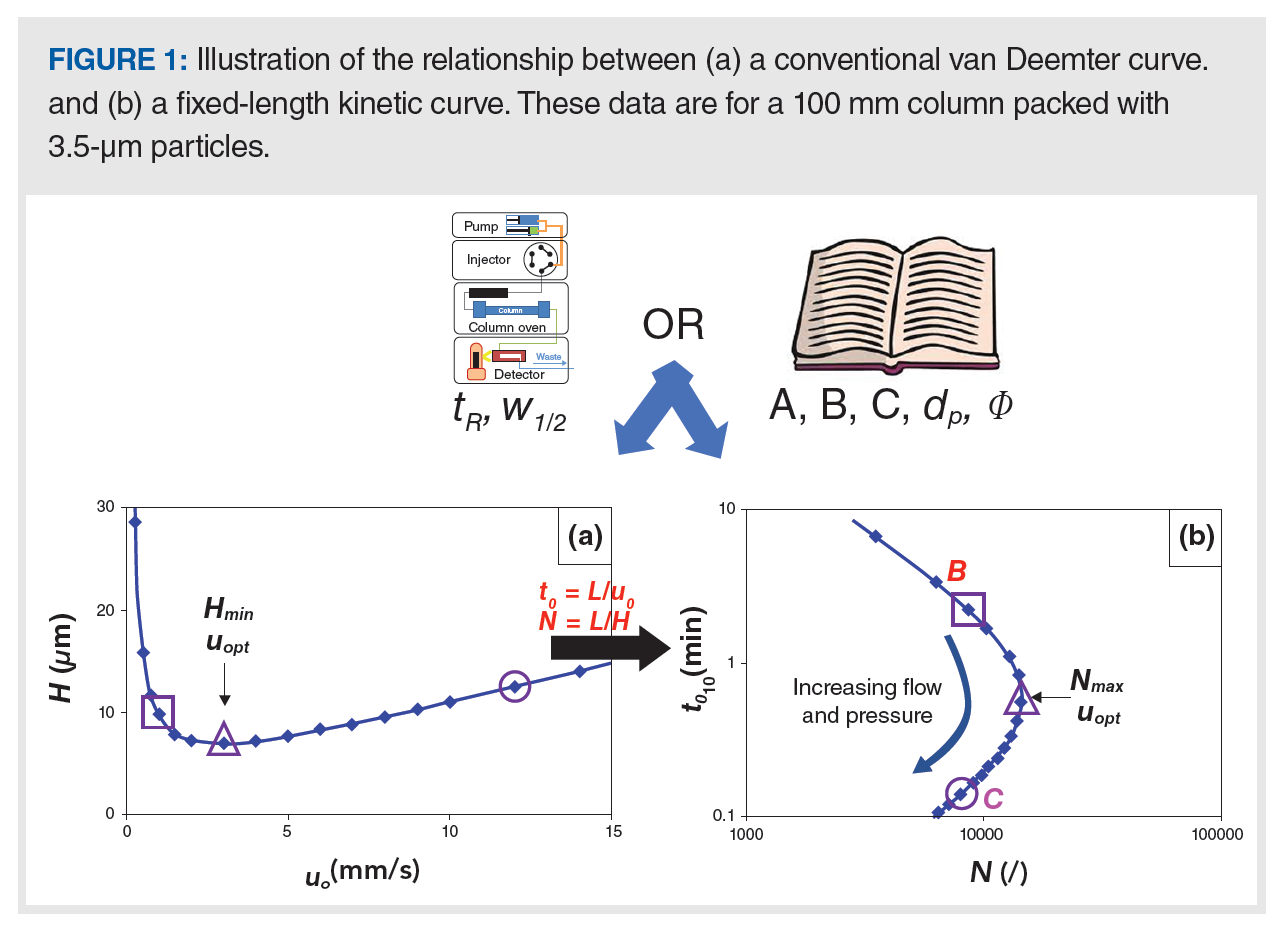
There are multiple methods to obtain the fixed-length kinetic curve in Figure 1b:
1. N and t0 can be obtained directly from experiments with a single column where the flow rate is varied.
2. If one has the H and u0 values from a van Deemter curve, they can be used to calculate N and t0 (N = L/H; t0 = L/u0).
3. N and t0 or H and u0 can be calculated using parameters reported in the literature that have been extracted from experimental data measured elsewhere.
The first two methods are conceptually straightforward and don’t require further explanation here. Making the experimental measurements in a way that yields high quality data does require attention to some details. Readers interested in this topic are referred to the tutorial by Andrés and others (2).
The third method can be approached by starting from a reduced van Deemter curve, which is the dimensionless form of the relationship between plate height (H) and velocity mobile phase (u0). In this case, the plate height, H, is normalized by the particle size dp to give the dimensionless “reduced plate height”:

Similarly, the velocity is converted to a “reduced velocity” (ν0) using equation 2, where Dmol is the diffusion coefficient of the analyte in the mobile phase:

The reduced velocity is also called the “Peclet number” in chemical engineering. The advantage of relating the plate height to the mobile phase velocity in this reduced format is that it enables the prediction of the effect of particle size and diffusion coefficient on plate height, and thus plate number. The reduced form of the van Deemter equation is then written as:

The typical values for the A, B, and C parameters are 1, 3, and 0.1 for fully porous particles and 0.8, 3, and 0.06 for superficially porous particles (SPPs). Typical values for the diffusion coefficient of small molecules under LC conditions are approximately 5×10⁻¹⁰ m2/s, and the relevant range of ν0 is between 1 and 50. If we first calculate ν0 using the A, B, C, and Dmol parameters, and then calculate h using equation 3 and H using equation 1, the fixed length kinetic curves can obtained in the same way as method 2 after a column length is chosen.
Extrapolation from a Fixed-Length Kinetic Curve to the KPL
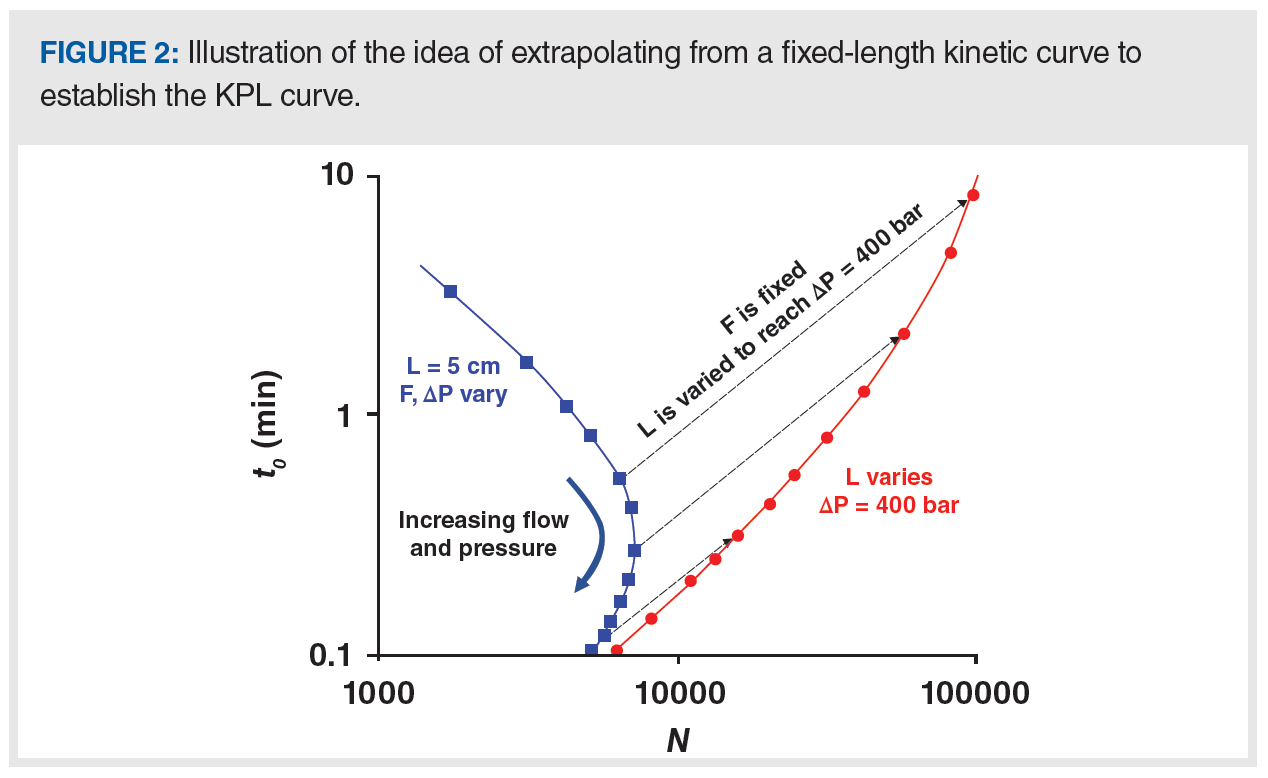
As we discussed in Part I of this series, one of the practical limitations of the conventional van Deemter curve is that it does not explicitly account for pressure limitations of a given column or LC system. In principle, one could address this limitation by making plate number measurements with columns of different lengths at different flow rates, and then plot a series of van Deemter curves or fixed-length kinetic curves, as shown in Figure 3 of the previous installment. However, this process is tedious and expensive (in both time and money). Instead, similar results can be obtained by extrapolation of the N and t0 data obtained for a single column length. The principle that underlies this extrapolation is that the plate height, which is a length independent measure of the column performance, will remain constant if one operates at the same flow rate (or velocity) but uses a column with a different length. For example, if an experiment at a flow rate of 1 mL/min on a column yields 10,000 plates in a t0 time of 1 min, then operating a column twice as long at the same flow rate will yield 20,000 plates, but at the cost of an increase in analysis time by a factor of two (that is, t0 = 2 min). The extent to which one can increase the column length at a fixed flow rate depends on the pressure drop—that is, one can only increase the length until the maximum pressure limit of the system, column, or the user’s preferred maximum operating pressure is reached. Of course, there will be some errors made in making these extrapolations (for example, secondary effects on the observed plate number from extra-column dispersion, viscous heating, pressure effects on mobile phase density, viscosity and retention cannot be accounted for this way); however, the extrapolation results are generally accurate enough to support method development and troubleshooting (3). Readers interested in more detail on this topic are referred to the supplementary material of (4) and the experimental work described in (5).
Figure 2 illustrates the concept of extrapolation from a single fixed-length curve to establish the KPL curve for a given particle size. Each dashed black line connects a point on the fixed-length curve (blue) to a point on the KPL curve (red), where the two points correspond to the same mobile phase velocity (and flow rate). Starting from the blue curve, the column length is increased until the pressure drop across the column reaches a prescribed limit (400 bar in this case). Repeating this process for each point on the blue curve results in the complete red curve, where each point corresponds to a different column length, but the same pressure maximum (ΔPmax) of 400 bar. This process is where the idea of “Kinetic Performance Limit” comes from—it is the limit in the sense that more efficiency cannot be obtained by making the column longer because doing so would exceed the pressure limit (4).
Calculation of the KPL
To calculate the KPL curve starting from the fixed-length curve, an equation is needed that relates the column pressure drop to the mobile phase velocity, its viscosity, ƞ, and the column length. This is given by:

This equation is straightforward as it easy to understand that the column pressure drop increases with column length, velocity (or flow rate) and the mobile phase viscosity. The parameter, Kv0, is called the column permeability (the subscript 0 indicates it is based on the u0 velocity) and is a measure for how “easily” the mobile phase can flow through the column. Its value is proportional to the square of the particle size (Kv0 = d2p/Φ0); smaller particles yield lower column permeability and thus higher pressure drops. The factor Φ0 is the column flow resistance parameter; typical values are around 800 for fully porous particles, and 650 for superficially porous ones. When the column pressure drop is plotted as a function of u0, typically a straight line is found with a slope equal to L·ƞ/Kv0.
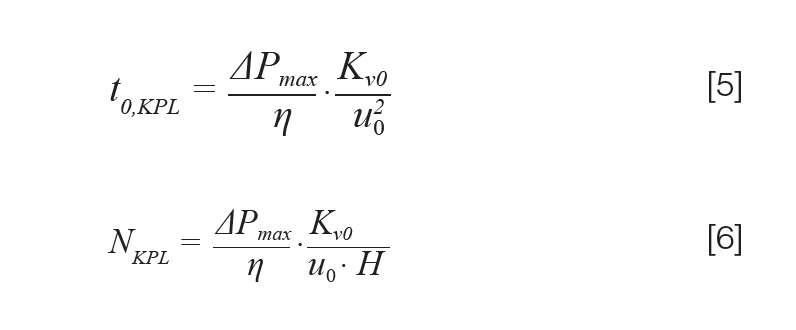
Two different approaches can then be used to calculate the KPL. The first one is based on the plate height data, and it involves direct conversion of the u0 and H values (either measured or calculated; see methods 2 and 3 in the first section) to t0 and N values that lie on the KPL curve (that is, t0,KPL and NKPL) (6). Equations 5 and 6 are used for these calculations:
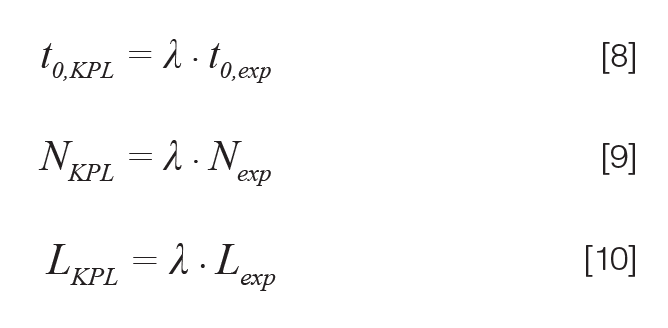
The second approach starts from the experimentally designed t0,exp and Nexp that were obtained using a column with length L, and the experimentally determined column pressure drop ΔPcol. In this case, a column length extrapolation factor, λ, is calculated for each flow rate using equation 7:

This λ factor is the physical representation of the extrapolation shown in Figure 2 because it is a measure of how much longer the column can be made relative to the experimental column length Lexp used to make the fixed-length curve. Therefore, it also represents how much the plate number and analysis time will increase on the KPL, yielding the following simple expressions to determine the KPL curve:
Practical Significance of the KPL
Once the red KPL curve has been constructed by extrapolation from the dark blue curve shown in Figure 3, it is useful to think about the significance of the points on the KPL line. Starting from the right-most point on the dark blue fixed-length curve (which corresponds to the van Deemter optimum velocity), if we fix the flow rate and extrapolate this, it takes us along the light blue line, ending in the light blue circle on the KPL curve. Here, we see that the column length is now 40 cm and a remarkable plate number of 56,700 can be obtained, which is 8-fold higher than the plate number of 7180 achievable at the same flow rate but with the much shorter column length of 5 cm. The pressure drop when operating the 5 cm column this way is just 51 bar, significantly under-utilizing the available pressure of the instrument. In other words, moving from the dark blue to the light blue circle represents capitalizing on the available instrument capability.
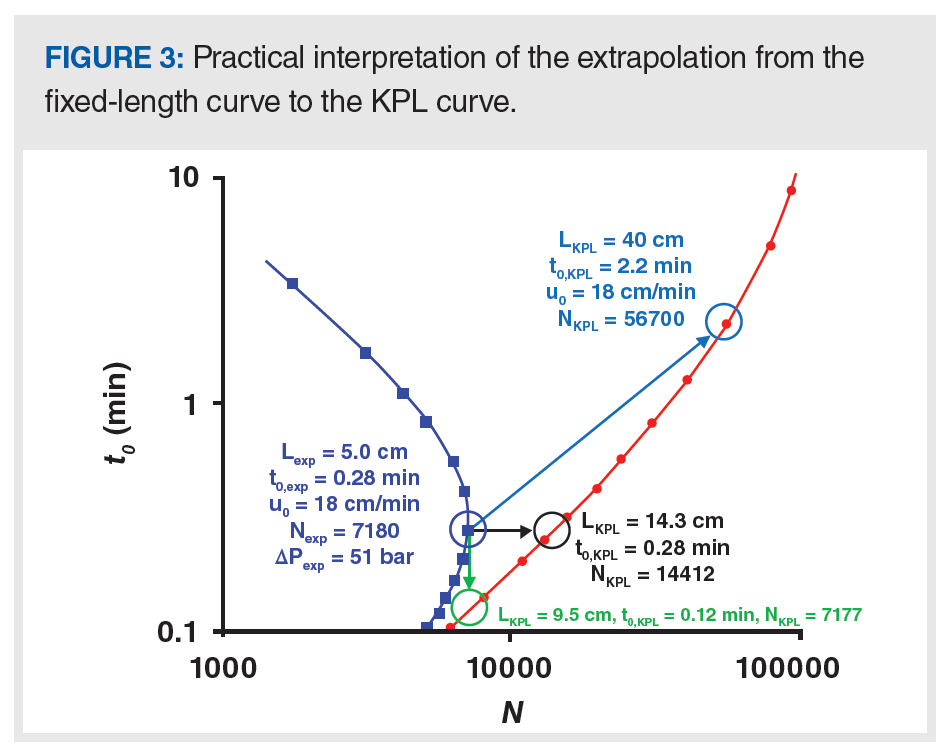
On the other hand, if the plate number of 7200 at the optimum in the fixed-length curve (dark blue circle) is already sufficient for the resolution needed, then this result can be obtained much faster by following the green arrow down to the green circle on the KPL curve. Here, we see that the same plate number is obtained, but with an analysis time savings of about 57% (t0 of 0.12 compared to 0.28 min). In this case, both the flow rate and column length are increased on the way to reaching the KPL curve. The flow rate is increased to reduce the analysis time, but the column length must also be increased to compensate for the increase in plate height on the high-velocity side of the van Deemter optimum so that the plate number stays constant.
Finally, if the analysis time is tolerable at the optimum in the fixed-length curve (dark blue circle; t0 = 0.28 min.), then a much higher plate number can be obtained in the same time by following the black arrow to the right until the KPL curve is reached at the black circle. In this case, both the flow rate and column length are increased again. The flow rate must be increased so that the same analysis time can be maintained even when the column length is increased. Ultimately, by fully using the available pressure capability of the instrument, the plate number can be doubled from 7200 to 14,400 without any increase in analysis time.
Effect of Particle Size on KPL Curves
Besides finding the optimal kinetic performance conditions at which one can operate a particular stationary phase support (for example, a given particle size), as shown in Figure 3, the kinetic plot methodology also enables comparison of different stationary phase supports. Figure 4 shows a comparison of KPL curves for three different particle sizes (same analyte and mobile phase composition in each case) calculated using method 3 discussed above for a pressure limit of 400 bar. We see that the smallest particles (1.7 μm) show the best kinetic performance for short analysis times (lower part of the plot) and low efficiencies (left part of the plot), whereas the larger particles (5 μm) are the better choice for high efficiencies at long analysis times, and the 3.5 μm particles mostly fill up the gap in between. The reason for this behavior is that columns with small particles can be operated at high velocities (flow rates) without much loss in performance (that is, the shallow C-term slope in the van Deemter curve means that plate height does not increase much as the velocity is increased). However, it comes at the cost of higher pressure drops (since ΔP ∞ u0, and ΔP ∞ 1/dp2).
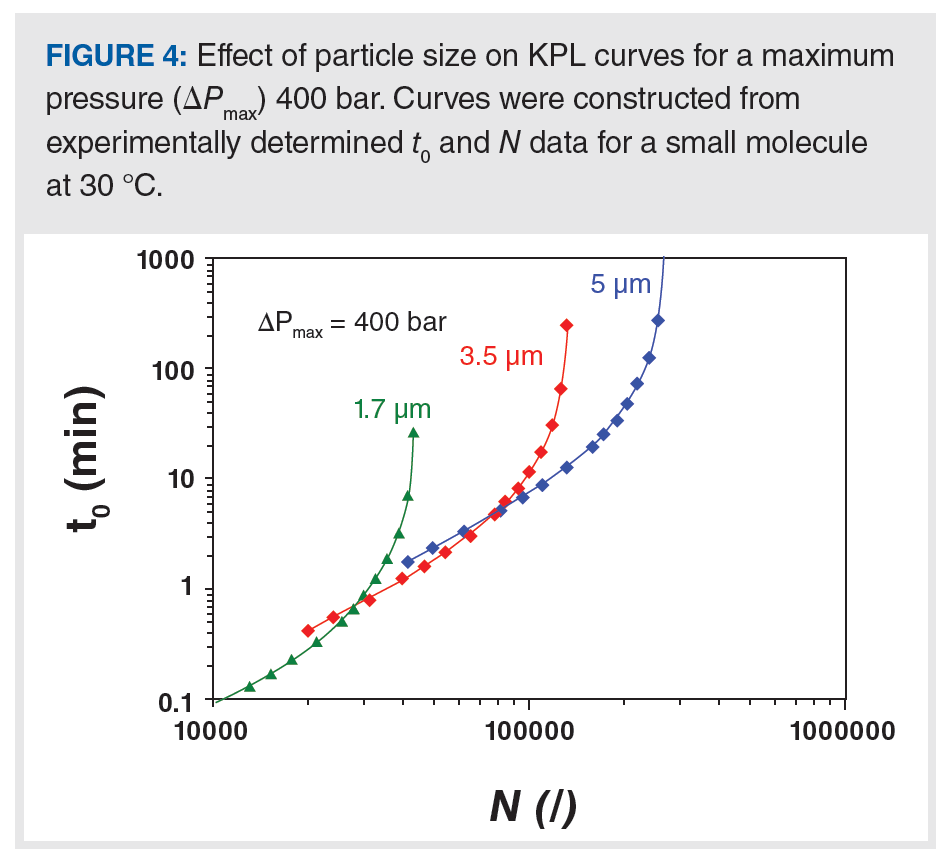
As a result, only relatively short columns can be operated within the pressure limit, resulting in low efficiencies but only requiring short analysis times. This process results in the 1.7 μm particle curve occupying the bottom left region of the kinetic plot. On the other hand, when using large particles, long columns (that is, longer than 15 cm, so coupled columns are required) can be operated at reasonable velocities, which enables very high plate numbers (>100,000 plates) at the cost of much longer analysis times. It is interesting to note that each of the KPL curves approach a vertical asymptote. The practical significance of this occurrence is that the asymptote represents a plate number limit that cannot be exceeded for that particle size, even if the column length is increased.
Summary
In this installment of “LC Troubleshooting,” we have continued the discussion of kinetic plots, including how to construct them from either experimental data or data from other sources, the conceptual meaning of the KPL, and the effect of particle size on KPL curves. In the next installment in this series, we will draw all of these concepts together and discuss how kinetic plots can be used for practical column selection and troubleshooting situations where column performance is not consistent with our expectations and will include our introduction of a web-based calculator application that leverages the theory summarized here.
References
- K. Broeckhoven and D.R. Stoll, LCGC Europe 35(2), 52–56 (2022).
- A. Andrés, K. Broeckhoven, and G. Desmet, Anal. Chimica Acta. 894, 20–34 (2015). https://doi.org/10.1016/j.aca.2015.08.030.
- K. Broeckhoven and G. Desmet, J. Sep. Sci. 44, 323–339 (2021). https://doi.org/10.1002/jssc.202000779.
- K. Broeckhoven, D. Cabooter, F. Lynen, P. Sandra, and G. Desmet, J. Chromatogr. A 1217, 2787–2795 (2010). https://doi.org/10.1016/j.chroma.2010.02.023.
- D. Cabooter, F. Lestremau, A. de Villiers, K. Broeckhoven, F. Lynen, P. Sandra, and G. Desmet, J. Chromatogr. A. 1216, 3895–3903 (2009). https://doi.org/10.1016/j.chroma.2009.02.079.
- G. Desmet, D. Clicq, and P. Gzil, Anal. Chem. 77, 4058–4070 (2005). https://doi.org/10.1021/ac050160z.
About The Author
Ken Broeckhoven received his Ph.D. in 2010 from the Vrije Universiteit Brussel (VUB), in Brussels, Belgium. Following postdoctoral research at VUB and work as a visiting researcher in the separation processes laboratory at ETH Zurich, he became a research professor at VUB in 2012. He was subsequently promoted to Assistant Professor and then to his current position as Associate Professor in 2017.
About The Column Editor
Dwight R. Stoll is the editor of “LC Troubleshooting”. Stoll is a professor and the co-chair of chemistry at Gustavus Adolphus College in St. Peter, Minnesota, USA. He is also a member of LCGC’s editorial advisory board. Direct correspondence to: amatheson@mjhlifesciences.com

Accelerating Monoclonal Antibody Quality Control: The Role of LC–MS in Upstream Bioprocessing
This study highlights the promising potential of LC–MS as a powerful tool for mAb quality control within the context of upstream processing.
Using GC-MS to Measure Improvement Efforts to TNT-Contaminated Soil
April 29th 2025Researchers developing a plant microbial consortium that can repair in-situ high concentration TNT (1434 mg/kg) contaminated soil, as well as overcome the limitations of previous studies that only focused on simulated pollution, used untargeted metabolone gas chromatography-mass spectrometry (GC-MS) to measure their success.
Prioritizing Non-Target Screening in LC–HRMS Environmental Sample Analysis
April 28th 2025When analyzing samples using liquid chromatography–high-resolution mass spectrometry, there are various ways the processes can be improved. Researchers created new methods for prioritizing these strategies.
Potential Obstacles in Chromatographic Analyses Distinguishing Marijuana from Hemp
April 28th 2025LCGC International's April series for National Cannabis Awareness Month concludes with a discussion with Walter B. Wilson from the National Institute of Standard and Technology’s (NIST’s) Chemical Sciences Division regarding recent research his team conducted investigating chromatographic interferences that can potentially inflate the levels of Δ9-THC in Cannabis sativa plant samples, and possible solutions to avoid this problem.

.png&w=3840&q=75)

.png&w=3840&q=75)


.png&w=3840&q=75)


.png&w=3840&q=75)


