BioFuels and Mass Spectrometry
LCGC Europe
"...We will restore science to its rightful place, and wield technology's wonders to raise healthcare's quality and lower its cost. We will harness the sun and the winds and the soil to fuel our cars and run our factories...." - President Barack Obama, 44th President of the US, Inaugural address, 20 January 2009, Washington, DC.
In the 1950s, petroleum-related gas chromatography mass spectrometry (GC–MS) applications were one of the founding cornerstones of modern mass spectrometry. Even now, "petroleomics" — not to be outdone by life science research — serves as an example of the cutting-edge in liquid chromatography mass spectrometry (LC–MS).1 In petroleomics, several MS ionization techniques can differentiate between chemical species that differ by less than the mass of a single electron. Such astonishing sensitivity has come about as the magnetic-sector mass spectrometers of previous decades have yielded their place to modern, time-of-flight (TOF) mass spectrometers, improving the utility and flexibility of analyses with high mass accuracy and resolution.
The Time has Arrived
War in the Middle East and Asia exacerbates fuel and heating oil shortages in the US, heralding the end of an era of inexpensive oil. The stock market (with the exception of oil stocks) stumbles badly and following the president's authorization of controls on oil prices, production and allocation, the secretary of state announces a national plan to make the country "energy independent". You could be forgiven for assuming that, except for the last two items, I'm recounting news of 2008. Yet the US president was Richard Nixon and it was during his tenure in the early 1970s that oil prices went from slightly more than $3 a barrel to nearly $12. Later in that decade, the country faced a resurgence of energy-related issues. As the decades passed the country's national energy policy is still a work-in-progress.

Figure 1
Because it requires little cultural adaptation on the part of us humans, blending novel power-generating technologies with non-renewable energy sources would seem more promising of success. But even here, besides the considerable technological hurdles involved in developing alternative energy supplies, those who promote change encounter cultural resistance. Among the non-technology issues that plague us are lawsuits brought by abutters who find wind machines problematic for aesthetic and other reasons, interest groups for whose members abandoning the status quo would cost money, the relatively high cost of the new technologies and geographical restrictions on wind, thermal, or solar generation of electricity on any useful scale. Wave farms for instance, planned for the coast of the state of Rhode Island (Oceanlinx, Australia), would consist of 10–14 floating cable-tethered units each unit 90 feet long, 60 feet wide reaching a height of 30 feet above sea level.
In December 2008, 120 windmills — the largest of Europe's onshore facilities — went on-line in Portugal. The total output is 650 GW hours per year, or 1% of the country's total energy needs — enough to provide power to about 300000 homes.2 A relatively poor country by Western European standards, Portugal is already recognized for its unique, commercial wave-power plant, though the plant has been, so far, slow in meeting expectations.3
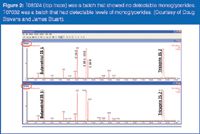
Figure 2
To date, the world's largest onshore wind farm, the Horse Hollow Wind Energy Center, is located in the US, in Texas, and it provides more than 700 MW.4 Portugal is less than one-fifth the size of Texas and its population, less than half that of Texas (10.6 million versus 23.5 million), is far more dense. Its goal of achieving more than 30% of its power generated by new technologies by 2020 is commendable (according to The Guardian, that figure is more than twice the amount planned for the UK). Nevertheless, the cost of new projects is substantial and it looms as a frequent issue in technology development discussions. In this instance, the Portuguese government supplies subsidies up to 40% of costs.
Whether for improved batteries, for greater deployment of electricity, or other alternative possibility for decreasing our global consumption of fossil fuels, the challenges of these technologies are interdependent, and must be addressed together.
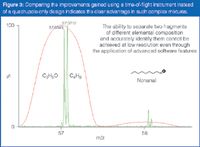
Figure 3
The Promise of Bioenergy
The terminology we use to describe a new technology is often imprecise, and it tends to be as changeable as the novel technology is malleable. One area of endeavor that looks particularly promising in the renewable bioenergy field involves biofuels made from plants. Converting soluble plant sugars into liquid fuels involves deoxygenation: removing oxygen atoms from the raw cellulosic material. Subsequent refining steps create the branched hydrocarbons on aromatic compounds used for gasoline or as longer chains for diesel fuel.
Europe currently leads in biodiesel production where the US has focused on developing ethanol. By some estimates, biodiesel production is expected to reach 12 billion litres by 2010, while worldwide consumption of petroleum products escalates 35% by 2025.5
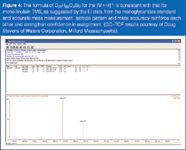
Figure 4
Ethanol developed from corn helped to institute an E85 gasoline initiative in the US. Nevertheless, corn-based ethanol is now giving way to cellulose-based ethanol. Vehicles today can run on 10% ethanol mixed with gasoline. But as of 2006, only six million vehicles registered in the US could run on 85% ethanol — that out of 250851833 passenger cars, according to US Department of Transportation's Bureau of Transportation Statistics.6
Steven Chu, secretary of the Department of Energy, has championed the use of biodiesel, which has initiated an upsurge in the prospects for biofuels, according to reports in BioFuels Digest.7
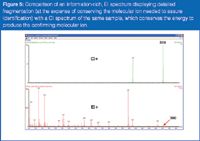
Figure 5
Because of the cost volatility of corn, which is the primary source of ethanol in the US, the commodity is no longer looked upon favourably as a precursor of biodiesel. Loss from recent storms and increased demand for ethanol production, as well as inequities in foreign exchange rates, fuel this volatility, as prices favour exporting feed. Chu, the head of the Lawrence Berkley National Laboratory and a Nobel laureate in physics, is on record as arguing against the food-crop based ethanol approach.8 A 2007 report commissioned by the governments of China and Brazil called for intensive research into cellulose-based production, which relies on technology such as isolating microbes or using large amounts of heat and steam to break down the tough bits into fuel.9
How Widespread is the Interest in Cellulose-based Fuels?
A wealth of information about cellulose-based fuels is posted on the newly developed Oak Ridge National Laboratories website.10 Links, reference data, conversion data and a glossary make it a key source of information on the topic.

Figure 6
Seeing the topic discussed in Chemical & Engineering News11–13 on an almost issue-by-issue basis may not surprise us. What is surprising, however, is that automobile enthusiasts are as current with the technology as core researchers, thanks to publications such as Motor Trend, which recently made the economic arguments:
... self-seeding perennials require little or no tilling, minimal nitrogen, and no phosphorous or potassium fertilizer. The initial cost to establish these energy crops is estimated at $100–$250/acre but they live 10 years and yield 12–15 tons/acre, making 65–130 gallons of ethanol per acre depending on the crop and processing method.14
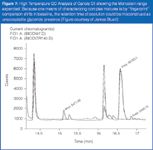
Figure 7
A popular magazine seems an unlikely place to find this level of technological and economic detail. That it does indicates two things. First, the need for the technology is imminent and the effects of that need are felt throughout our population. Second, the processing method mentioned at the end of the quotation indicates we still have work to do.
Besides the DOE-supported consortium, comprised of three laboratories (with Chu's Lawrence Berkley National Laboratory in the lead), some universities have long offered programmes based on the history of petroleum research. Several companies are already well-advanced decoding plant genomes and experimenting with gene expression. One of them, Ceres, of Thousand Oaks, California, USA, currently markets varieties of switchgrass and sorghum. Sold under the name Blade Energy Crops, these bioproducts thrive in various climatic conditions and are designed to meet various biothermal or biochemical processes. The company claims planting energy crops on 40 million acres of idle or marginal farmland can potentially offset half of the US' gasoline needs. It also says that planting those crops builds topsoil and doesn't adversely affect the country's capacity to produce food, all the while netting five times the energy yield of corn-derived ethanol.
The Department of Energy, in conjunction with the Department of Agriculture, postulates that more than 1 billion ton of biomass could be produced exclusively for energy in the US each year, all with only modest changes in terrestrial crop practices. Considering only the biomass conversion technology available today, that quantity of biomass could replace about 30% of the petroleum consumed by the US.
Current Practice and Analytical Necessities
Universities have long taken on basic energy research. Jay Keasling, a chemical engineer at the University of California, Berkley, is widely noted for his work with yeast to produce the necessary end-products for both pharmaceutical discovery and energy development studies. Here again, another article in the popular press highlighted the widespread interest.15 The article notes grants from British Petroleum, among others, underwriting Keasling's work. Keasling is now head of the newly created American Joint BioEnergy Institute and armed with $134 million funding through 2013.
Professor Emeritus James Stuart, head of biodiesel testing at the University of Connecticut, and colleagues have been characterizing biodiesel for many years. A number of different vegetable oils are used to produce biodiesel (referred to as B100) and each feedstock varies by fatty acid concentration and degree of saturation. In testing the stepwise trans-esterification (using methanol/potassium hydroxide) of the oil's triglycerides often results in the formation of mono-glycerides, as incomplete saponification products. The various mono-glycerides elute close to the desired 24-carbon-length methyl esters, making peak identities problematic. Assigning accurate masses to these mid-eluting peaks would allow positive identification of questionable peaks as undesired monoglycerides or desired methyl esters.
In his recent presentation at Eastern Analytical Symposium (19 November 2008) Dan Walsh, a chemical engineer with Bently Tribology Services (Peabody, Massachusetts, USA) reviewed the realities of producing biodiesel. Most of the test methods and standards were designed for petroleum products. But biodiesel behaves differently. It is more sensitive to in-lab environmental factors than petroleum products. Elements of edible oil testing and petroleum testing methods are being refined to address uniqueness of product. For instance, problems that occur in storage and transit arise from no single cause, but rather a synergistic effect produced from these conditions:
- chilling (product B100 has "thermal memory")
- formation of sterol glycosides
- elevated moisture
- near-specification levels of bound glycerin (monoglycerides, diglycerides, triglycerides).
Professor Stuart's experience underscores one of the analytical issues. His GC–FID results, based on published work with vegetable oil methylesters (VOMEs) and fatty acid methyl esters (FAMEs),16,17 disagree with current ASTM D6584 (Test Method for Determination of Free and total Glycerin in B-100 Biodiesel Methyl Esters by Gas Chromatography). The methyl esters of C24, which are supposed to elute in the 0.80–0.82 RRT range (in comparison to a tricaprin standard), elute in the same range as the various known monoglycerides: near 0.83 minutes on two different GC columns commonly used in biodiesel research.
The method is designed to analyse biodiesel samples for impurities that foul, clog and cause deposits in engines using biodiesel as fuel. As a quality control measure, the trimethylsilyl (TMS) derivatized forms of monoglycerides, diglycerides and triglycerides are quantified, ensuring the processing of the raw oils used as feedstock is complete and efficient. The presence of glycerides above a certain level is an indicator of a process failure.
This ASTM method consists of a 30-minute gas chromatographic analysis with a flame ionization detector (FID) and a special, high temperature, capillary GC column. Only 0.100 grams (8-drops) of the B-100 is weighed. Two internal standards are added, and any free-hydroxyl groups and acids in the B-100 are derivatized at room temperature using N-methyl-N-trimethylsilyltrifluoracetamide (MSTFA) in a pyridine solvent. After a 15 min reaction time, the sample is diluted to 10 mL with n-heptane and 1.0 μL injected. The peaks' relative retention times are then compared to those of the two internal standards. For the B-100 sample to conform to ASTM standards, the amount of free glycerin must be less than 0.020%, and the total glycerin must be less than 0.240%, by mass.
Making the correct identification of closely related formulas in complex mixtures is among the greater challenges facing the practitioner. Kind and Fiehn covered the topic in detail in 2008 column.18 Predicting isotopes for given chemical entities is well-characterized and several companies offer software features that compare the theoretical isotope pattern with that of the acquired data, to increase the likelihood of arriving at the correct answer. For instance, Waters' MassLynx iFit algorithm indicates an increasingly better match between the theoretical and measured data with lower iFit ranking numbers. Bruker SmartFormula software ranks possible candidates according to a match factor between the measured isotopic pattern and the theoretical pattern for a given formula or sigma value, which should be close to zero.
Resolving the differences between standards and representative samples using electron ionization (EI) and chemical ionization (CI) with isobutane and a variety of comparative tools, such as NIST libraries, clearly indicates that when faced with an incomplete process or contamination the two dimensional GC–FID data alone is insufficient to indicate the specific source of an interference. Sometimes an acceptable batch result is masked by a deteriorated septum or other casualty of common practice. The resulting reduction of process downtime, along with the prevention of needless batch rejection, means increased productivity and prevents wasteful remedial actions to the process system.
The 3D figure shows another technique, one similar to the use of Krevlin diagram representations for the complex data discussed in Ryan Rodgers' petroleomics work.1
The relatively broad impurity peak, at 15.64 minutes, displays the same elemental composition as monoolein TMS, at 15.94 minutes (the middle peak in the inset). The other two peaks are similar to monoolein but have different degrees of saturation. (Monostearin TMS is shown at 16.20 minutes).
The early eluting peak has one more double bond while the peak eluting later has two more double bonds than monoolein. These peaks elute within 1–2 seconds of each other, but the acquisition rate of 10 spectra/s is sufficient to accurately profile the peaks and reveal the coelutants.
Walsh says in his EAS overview that anyone can make biodiesel, but its quality can vary. Even the ASTM method is a work in progress. Equations 6–8 in the current ASTM method are not consistent with instructions in the overview's section 9.4.1, which calls for the analyst to "prepare a calibration curve for each reference component by plotting the response ratios (rspi), as the y-axis, versus the amount ratios (amti), as the x-axis." Current equations in the method plot the reverse: that is, the amount ratio as the y-axis and response ratio as the x-axis. Once updated, test method D6584 will become consistent with section 9.4.1 and also with other ASTM test methods, such as D4815, D5580, etc. in the plotting designation.
Improvements such as Simulated Distillation (now either ASTM D2887 or ASTM D 7391) use GC data that replaces the classical "Distillation of Petroleum Products Under Reduced Pressure" (ASTM D1160) and the calculated Cetane Index uses some of the same GC data to replace the classical ASTM D976 "Cetane Number of Diesel Fuel Oil." Even so, there are common analytical pitfalls that increased analytical capability helps resolve.
Costs and Prospects for Biofuels
In addition to more traditional GC tools currently being employed, the newly opened BioEnergy Center at Oak Ridge National Laboratories has been equipped with UPLC (ACQUITY system, Waters Corporation, Milford, Massachusetts, USA) with a quadrupole mass spectrometer (Sciex, Life Technologies, Mississauga, Canada), for high throughput quantification and a high-definition QTOF instrument (SYNAPT, Waters Corporation) with ion mobility capability for qualitative development.
Recent work submitted for publication details investigations showing promise for LC using hydrophobic interaction chromatography (HILIC). HILIC, was realized to have utility for nucleotides and carbohydrates and highly polar compounds not well-retained by reverse phase stationary phases such as C18. Investigations of cellulosic samples have been extended to monolithic columns as well.19
Walsh estimates a testing budget of $10000 per 100000 gallons produced is required, which equates to an analysis cost of $0.20 per gallon. The full ASTM D6751 test package cost varies yet it is generally expensive, particularly because cetane is required. So the prospects for reduced specifications would result in a less expensive, more flexible analysis. One way to approach a reduced cost while maintaining high fidelity results might be to extend the utility of the instrument.
One technology to make a recent return is atmospheric gas chromatography — a hybridization of GC with a mass spectrometer designed for LC–ESI. Bruker Daltonik (Bremen, Germany) introduced a combination GC–APCI interface at ASMS 2008 (Denver, Colorado, USA) for the microTOF II model and Waters has commercialized work developed by Charles N. McEwen (E.I du Pont de Nemours & Company, Wilmington, Delaware, USA)20 introduced for the Xevo source design at Pittcon 2009. Attempts to broaden the applicability of an LC–MS-only design by adding GC in years past sacrificed sensitivity associated with GC analysis. Pre-release results shown with the Xevo APGC design not only combines the analytical attributes of a GC-dedicated instrument (though only in CI mode) but does so with the attributes of LC–ESI–MS, that is, using the same software and conventions (polarity switching for instance) but with sensitivity of a dedicated GC–TOF.
"MS — The Practical Art" editor Michael P. Balogh is principal scientist, MS technology development at Waters Corp. (Milford, Massachusetts, USA); a former adjunct professor and visiting scientist at Roger Willimas University (Bristol, Rhode Island, USA); co-founder and current president of the Society for Small Molecule Science (CoSMoS); and a member of LCGC Europe's Editorial Advisory Board.
Direct correspondence about this column to LCGC Europe, Advanstar House, Park West, Sealand Road, Chester CH1 4RN, UK or e-mail: amatheson@advanstar.com
References
1. M.P. Balogh, LCGC N. Am., 26(3), (2008).
2. http://www.guardian.co.uk/environment/2008/dec/02/portugal-wind-power
3. http://www.guardian.co.uk/environment/2007/oct/01/waveandtidalpower.renewableenergy
5. Global Biofuel Market Analysis, RNCOS, (2008).
6. http://www.bts.gov/publications/national_transportation_statistics/html/table_01_11.html
8. http://www.agriculture.purdue.edu/agcomm/news/agresearch/Archive/2008/June/index.htm
9. http://uk.reuters.com/article/environmentNews/idUKTRE4BA72020081211
10. http://www.bioenergycenter.org
11. A. Tullo, Chem. & Eng. News, Nov. 10, (2008).
12. S. Ritter, Chem. & Eng. News, Dec. 8, (2008).
13. S. Ritter, Chem. & Eng. News, Nov. 17, (2008).
14. F. Markus, Motor Trend, Dec. (2008).
15. Newsweek, People to Watch: Jay Keasling, Dec., (2008).
16. C. Plank and E. Lorbeer, J. Chromatogr. A, 697 461–468 (1995).
17. W. Tiyapongpattana, P. Wilairat and P.J. Marriott, J. Sep. Sci., 31, 2640–2649 (2008).
18. T. Kind and O. Fiehn, LCGC N. Am., 26(2), (2008).
19. K. Horie et al.,J. Chromatogr. A 1164, 198-205 (2007).
20. M.P. Balogh, LCGC N. Am., 25(4), (2007).

HPLC 2025 Preview: Fundamentally Speaking (Part 1)
May 13th 2025Michael Lämmerhofer from the Institute of Pharmaceutical Sciences, University of Tübingen, Germany, spoke to JFK Huber Lecture Award winner of 2024 Torgny Fornstedt, professor in analytical chemistry and leader of the Fundamental Separation Science Group, Karlstad University, Sweden, about his pioneering work in high performance liquid chromatography (HPLC) with a focus on fundamentals and industrial applications.
Reversed-Phases for LC Deliberately Doped with Positive Charge: Tips and Tricks for Effective Use
May 13th 2025In this month's edition of LC Troubleshooting, Dwight Stoll and his fellow researchers discuss both the benefits (improved peak shape/loading) and challenges (excessive interaction) associated with charge-doped reversed-phase (RP) columns for both analytical and preparative separations.
Determining Ways to Protect Honeybee Colonies with GC–MS
May 13th 2025A study conducted by the Agriculture Research Centre of Giza, Egypt, and Jilin Agricultural University in China, evaluated the efficacy of stinging nettle extract, nettle smoke, and formic acid in the controlling of Varroa mites, a major threat to honeybee colonies, with a focus on mite infestation reduction, honeybee mortality, and biochemical responses. Gas chromatography–mass spectrometry (GC–MS) was used to identify key bioactive compounds in the stinging nettle extract.

.png&w=3840&q=75)

.png&w=3840&q=75)


.png&w=3840&q=75)


.png&w=3840&q=75)


