Analytical Technologies for Genotoxic Impurities in Pharmaceutical Compounds
LCGC North America
Genotoxic impurities (GTIs) have gained considerable attention from health authorities as well as from the pharmaceutical industry in recent years. Analysis and control of these impurities in pharmaceutical compounds pose a significant challenge, often requiring selective, sensitive, and robust trace-level methods for analysis. This article focuses on the method development strategy and associated technologies for the analysis of GTIs. GTIs typically have a wide range of physicochemical properties such as volatility, stability, presence of UV chromophores, ionizable groups, and derivatizable functional groups. Various separation and detection technologies are available and can be used to identify and analyze. Choosing the appropriate analytical technique depends on the GTI physicochemical properties, required sensitivity, and the consideration of the matrix interference.
Genotoxic impurities (GTIs) belong to a class of compounds that interact with DNA and induce genetic mutations. These compounds add significant risk without adding any benefit to patients and are also known as mutagenic impurities. Therefore, exposure to even low levels of such impurities may be of significant toxicological concern.
Genotoxic assessment is required throughout synthetic route development and stability duration for the presence of any GTI alerts. Demonstrating that GTIs are controlled to safe levels is of the utmost importance for patient safety (1). In recent years GTIs in pharmaceuticals have become a topic of increasing concern, consequently several review papers have been published focusing on the regulatory and toxicology assessment (2–7), control strategy (7–9), and risk assessment (10). Effective analytical technologies for selective, sensitive, and robust trace-level detection methods are required for low-level quantitation. Physicochemical properties of the GTIs that need to be considered include volatility, stability, presence of UV chromophore, ionizable groups, and derivatizable functional groups.
Regulatory Overview
GTIs are required to be controlled at lower limits (11,12) compared to less toxic impurities controlled in new drug substances (13,14) and drug products (15). The concept of staged threshold of toxicology concern (TTC) was developed to allow higher limits for compounds in development based on the duration of exposure rather than lifetime exposure (16).
The International Conference on Harmonization's (ICH) M7 document "Assessment and Control of DNA Reactive (Mutagenic) Impurities in Pharmaceuticals to limit Potential Carcinogenic Risk" provides recommendations for toxicology assessment, identification, categorization, and control of actual and potential mutagenic impurities that are likely to arise during the manufacturing and long-term storage of a new drug substance and drug product (17).
Compound-specific calculations for acceptable intakes may be applied where sufficient carcinogenicity data are available or if the impurity is similar to a known carcinogen compound class. Performing spiking and purge studies during the development stage and justifying the presence at higher limits for the impurities may not only mitigate routine analysis at trace levels, but also may mitigate the need to specify control levels in drug substance specifications.
ICH S9 document guidance supports the concept that higher limits may be appropriate for a drug candidate or commercial product targeted for advanced cancer with life-threatening malignancies (18).
Structures of Commonly Encountered GTIs
Structures of some of the impurities commonly observed in pharmaceutical synthetic routes that get structural alerts are shown in Figure 1. These functional groups are generally linked to genotoxicity and are identified based on the chemistry and structure–activity relationship (16). Boronic acids were recently recognized as mutagens, but do not have enough carcinogenicity data. Galloway and colleagues (19) compared the data for 361 various chemicals used in the synthetic route that had structural alerts and were tested for Ames. They reported that 80% of aromatic nitro and boronic acid derivatives had positive Ames results, which was the highest among the selected samples, and 50–60% of alkylating agents, acid chloride derivatives and hydrazines, were positive.
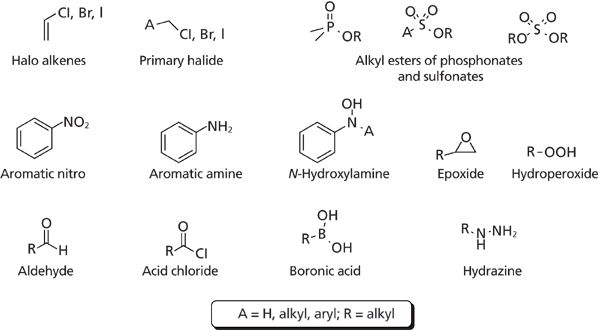
Figure 1: Structures of commonly observed GTIs.
Analytical Method Development Strategy for GTI Analysis
GTIs were controlled at a TTC of 1.5 μg/day at commercial stage. For a 1-g daily dose of the marketed product, a GTI would require control at a level of 1.5 ppm ([1.5 μg/day]/[1 g/day] = 1.5 ppm), which is several hundred times lower than the 0.05% (500 ppm) control level per the ICH Q3 guidance for traditional pharmaceutical impurities analysis. Further, in case of the presence of three or more mutagenic impurities in the drug substance specification, total mutagenic impurities should be limited to 5 μg/day for clinical development and marketed products. Considering such a low level, robust and sensitive analytical methods are a critical element of the control and analysis of GTIs. Before developing a method, it is important to understand a few factors:
- the purpose of testing - whether the method will be implemented for API release testing or used during development (spiking and purge studies);
- the need for a limit test or quantitative method - the requirements for method validation vary;
- the physicochemical properties of the analyte;
- and the end user of the method - it can be a development laboratory, a commercial user, or a manufacturing laboratory.
With frequent changes in dose and duration during the clinical trial stage, it is often necessary to collect quantitative data at the development stage. Quantitative data collection requires a method with lower detection limits than the analytical specifications limit. After the process understanding is gained and lower levels are attained for each impurity compared to the control level, a limit test can be used rather than a quantitative test. Based on physicochemical properties of the analyte, gas chromatography (GC) or high performance liquid chromatography (HPLC), two of the most commonly used analytical techniques, may be used (Figure 2).
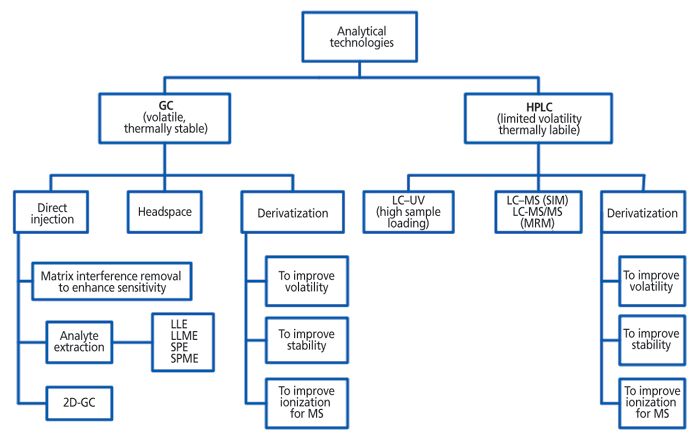
Figure 2: Analytical method development strategy.
Analysis of Genotoxic Impurities by GC
GC is a preferred separation technique for the analysis of volatile analytes. Direct liquid injection and headspace are two commonly used injection modes for GC analysis. The specification limit calculated based on the daily dose is a key factor in determining the desired sensitivity of the method and subsequently the selection of the detector.
GTI Analysis Using Direct Injection
GC analysis using direct liquid injection is the primary choice for analysis of volatile and thermally stable analytes such as alkyl mesylates that lack the sufficient vapor pressure required for the headspace technique (20). The dissolve-and-inject approach significantly simplifies the sample preparation before analysis. Flame-ionization detection (FID) is preferred because of its easy availability and versatility. FID may be used for higher control levels that are justified by low dosage drugs; however, sensitivity is somewhat limited (21). The high sample loading technique may be applied to obtain the desired sensitivity (17).
A hyphenated GC–mass spectrometry (MS) technique in selected ion monitoring (SIM) mode provides better sensitivity and selectivity for impurities analysis at sub-part-per-million levels. The most prominent fragment ion is selected to obtain the desired sensitivity and resolution. The GC–MS method using SIM and repetitive scanning has been reported for the analysis of mesylates (20) and various alkyl halides (22). However, this method has a restriction of 1 μL for injection volume because of the accumulation of active pharmaceutical ingredients (APIs) and resulting matrix interferences, which additionally require frequent changing of the inlet. Inlet contamination and resulting matrix interference are the primary limitations of the direct injection analysis method. Most drug substances are nonvolatile, and solutions might need to be prepared at higher concentrations to achieve sensitivity. This contamination may result in irreproducibility and low recovery problems during method validation and testing.
Enhancing Sensitivity by Removing Matrix Interference
The presence of excessive matrix interference may have a significantly adverse impact on method sensitivity. Using headspace GC for the analytes with sufficient vapor pressure may be a quick solution because most APIs are not volatile. However, for complex samples, the introduction of nonvolatile and reactive materials in the GC inlet may be mitigated by matrix deactivation, analyte extraction, or two dimensional (2D)-GC. These techniques may also be used to increase analyte stability, for selective extraction, and for enrichment of analytes. Table I summarizes the various technologies used for the removal of matrix interference and hence increasing the sensitivity.

Analyte Extraction
Extraction methods such as liquid–liquid extraction (LLE), liquid-phase microextraction (LPME), solid-phase extraction (SPE), and solid-phase microextraction (SPME) help enhance the analyte concentration and sensitivity, thereby reducing matrix interference, especially where the GTI and matrix have diverse chemical properties. Small neutral molecules, such as alkylating agents, have high solubility in organic solvents and may be extracted out from ionizable API matrix, which will have better solubility in water in an ionized form (14). The solvent n-hexane is the best solvent for liquid extraction since only sparse amounts of API or potential impurities are extracted from the matrix. n-Hexane does not impact the sensitivity or selectivity by ion depression being a nonpolar solvent (27). However, this procedure is laborious and may be prone to interferences because of tough-to-break emulsions, the use of organic solvents, and concentration steps. Additionally, an internal standard needs to be used to compensate for any loss of analyte during the extraction procedure. LPME offers the advantage of much improved concentration power as only microvolumes are used for extraction. SPME is a solvent-free extraction technique that involves the use of a coated fiber to extract various analytes that can be in liquid (direct injection) or gas (headspace) phase (25). The working pH range for the currently available fibers is pH 4–9. That being said, the adjustment of pH is a critical factor for the ionization and extraction of potential interferences. Polymeric ionic liquids (PILs) with variable chemical properties have also been evaluated as selective SPME sorbent coatings for the analysis of alkyl halides and aromatics. This allows quantitation of GTIs in ultratrace level (29). The ability to modify their chemical structures to achieve different analyte solvation capabilities is an advantage. However, this approach is still in an early stage and further studies are underway to understand the effect of various PILs.
2D-GC
Compounds such as epoxides and Michael reaction acceptors do not have sufficient volatility for headspace. 2D-GC with a Dean switching valve may be used to divert the matrix to waste and the fraction containing desired GTIs to the detector. Using this approach, the API, solvent, and derivatization agents are not introduced on the second column and MS detector. Enhanced sensitivity is observed mainly because of the removal of background interference. Moreover, this technique also results in the complete separation of two analytes present in the same sample (28).
GTI Analysis Using Headspace GC
Headspace analysis minimizes the potential contamination of the injector, column, and detector. In headspace analysis, nonvolatile APIs do not partition into the headspace and thus do not get injected and enter the GC system (23). High boiling solvents such as dimethyl sulfoxide, N,N-dimethylacetamide, or N,N-dimethylformamide are commonly used for such analysis. Recently, the use of ionic liquids has also been reported for the analysis of high boiling analytes (30,31). Ionic liquids offer an advantage because they provide high thermal stability and low volatility without causing significant background noise at elevated headspace oven temperatures. This technique may be used for analytes that have sufficient vapor pressure to be injected using headspace GC and that have demonstrated stability at high temperatures.
GTI Analysis Using Derivatization Followed by GC
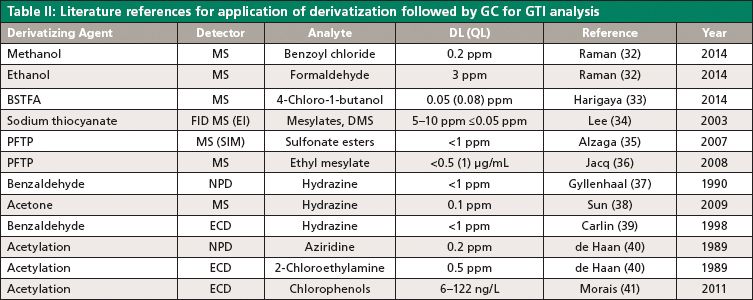
Sample derivatization is an efficient way to alter the physicochemical properties of the analyte and increase the sample stability, volatility, and ionization efficiency needed for MS. Table II summarizes the application of the derivatization technique for various analytes, hence increasing the stability and sensitivity.
Sulfonate esters are known DNA reactive genotoxins and can be formed from the reaction of residual alcoholic solvents used in the manufacturing process and sulfonic acids (equation 1).

Sulfonate esters do not have sufficient vapor pressure to be analyzed using headspace GC. Analysis using direct injection is prone to artifacts because of ester hydrolysis, decomposition of API salts, and matrix interference.
Derivatization of sulfonate esters before analysis not only stabilized the analyte, but also increased volatility because of the low polarity of derivatized esters (34–36). For instance, pentafluorothiophenol is a commonly used derivatization reagent for sulfonate esters. As shown in equation 2, sulfonate esters react with pentafluorothiophenol to form volatile sulfide:
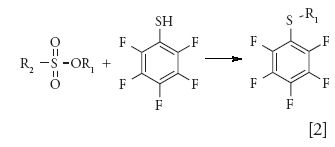
However, this method does not distinguish between different alkyl groups (R2 in equation 2) and provides common derivatization products for the analysis of various alkyl sulfonates and sulfates, which limits the selectivity. This approach was demonstrated by Jacq and colleagues (36) to monitor the formation of ethyl mesylate from ethanol and methanesulfonic acid in the reaction mixture.
Hydrazine, a GTI, is a common building block in the synthesis of many drug substances and also is a known degradation product of the antituberculosis drug isoniazid. The drug is highly reactive with a high polarity, low molecular weight, limited volatility, and lack of UV chromophore, which makes it challenging for the analysis of residual hydrazine. Derivatization using benzaldehyde to provide resulting benzalazine has been a favorite approach for the analysis of hydrazines followed by analysis using various detectors (equation 3) (37–39). The resulting benzalazine may be analyzed using GC or HPLC analysis.
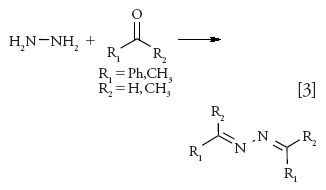
Derivatization reaction time is reported to be critical as an increase in benzalazine has been observed if the aqueous reaction sample is allowed to stand for a longer time before analysis. In situ derivatization of hydrazine using acetone or acetone-d6 followed by GC–MS analysis of the resulting acetone azine has an advantage because acetone may be used as a derivatizing agent as well as a diluent (38).
Alkyl chlorides, which are alkylating agents, may be formed because of the use of various alcohols and aqueous hydrochloric acid during the API synthesis. A genotoxic impurity such as 4-chloro-1-butanol may also be generated if tetrahydrofuran and hydrochloric acid are used during the manufacturing process of an API (equation 4).
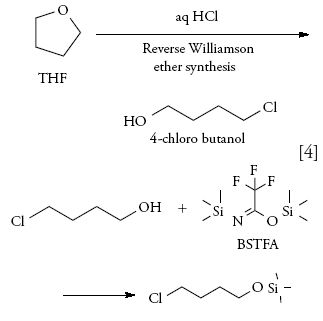
Because of low sensitivity and a tendency to react back to tetrahydrofuran, 4-chloro-1-butanol needs to be derivatized before analysis. This may be done easily by silylation using N,O-bis(trimethylsilyl)trifluoroacetamide (BSTFA, a common reagent for hydroxyl group derivatization); the resulting trimethylsilyl ether is analyzed by headspace GC. To ensure accuracy and precision, 3-chloro-1-butanol may be used as an internal standard (33).
We also used derivatization with the BSTFA technique followed by GC–MS analysis in SIM mode to track the residual amount of 4-chloro-1-butanol in the final API as a limit test, with limits of detection (LOD) of <1 ppm and sample concentration of 1 mg/mL.
Determination of low levels of small alkyl aldehydes, such as formaldehyde, poses an analytical challenge because of their volatility and stability issues. Formaldehyde is eluted very fast and no specific ions are present for selective and sensitive detection by GC–MS. Derivatization is often applied to enhance stability and sensitivity with the change in its physicochemical properties (32). Formaldehyde is derivatized to diethoxymethane by addition of ethanol in the presence of p-toluenesulfonic acid as a catalyst. A similar approach has been reported for the analysis of unstable acid chlorides, aziridines (40), and chlorophenols (41). A combined approach of extraction followed by derivatization has been developed for the determination of small, water-soluble amines such as aziridine and 2-chloroethylamine in drug substances at trace levels before quantitation by GC (40).
Analysis of GTIs by LC
LC is the primary separation technique for nonvolatile and thermally labile analytes. LC techniques include reversed-phase chromatography, normal-phase chromatography, and hydrophilic-interaction chromatography (HILIC). Reversed-phase HPLC is typically the first choice used for the analysis of nonvolatile GTIs. HILIC may be used to retain and analyze very polar analytes, which are difficult to retain and are eluted at solvent front with reversed-phase LC. Detection by UV is the first choice for the GTI analysis. However, MS is becoming a fairly common and universal detection method these days because of its enhanced sensitivity and selectivity. Other detection methods reported in the literature are evaporative light-scattering detection (ELSD) and charged aerosol detection (CAD) for the analysis of GTIs that lack a UV chromophore. Derivatization may be used to introduce a chromophore for UV analysis, to increase ionization for MS, or enhance stability of the analyte.
Direct Analysis (No Derivatization)
GTI Analysis Using High Sample Loading, LC–UV
Similar to GC, the control level of analytes drives the required sensitivity of the method and detector to be used with LC. UV detection is typically less selective and less sensitive compared to MS. However, at the level of 100 ppm, for compounds with strong UV chromophores and no matrix interference, UV still remains the most preferable detector for routine analysis because of its robustness, ease of use, and easy transfer (13–15,42,43).
The HPLC–UV impurity method for drug substances may be used as an initial platform followed by increasing the sample load to increase sensitivity. Similar technology has been used in our laboratory for the determination of a GTI, bromopyrazole, in a drug substance. In this case, the GTI control level was determined to be 160 ppm based on the TTC approach. First, the drug substance impurity method was assessed for the matrix interference and then the sample concentration was increased from 0.4 mg/mL to 1 mg/mL and the injection volume was increased from 10 μL to 20 μL to enhance the sensitivity. Figure 3 shows overlay chromatograms of API unspiked and spiked with bromopyrazole at the 50 ppm level. This method demonstrated excellent precision, spiked recovery, and linearity assessed up to 180 ppm (R2 = 1.0).
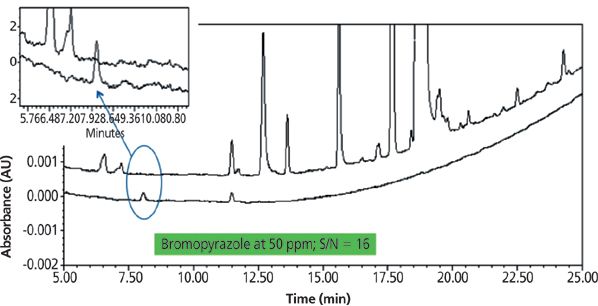
Figure 3: Overlay HPLC–UV chromatogram of bromopyrazole spiked in a drug substance. Column: 150 mm × 4.6 mm, 3.5-μm Zorbax Eclipse XDB-C18 Rapid Resolution.
GTI Analysis Using LC–MS and LC–MS-MS
MS has become the detection method of choice and is widely used for GTI analysis because of its high selectivity and sensitivity. Table III summarizes the applications of MS for the analysis of various analytes in pharmaceutical compounds. However, matrix interference is a higher risk than GC–MS and may cause analyte ion suppression or enhancement.
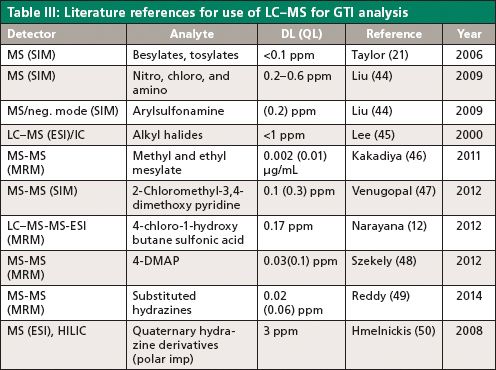
The recent advancement of MS instrumentation has established another level and possibility to achieve much higher sensitivity for GTIs (12,46,47,49–51). Switching from selected ion monitoring (SIM) to multiple reaction monitoring (MRM) mode for the analysis of 4-dimethylaminopyridine resulted in increased sensitivity and lower limits of quantitation (LOQ) (48). A highly sensitive and precise analytical method using LC–MS-MS was reported for the quantitation of 2-chloromethyl-3,4-dimethoxypyridine hydrochloride in APIs and the final tablet form (47). Trace levels of ammonium acetate were added to the mobile phase to enhance ionization and detection. In our laboratory, LC–MS-MS was also successfully applied to quantify a hydroxylamine impurity present at a low level in a drug substance (52). LC–MS in SIM mode did not provide the required sensitivity of 10 ppm. To increase the sensitivity, the parent ion obtained from LC–MS (SIM) was isolated and a collision energy of 17 eV (optimized) was applied using a triple-quadrupole mass spectrometer. The resulting daughter ion was monitored, providing an LOD of 1 ppm, excellent linearity, and percent recovery of 91% at the 2 ppm level. Figure 4 shows the representative chromatogram for the daughter ion.
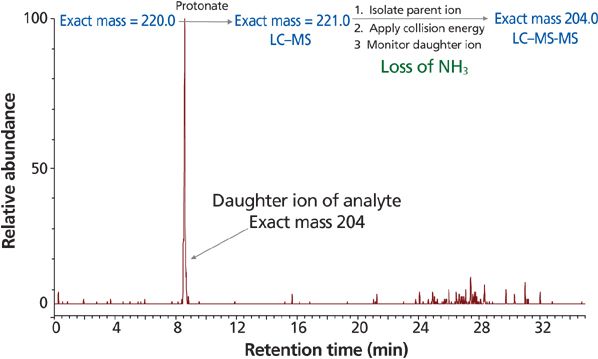
Figure 4: Representative chromatogram of hydroxylamine impurity MRM at 1 ppm level.
HILIC using MS-compatible mobile phases in conjunction with MS has also been used as an alternative to reversed-phase and ion pair chromatography for the analysis of polar analytes (50).
GTI Analysis Using Derivatization Followed by LC
As is the case for GTI analysis by GC, direct accurate analysis of some of the genotoxic impurities by LC is challenging because they react rapidly, decompose, lack a UV chromophore or ionizable functional groups, or need to be derivatized before analysis. Derivatizing agents are selected based on the functional groups of the GTIs and are focused mainly toward the improvement of sensitivity, the generation of chromophores, and analyte stability (32). Table IV summarizes the application of derivatization for various analytes enhancing stability, introducing UV chromophore, and ionizable functional groups before LC analysis.
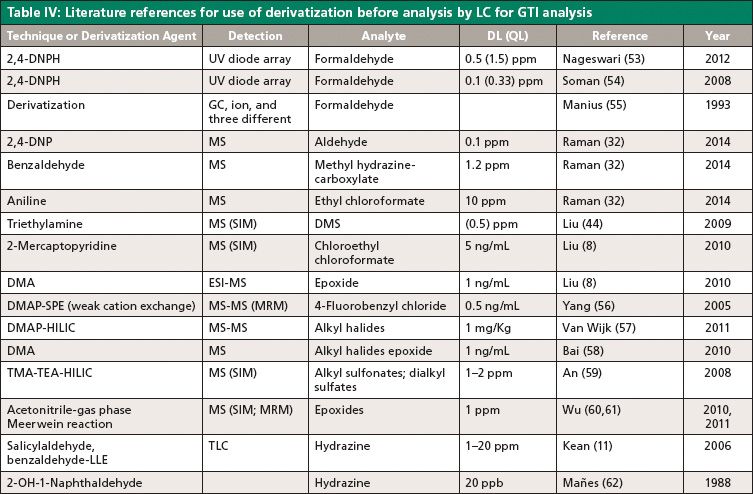
Aldehydes are prone to undergo partial aerial oxidation leading to inaccurate determinations. A favorite derivatizing agent for the analysis of aldehydes has been 2,4-dinitrophenylhydrazine (2,4-DNPH), which provides respective hydrazone derivatives that have absorbing maxima at 360 nm (equation 5):
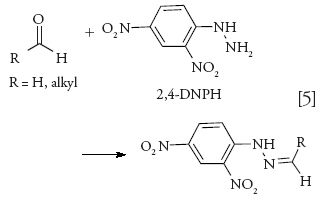
The resulting hydrazones are analyzed either by HPLC–UV (53,54) or LC–MS (32).
Derivatization has been one of the main analytical techniques for the analysis of hydrazines as well because they are highly reactive, polar, and lack UV chromophores. Aryl aldehydes are most commonly used to yield respective benzalazine derivatives, which have UV chromophores and are stable for analysis (11,62). Determination of residual hydrazine and isopropyl hydrazine in our laboratory was performed by derivatization followed by LC–UV (equation 6).
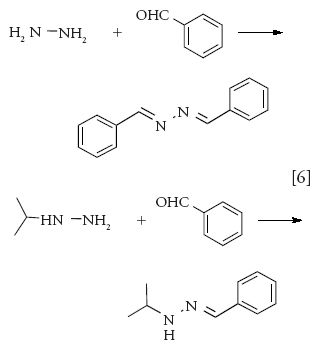
A solution of 5% benzaldehyde in methanol was added to the sample solution in water in an HPLC vial, and derivatization was carried out at 50 °C for 30 min. The derivatization time was optimized by comparing the peak areas of the derivatized product at different intervals. The detection wavelength was selected as 300 nm, which was the absorption maximum of the derivatized product, and LC analysis was carried out using a Waters XBridge C18 column. Figure 5 shows a chromatogram of the starting material spiked with hydrazine and isopropyl hydrazine. Linearity was demonstrated over the 1–40 ppm range for hydrazine and the 5–100 ppm range for isopropyl hydrazine (based on the sample concentration of 10 mg/mL), with a correlation coefficient of >0.999 and excellent precision.
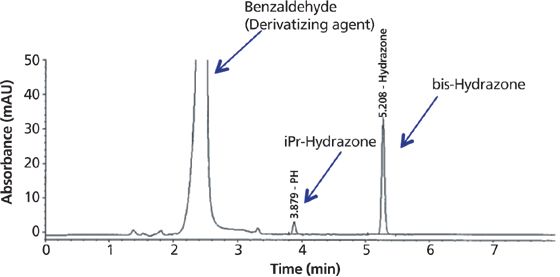
Figure 5: A representative chromatogram for analysis of hydrazine and isopropyl hydrazine. Column: 150 mm × 4.6 mm, 3.5-μm Waters Xbridge C18; mobile-phase A: water; mobile-phase B: acetonitrile; temperature: 50 °C; injection volume: 5 μL; flow rate: 1 mL/min.
The method was further optimized to determine the residual hydrazine in a drug substance since the drug substance was not aqueous soluble; the diluent was changed to methanol and the concentration of the derivatizing agent was changed from 5% to 10% in methanol to keep the same ratio in the derivatizing mixture. The method demonstrated excellent spiked recoveries (98.9%).
Various alkyl and aryl halides, which are not sufficiently volatile and are thermally labile, have been derivatized using 4-dimethylamino pyridine (4-DMAP) or dimethylamine (DMA) forming a stable quaternary amine salt derivative before LC analysis (equation 7) (56–58).

HILIC–MS-MS has been used to retain polar derivatized products and quantify the amount of derivatives. HILIC using a mass compatible buffer provides a great advantage compared to reversed-phase HPLC in which MS noncompatible ion-exchange or ion-pairing buffers are generally used. Another key advantage is that reagent-related fragments produced for derivatives allow for low-level screening of alkyl halides. A three-step weak cation-exchange SPE procedure was used to remove excess DMAP and the resulting solution was analyzed by HPLC–MS-MS in MRM mode. Chloroformates tend to be much more moisture sensitive and hydrolytically unstable, so derivatization is used to stabilize the analyte. It was reported that strong basic derivatization reagents caused decomposition of the desired derivatives. Therefore, residual chloroethylchloroformate (CECF) in API was derivatized using 2-mercaptopyridine, a less basic nucleophile (8). The authors suggested that both glassware and solvents needed to be suitably dried to prevent interference from residual moisture and achieve the desired sensitivity and reproducibility.
Techniques similar to alkyl halides can also be applied for the analysis of sulfonate esters (equation 8) (44,59).
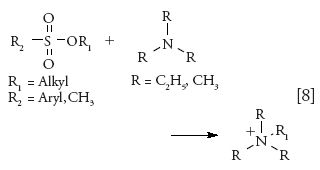
A method comprising generic derivatization and LC–MS (SIM) in combination with a HILIC stationary phase has been used for the analysis of a group of commonly encountered alkyl esters of sulfonates or sulfates present in drug substances at low parts-per-million levels. Trimethyl and triethylamine have been used as derivatizing agents and a HILIC stationary phase was used to retain highly polar quaternary ammonium derivatization products and separate them from the API peak.
Chemical derivatization and coordination ion spray ionization MS have been used to enhance the detection sensitivity of neutral analytes such as epoxides (58). The chemical derivatization converts analytes into highly ionizable, permanently charged derivatives, which become readily detectable by MS, whereas the coordination ion spray MS approach improves ionization by forming neutral ion adducts with metal ions such as Na+, K+, or NH4+, which are introduced into the electrospray ionization (ESI) source.
Innovative Analytical Techniques for the Analysis of GTIs
Because of the wide variety of GTIs present and their physicochemical properties, many innovative analytical techniques have been developed and reported in the literature to reduce matrix interference and enhance sensitivity. Table V summarizes these techniques for various analytes. Matrix deactivation provided an innovative approach to stabilize reactive or unstable analytes (24). This deactivation has been achieved chemically either by protonating and masking the basic functionalities or scavenging the hypothetical reactive species in the sample matrix. Molecularly imprinted polymers have high affinity binding sites for target analytes, whereas APIs have a different size and structure and work as scavenger resins. The efficiency of these polymers has been demonstrated for the quantitative removal of acetamide and aryl sulfonates in the presence of APIs (51).
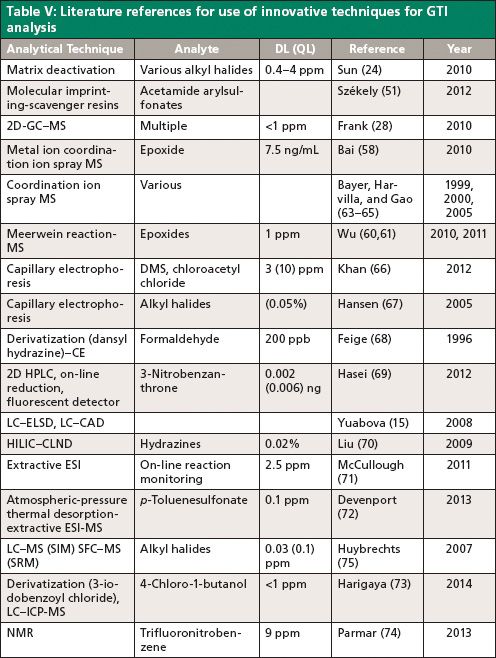
The analysis of neutral GTIs provides a challenge because of their poor ionization efficiency. Chemical derivatization followed by coordination ion spray MS improved sensitivity for some neutral epoxides by forming neutral ion-adducts with metal ions such as Na+, K+, or NH4+, which are then introduced into the ESI source and analyzed by MS (58,63–65). Formations of adduct ions in positive or negative detection mode is applicable. The gas-phase derivatization via Meerwein reaction provided another alternative for LC–MS analysis of trace-level epoxides (60,61). Ethylnitrilium ions generated by atmospheric pressure ionization (during MS when acetonitrile is used as mobile phase for HPLC) react with epoxides, and then Meerwein reaction products are analyzed by either SIM or MRM modes. This technique is a great alternative in cases when an analyte is difficult to analyze directly because it has poor ionization and is unstable in solution-phase derivatization.
Genotoxins are mostly determined using HPLC–UV–MS and GC–MS techniques for their robustness. However, the use of capillary electrophoresis (CE) can complement the existing techniques for analysis and open new horizons. CE has been reported for the analysis of dimethyl sulfate, chloroacetyl chloride (66), formaldehyde (68), and alkyl halides (67). It also appears to be more robust to matrix effects and provides highly efficient separations and consumes very low amounts of reagents. However, it has the drawbacks of poor sensitivity and precision needed for trace analysis.
The potential applicability of supercritical fluid chromatography (SFC)–MS in selective reaction monitoring (SRM) mode has been reported as a complementary and orthogonal approach to HPLC for the analysis of a GTI at sub-part-per-million levels (sample concentration 10 mg/mL) in an unknown API (29). SFC may prove to be an advantageous technique when attaining a high sample concentration is a significant challenge because of limited solubility. A novel LC–inductively coupled plasma (ICP)-MS method has been used for the analysis of 4-chloro-1-butanol (73). To enhance the selectivity, a 2D LC system is further connected with ICP-MS. Then, 4-chloro-1-butanol is derivatized with 3-iodobenzoyl chloride in acetonitrile and the resulting derivative is analyzed for iodine (m/z 127). Methanol is selected as the organic solvent for the mobile phase of the second LC system, which is more suitable for ICP-MS because of its lower carbon content compared to acetonitrile.
Quantitative nuclear magnetic resonance (NMR) spectroscopy (74) is also feasible with recent developments of high strength systems (such as 400–600 MHz) combined with cryoprobe technology. This technique has advantages of being quantitative in nature, easy sample preparation, and the ability to provide quick answers. A comparison experiment may be performed with and without spikes at an appropriate level to provide a quick answer if it is feasible to be used for a particular analysis. 19F-NMR is widely used for the quantitation of fluorinated impurities. Because of the high sample concentration (1 g in 300 μL DMSO-d6) and hence high viscosity, analysis is done at 343 K to provide a sharp signal, and 19F1 at -156 ppm is selected for quantitation because it provides the simplest multiplet structure. However, this approach does have some notable disadvantages, such as being less sensitive (requiring high sample concentration) and more expensive.
Conclusion
Controlling GTIs in pharmaceutical compounds is of the utmost importance and is a requirement throughout the clinical development and commercial stage. A good process understanding and sensitive, specific analytical methods are needed to control these impurities below the TTC level.
Many factors, including physicochemical properties of the analytes, need to be considered as an effective analytical method development strategy. Direct analysis without extensive sample preparation is preferred. However, sometimes sample preparation becomes an integral part of the analytical method if there is matrix interference. Hyphenated techniques are gaining popularity, and with advancements in MS instrumentation, MS is becoming the detection of choice because it provides the required sensitivity and specificity in SIM and MRM modes. Chemical derivatization offers an alternative to achieve the needed sensitivity and sample stability. Following method development, the method is validated to demonstrate linearity over the desired range, spiked recovery, and sensitivity.
Acknowledgments
The authors would like to acknowledge Drs. Christine Gu and C.J. Venkatramani for their contribution to hydroxylamine impurity analysis.
References
(1) S. Görög, J. Pharm. Biomed. Anal. 48, 247 (2008).
(2) T. McGovern and D. Jacobson-Kram, TrAC, Trends Anal. Chem. 25, 790 (2006).
(3) D.A. Pierson, B.A. Olsen, D.K. Robbins, K.M. DeVries, and D.L. Varie, Org. Process Res. Dev. 13, 285 (2009).
(4) D.I. Robinson, Org. Process Res. Dev.14, 946 (2010).
(5) N.V.V.S.S. Raman, A.V.S.S. Prasad, and K. Ratnakar Reddy, J. Pharm. Biomed. Anal.55, 662 (2011).
(6) A. Giordani, W. Kobel, and H.U. Gally, Eur. J. Pharm. Sci.43, 1 (2011).
(7) U. Yadav, P. Dhiman, N. Malik, A. Khatkar, N. Redhu, and D.P. Singh, J. Biomed. Pharm. Res.2, 39 (2013).
(8) D.Q. Liu, M. Sun, and A.S. Kord, J. Pharm. Biomed. Anal.51, 999 (2010).
(9) L.K. Dow, M.M. Hansen, B.W. Pack, T,J. Page, and S.W. Baertschi, J. Pharm. Sci.102, 1404 (2013).
(10) N.A. Charoo and A.A. Ali, Drug Dev. Ind. Pharm.39, 947 (2013).
(11) EMEA-CHMP, EMEA/CHMP/QWP/251344/2006 London (June 28, 2006).
(12) Draft Guidance for Industry: Genotoxic and Carcinogenic Impurities in Drug Substances and Products: Recommended Approaches. FDA, CDER, December 2008.
(13) International Conference on Harmonization, ICH Q3A (R2): Impurities in New Drug Substances (ICH, Geneva, Switzerland, October 2006).
(14) International Conference on Harmonization, ICH Q3C (R4): Impurities: Residual Solvents (ICH, Geneva, Switzerland, February 2009).
(15) International Conference on Harmonization, ICH Q3B (R2): Impurities in New Drug products (ICH, Geneva, Switzerland, June 2006).
(16) L. Müller, R.J. Mauthe, C.M. Riley, M.M. Andino, D.D. Antonis, C. Beels, J. DeGeorge, A.G.M. De Knaep, D. Ellison, J.A. Fagerland, R. Frank, B. Fritschel, S. Galloway, E. Harpur, C.D.N. Humfrey, A.S. Jacks, N. Jagota, J. Mackinnon, G. Mohan, D.K. Ness, M.R. O'Donovan, M.D. Smith, G. Vudathala, and L. Yotti, Regul. Toxicol. Pharmacol. 44, 198 (2006).
(17) International Conference on Harmonization, ICH M7 (Step. 4): Assessment and Control of DNA Reactive (Mutagenic) Impurities in Pharmaceuticals to Limit Potential Carcinogenic Risk (ICH, Geneva, Switzerland, June 2014).
(18) International Conference on Harmonization, ICH S9: Nonclinical Evaluation for Anticancer Pharmaceuticals (ICH, Geneva, Switzerland, March 2009).
(19) S.M. Galloway, M.V. Reddy, K. McGettigan, R. Gealy, and J. Bercu, Regul. Toxicol. Pharmacol.66, 326 (2013).
(20) H.G. Ramjit, M.M. Singh, A.B. Coddington, J. Mass Spectrom.31, 867 (1996).
(21) G.E. Taylor, M. Gosling, and A. Pearce, J. Chromatogr. A1119, 231 (2006).
(22) Y. Mamilla, K. Chetyala, R. Venna, R. Gajjela, K. Katragadda, S. Govindasamy, S. Mulukutla, and D. Datta, Chromatographia71, 733 (2010).
(23) T. Kaleemullah, M. Ahmed, H.K. Sharma, K.V.S.N. Raju, and M.N. Kumar, Der Pharma Chemica3, 390 (2011).
(24) M.J. Sun, L. Bai, G.J. Terfloth, D.Q. Liu, and A.S. Kord, J. Pharm. Biomed. Anal.52, 30 (2010).
(25) I. Colón and S.M. Richoll, J. Pharm. Biomed. Anal.39, 477 (2005).
(26) J. Zheng, W.A. Pritts, S. Zhang, and S. Wittenberger, J. Pharm. Biomed. Anal.50, 1054 (2009).
(27) U. Wollein and N. Schramek, Eur. J. Pharm. Sci.45, 201 (2012).
(28) F. David, K. Jacq, P. Sandra, A. Baker, and M. Klee, Anal. Bioanal. Chem.396, 1291 (2010).
(29) T.D. Ho, M.D. Joshi, M.A. Silver, and J.L. Anderson, J. Chromatogr. A1240, 29 (2012).
(30) M. Andre, J. Loidl, G. Laus, H. Schottenberger, G. Bentivoglio, K. Wurst, and K.H. Ongania, Anal. Chem.77, 702 (2004).
(31) T.D. Ho, P.M. Yehl, N.P. Chetwyn, J. Wang, J.L. Anderson, and Q. Zhong, J. Chromatogr. A1361, 217 (2014).
(32) N.V.V.S.S. Raman, A.V.S.S. Prasad, K.R. Reddy, J. Pharm. Biomed. Anal.89, 276 (2014).
(33) K. Harigaya, H. Yamada, K. Yaku, H. Nishi, and J. Haginaka, Chem. Pharm. Bull.62, 395 (2014).
(34) C.R. Lee, F. Guivarch, C. Nguyen Van Dau, D. Tessier, and A.M. Krstulovic, Analyst 128, 857 (2003).
(35) R. Alzaga, R.W. Ryan, K. Taylor-Worth, A.M. Lipczynski, R. Szucs, P. Sandra, J. Pharm. Biomed. Anal.45, 472 (2007).
(36) K. Jacq, E. Delaney, A. Teasdale, S. Eyley, K. Taylor-Worth, A. Lipczynski, V.D. Reif, D.P. Elder, K.L. Facchine, S. Golec, R.S. Oestrich, P. Sandra, and F. David, J. Pharm. Biomed. Anal.48, 1339 (2008).
(37) O. Gyllenhaal, L. Grönberg, and J. Vessman, J. Chromatogr. A511, 303 (1990).
(38) M. Sun, L. Bai, and D.Q. Liu, J. Pharm. Biomed. Anal.49, 529 (2009).
(39) A. Carlin, N. Gregory, and J. Simmons, J. Pharm. Biomed. Anal.17, 885 (1998).
(40) P. E. de Haan, D. de Jong, J.H.M. van den Berg, and C.G. Kruse, J. High Res.Chromatogr.12, 604 (1989).
(41) P. de Morais, T. Stoichev, M.C. Basto, P. Carvalho, and M.T.D. Vasconcelos, Anal. Bioanal. Chem.399, 2531 (2011).
(42) V. Madireddy, K.S. Babu, and P. Narayanreddy, Global J. Anal. Chem.2, 198 (2011).
(43) L. Valvo, R. Alimenti, S. Alimonti, S. Raimondi, F. Foglietta, and F. Campana, J. Pharm. Biomed. Anal.15, 989 (1997).
(44) D.Q. Liu, T.K. Chen, M.A. McGuire, and A.S. Kord, J. Pharm. Biomed. Anal.50, 144 (2009).
(45) C.R. Lee, M. Hubert, C.N. Van Dau, D. Peter, and A.M. Krstulovic, Analyst125, 1255 (2000).
(46) P.R. Kakadiya, B.P. Reddy, V. Singh, S. Ganguly, T.G. Chandrashekhar, and D.K. Singh, J. Pharm. Biomed. Anal.55, 379 (2011).
(47) N. Venugopal, A.V.B. Reddy, K.G. Reddy, V. Madhavi, and G. Madhavi, J. Pharm. Biomed. Anal.70, 592 (2012).
(48) G. Szekely, B. Henriques, M. Gil, A. Ramos, and C. Alvarez, J. Pharm. Biomed. Anal.70, 251 (2012).
(49) A.V.B. Reddy, N. Venugopal, and G.Madhavi J. Anal. Sci. Technol.5, 18 (2014).
(50) J. Hmelnickis, O. PugoviÄs, H. Kažoka, A. Viksna, I. Susinskis, and K. Kokums, J. Pharm. Biomed. Anal.48, 649 (2008).
(51) G. Székely, E. Fritz, J. Bandarra, W. Heggie, and B. Sellergren, J. Chromatogr. A1240, 52 (2012).
(52) K.C. Gu, H.J.W. Comstock, L. Wigman, C.J. Venkatramani, and A. Deese, "Quantitative Analysis of Potential Genotoxic Impurities by High Resolution Mass Spectrometer," presented at 60th ASMS Conference on Mass Spectrometry and Allied Topics Vancouver, BC, Canada (2012).
(53) A. Nageswari, K.V.S.R. Krishna Reddy, and K. Mukkanti, Chromatographia75, 275 (2012).
(54) A.Q. Soman, Y. Chan, and Q. Li, J. Chromatogr. Sci. 46, 461 (2008).
(55) G. Manius, L.-F. Wen, and D. Palling, Pharm. Res.10, 449 (1993).
(56) E. Yang, S. Wang, C. Bowen, J. Kratz, M.J. Cyronak, and J.R. Dunbar, Rapid Commun. Mass Spectrom. 19, 759 (2005).
(57) A.M. van Wijk, B. Beerman, H.A.G. Niederländer, A.H.G. Siebum, and G.J. de Jong, Anal. Bioanal. Chem.400, 1375 (2011).
(58) L. Bai, M. Sun, J. An, D.Q. Liu, T.K. Chen, and A.S. Kord, J. Chromatogr. A 1217, 302 (2010).
(59) J. An, M. Sun, L. Bai, T. Chen, D.Q. Liu, and A. Kord, J. Pharm. Biomed. Anal.48, 1006 (2008).
(60) L. Wu, D.Q. Liu, and A.S. Kord, J. Am. Soc. Mass Spectrom.21, 1802 (2010).
(61) L. Wu, D.Q. Liu, F.G. Vogt, and A.S. Kord, J. Pharm. Biomed. Anal.56, 1106 (2011).
(62) J. Manes, M.J. Gimeno, J.C. Molto, and G. Font, J. Pharm. Biomed. Anal.6, 1023 (1988).
(63) E. Bayer, P. Gfrörer, and C. Rentel, Angew. Chem., Int. Ed.38, 992 (1999).
(64) S. Gao, Z.-P. Zhang, and H.T. Karnes, J. Chromatogr. B825, 98 (2005).
(65) C.M. Havrilla, D.L. Hachey, and N.A. Porter, J. Am. Chem. Soc.122, 8042 (2000).
(66) M. Khan, K. Jayasree, K.V.S.R.K. Reddy, and P.K. Dubey, J. Pharm. Biomed. Anal. 58, 27 (2012).
(67) S.H. Hansen and Z.A. Sheribah, J. Pharm. Biomed. Anal.39, 322 (2005).
(68) K. Feige, T. Ried, and K. Bächmann, J. Chromatogr. A730, 333 (1996).
(69) T. Hasei, H. Nakanishi, Y. Toda, and T. Watanabe, J. Chromatogr. A1253, 52 (2012).
(70) M. Liu, J. Ostovic, E.X. Chen, and N. Cauchon, J. Chromatogr. A1216, 2362 (2009).
(71) B.J. McCullough, T. Bristow, G. O'Connor, and C. Hopley, Rapid Commun. Mass Spectrom.25, 1445 (2011).
(72) L.C.S.N.A. Devenport, F. H. Alruways, D.J. Weston, J.C. Reynolds, and C.S. Creaser, Anal. Chem.85, 6224 (2013).
(73) K. Harigaya, H. Yamada, K. Yaku, H. Nishi, and J. Haginaka, Anal. Sci. 30, 377 (2014).
(74) A.K.M.K. Parmar, R. Patel, and S. Prajapati, Int. J. ChemTech Res. 5, 312 (2013).
(75) T. Huybrechts, "Successfully developing and validating methods for the quantification of genotoxic impurities in APIs," presented at Informa Genotoxic Impurities Meeting, Prague, Czech Republic, 2007.
Archana Kumar, Kelly Zhang, and Larry Wigman are with Small Molecule Pharmaceutical Sciences at Genentech Inc., in South San Francisco, California. Direct correspondence to: kumar.a@gene.com

New TRC Facility Accelerates Innovation and Delivery
April 25th 2025We’ve expanded our capabilities with a state-of-the-art, 200,000 sq ft TRC facility in Toronto, completed in 2024 and staffed by over 100 PhD- and MSc-level scientists. This investment enables the development of more innovative compounds, a broader catalogue and custom offering, and streamlined operations for faster delivery. • Our extensive range of over 100,000 high-quality research chemicals—including APIs, metabolites, and impurities in both native and stable isotope-labelled forms—provides essential tools for uncovering molecular disease mechanisms and exploring new opportunities for therapeutic intervention.
New Guide: Characterising Impurity Standards – What Defines “Good Enough?”
April 25th 2025Impurity reference standards (IRSs) are essential for accurately identifying and quantifying impurities in pharmaceutical development and manufacturing. Yet, with limited regulatory guidance on how much characterisation is truly required for different applications, selecting the right standard can be challenging. To help, LGC has developed a new interactive multimedia guide, packed with expert insights to support your decision-making and give you greater confidence when choosing the right IRS for your specific needs.

.png&w=3840&q=75)

.png&w=3840&q=75)


.png&w=3840&q=75)


.png&w=3840&q=75)


