Analytical Limbo: How Low Can You Go?
LCGC North America
September 2006. In analytical chemistry, the continual quest for enhanced sensitivity and specificity - in gas chromatography (GC), this can be equated to separation power - remain the common goal in the development of new analytical methodologies. Today, GC is still the most widely used method for the analysis of volatile and semivolatile organic compounds. When coupled with the right choice of detector for the specific application, a wide linearity range and low limit of detection (LOD) can be met. For GC analyses, many approaches can be used to achieve greater sensitivity and lower LOD. They can be classified broadly into four categories: improved sampling (sample preparation) strategies; sample introduction methods; improved chromatographic performance; and alternative (selective–sensitive) detection transducers. This article provides an up-to-date review of existing and emerging chromatographic innovations, based upon these four strategies, that will improve sensitivity and detection limits of trace..
In analytical chemistry, the continual quest for enhanced sensitivity and specificity — in gas chromatography (GC), this can be equated to separation power — remain the common goal in the development of new analytical methodologies. Today, GC is still the most widely used method for the analysis of volatile and semivolatile organic compounds. When coupled with the right choice of detector for the specific application, a wide linearity range and low limit of detection (LOD) can be met. For GC analyses, many approaches can be used to achieve greater sensitivity and lower LOD. They can be classified broadly into four categories: improved sampling (sample preparation) strategies; sample introduction methods; improved chromatographic performance; and alternative (selective–sensitive) detection transducers. This article provides an up-to-date review of existing and emerging chromatographic innovations, based upon these four strategies, that will improve sensitivity and detection limits of trace analysis in GC.
The demand for enhanced sensitivity and detectability in analytical technologies has never been greater. The need to measure trace levels of numerous environmental pollutants is regulated by strict laws in many countries, as most of them pose serious health risks and threats to the ecosystem. These include polychlorinated biphenyls (PCBs), polyaromatic hydrocarbons (PAHs), and a vast array of modern pesticides and toxicants. Thus, when complex sample matrices are involved, almost invariably, a tedious sample workup and a highly sensitive analytical solution are required for their separation and detection.
The more frequent use of hair and other alternative matrices (for example, saliva and nails) in clinical and forensic applications also demand greater sensitivity and lower detection limits for qualitative and quantitative measurements of a variety of possible analytes (for example, drugs), as they generally are present in low concentrations (1,2). For postmortem analyses in particular, the limited quantity of some biological matrices (3) (for example, due to severe putrefaction), also intensifies the quest for sensitive analytical methods. By IUPAC definition, sensitivity of an analytical method is defined by the slope of the calibration curve (4). Hence, when comparing two analytical methods, the method that produces the steeper linear calibration curve for the same analyte is considered to be more sensitive, provided that their "noise" is approximately equivalent. While limits of detection (LOD) provide good indication of the instrument performance, LOD is not considered a direct measure of sensitivity (5,6). Despite this, LOD is generally an unofficial yardstick for estimating analytical sensitivity or suitability of an instrumental technique for trace analysis. For the purpose of this article, a broad definition of sensitivity will be adopted with the term sensitivity referring to both the previous official and unofficial meanings.
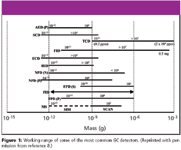
Figure 1
Gas chromatography (GC) is the method of choice for analyzing thermally stable volatile and semivolatile substances due to its acknowledged "speciation" or molecular isolation capability and the generally accepted sensitivity of the method. The use of appropriate derivatization methods for nonvolatile and thermally unstable components extend GC applications to a much wider suite of compounds (7). When coupled with the right choice of selective detector, the requirement for wide linearity range and low detection limits can be met. Figure 1 lists the working range of some of the most common GC detectors (8).
For GC analyses, many approaches can be used to achieve greater sensitivity and reduce the analytical LOD. They can be classified broadly into four categories: improved sampling (sample preparation) strategies; sample introduction methods; improved chromatographic performance; and alternative (selective–sensitive) detection transducers, as illustrated in Figure 2. Each of these components is integral to the overall analytical GC process, and their individual contribution fuels the primary aim of this article, which is to review approaches that will permit the analyst to "go low" to meet the sensitivity needs of ultratrace analysis in GC. The following discussion provides an overview, rather than an exhaustive treatise, on these approaches.
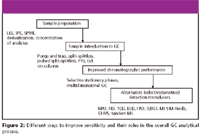
Figure 2
Sample Preparation (Sample Workup)
In reality, analytes rarely are present in their pure forms in a sample and, thus, sample preparation to isolate or release the target analytes from matrix interferences is almost always necessary; a signal increase through coelution is clearly an artificial contributor to sensitivity enhancements. Most sample preparation processes incorporate a concentration step before the reconstitution of the extract in an appropriate solvent before GC analysis. This concentration step is not only time consuming and labor-intensive but also risks the loss of volatile analytes. The right choice of derivatization method also can confer sensitivity to the analysis by the simultaneous improvement in an analyte's peak height (and symmetry) and chromatographic performance.
Today, classical liquid–liquid extraction (LLE) increasingly is replaced by elegant sorbent-based extraction methods such as solid-phase extraction (SPE), solid-phase microextraction (SPME), and stir-bar sorptive extraction (SBSE). The beauty of these sorbent-based extraction methods lies in the simplicity of their experimental setup, perceived fast extraction rates, significant reduction in hazardous solvent consumptions, versatility in the wide choice of sorbent materials available (which permits selectivity toward the target analytes), and their general good reproducibility. Most extraction sorbents operate by physical-chemical distribution processes (for example, adsorption–absorption and ionic bonding), although the use of antibody–antigen recognition to effect specific isolation and concentration of analytes also has been realized in recent years with immunoaffinity sorbents. These immunoaffinity sorbents are made from antibodies immobilized onto silica sorbent supports and the high association equilibrium constants (as much as 1012 M-1 ) of these antibody–antigen complexes ensure high probability of such complex formations (even when only one specie of the complex is in very low concentration) for highly effective concentration of the target from sample solution. Immunoaffinity SPE columns are available commercially for specific applications (for example, LSD ImmunoElute for extraction of lysergic acid diethylamide [LSD]) and have been applied successfully to extract analytes such as clenbutarol (9), as well as morphine and metabolites from biological matrices (10,11). Recently, immunoaffinity sorbent for SPME applications for the extraction of theophylline from serum also has been developed by Yuan and colleagues (12). Further details on immunoaffinity SPE are available (13,14).
Other new generation sorbents for SPE include molecularly imprinted polymers (MIPs) and restricted-access materials (RAMs). The former are synthetic alternatives to immunoaffinity sorbents and are much less labor intensive and cheaper to manufacture. The use of MIPs in SPE and SPME formats has been reported for drugs (15–17) and pesticides (18). While RAMs can provide opportunities for simplifying sample preparation from biological matrices by directly partitioning the sample into the protein and analyte portions, their use does not necessarily lead to greater sensitivity in the extraction process. The incorporation of RAMs in both SPE and SPME has been reported, albeit mainly for high performance liquid chromatography (HPLC) applications.
New SPE configurations in the form of pipette-tip designs and multiwell filtration plates are aimed at accelerating sample preparation turnaround times in routine laboratories faced with high throughput workload (19,20). Batch-to-batch and manufacturer-to-manufacturer variations of SPE columns are the main concerns to the current and prospective users of SPE. Continual improvements in quality control protocols and innovation in production technology are expected to address the issue of product variability, which will be a major determinant for the outlook of the SPE manufacturing industry (21). Trends toward miniaturization and higher flow systems (for example, monolithic columns) might well be in store for the new generation SPE columns.
The popularity of SPME, which integrates sampling, extraction, and concentration, has revolutionized the analytical approach in many laboratories. This is evident from the explosion of literature ranging from theory to application notes on the technique since its first introduction by Arthur and Pawliszyn (22). Unlike SPE or LLE, almost all of the extracted analytes on the SPME fiber are desorbed thermally into the analytical system, thus, ensuring high sensitivity in the analysis. Headspace SPME can be considered to be the most widely used implementation mode, as this mode almost can eliminate matrix interferences (from the extraction process), prolong the life of the fiber coating, and completely eradicate the use of hazardous solvents. Headspace SPME was found to be 20 times more sensitive than the heated headspace method for the extraction of amphetamine from urine analyzed by chemical ionization (CI) GC–MS with selected ion monitoring (SIM) (23). To date, analytes with a wide diversity in volatile characteristics have been extracted successfully with headspace SPME, including flavors and fragrances, pesticides, and drugs. Many developments in sorbent materials for SPME also mirror those for SPE (that is, immuno-affinity, MIPs, and RAMs), which already have been described. On-fiber derivatization, with derivatization agent applied before or after the extraction step, extends SPME to more polar analytes. For future SPME designs, the incorporation of different derivatization agents onto the sorbent coatings for exclusive use in simultaneous sampling and on-fiber derivatization can provide another convenient option for the analytical chemist. Certainly, the process in which the derivatization agent is incorporated (for example, absorption versus adsorption), chemical and physical properties of the sorbent support, as well as stability and dynamics of the derivatization chemistry, are among the factors that must be considered for the success of this idea. In general, chemical derivatization of the analytes can enhance the sensitivity of detection significantly, regardless of the type of extraction method used.
SBSE is a variant on the SPME theme, and its implementation is analogous to the direct-immersion SPME mode or headspace SPME mode. Unlike direct-immersion SPME, the sorbent coating on the magnetic bar is much thicker (as much as 250 times greater volume of polydimethylsiloxane extraction phase). The amount of extraction phase, stirring action (to increase analyte mass transfer) and complete transfer of analytes work in unison to enable detection limits of as low as nanograms per liter to be achieved (24). Laboratory-prepared devices incorporating sorbent jackets (or sleeves) for fitting over magnetic stir-bars should make the SBSE approach available to most users. Clearly, the central theme in today's sample preparation tools is the reduction in solvent consumption and fast sample throughput. The development of extraction methods such as liquid-phase microextraction (25–27), solvent microextraction (28,29), single-drop microextraction (30,31), are also obvious trends towards reducing sample sizes and solvent consumptions while at the same time improving sensitivity in the analysis. Other new extraction technology includes accelerated solvent extraction and microwave-assisted solvent extraction, which can achieve very high extraction efficiencies at a fraction of the time and the amount of solvents that are required for classical Soxhlet extraction methods. Robotic sample preparation stations are becoming increasingly common in routine laboratories and are marketed under names such as CombiPAL (CTC Analytics, Zwingen, Switzerland), Focus Robotic Sample Processor (ATAS International BV, Veldhoven, The Netherlands), Varian 8200 CX Autosampler (Varian, Palo Alto, California), and Gerstel Multi Purpose Sampler MPS-3 (Gerstel, Mülheim a/d Ruhr, Germany). Many of these automated sample preparation systems are equipped to allow more than one mode of operation to be performed on-line: SPME, SPE, and LLE. Other important features are versatility in various sample introduction modes, which will be elaborated further in the next section.
Sample Introduction to GC
Sample introduction instrumentation can be considered the most versatile and vital piece of equipment to provide representative, accurate, reproducible, and discrimination-free sample transfer into the GC system for analysis. Proper sample introduction technology allows the integration of on-line sample preparation steps and opens up fertile ground for robotic automation. Sensitivity improvement in GC through sample introduction is aimed at minimizing mass discrimination, adsorption, artifact formation, and thermal degradation of the analytes during the sample introduction process. This is possible with modern innovations in ancillary chromatographic technologies such as inlet designs (for example, FocusLiner from SGE International, Victoria, Australia) and electronic pneumatic control to enable techniques such as pulsed splitless injections to be performed.
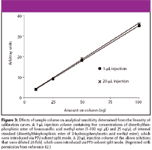
Figure 3
A more rewarding route to attain lower LOD and the required concentration sensitivity for trace analytes is through the use of large-volume injection (LVI) of samples. Figure 3 graphically illustrates the second point by comparing the analytical sensitivities from two calibration graphs obtained by introducing different injection volume at the same concentration. The gradients of the two graphs are essentially the same, indicating that the analytical sensitivity for a 1-μL injection of the more concentrated standard solution can be achieved with a 20-μL injection of a 20-fold diluted standard solution. Grob (32) also has reiterated the advantage of LVI for sensitivity improvement, particularly when the amount of sample volumes are limited and that reconcentration by classical methods of solvent evaporation might not be suitable.
Consider for a moment the time devoted to sample workup and concentration of the sample. Yet, in the majority of GC applications, less than 5 μL (for example of a 100-μL extract) is injected into the GC system for analysis. Clearly, improved concentration sensitivity and lower LOD can be met easily by injecting larger volumes of sample extracts. Table I illustrates the theoretical relationship between injection volumes and LOD of a hypothetical analyte, assuming complete transference of injected sample to the analytical system and the equal contribution of parameters such as noise, errors, and peak widths of the introduced sample volume. By increasing the injection volume from 1 μL to 100 μL, the LOD is concomitantly lowered by 100-fold.
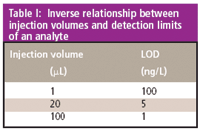
Table I: Inverse relationship between injection volumes and detection limits of an analyte
Figure 4 shows the relevance of LVI in further improvement of sensitivity after sample workup and the analyte enrichment step. By injecting all of the concentrated extract (20 μL) into the GC system for analysis after SPE, further sensitivity improvement of as much as 20-fold is attainable when compared with traditional small-scale LLE strategy, which employs a 1-μL injection of the 100-μL extract. The incorporation of LVI (after SPE) also enables access to smaller sample sizes and smaller extraction solvent volumes, which would not have been possible with a traditional LLE approach. Clearly, when applying LVI, matrix interferences also are concentrated through the LVI process. In addition to improving detection limits in GC, LVI also serves to simplify the sample preparation process and provide opportunities for on-line coupling of GC with different cleanup and enrichment steps (33). With LVI, tedious solvent blow-down steps can be eliminated (while preserving the sensitivity requirements) without risking the loss of trace volatile analytes, and also EPA method-based procedures do not have to be altered significantly (34).
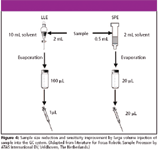
Figure 4
The performance of LVI with classical hot split–splitless injection methods is restricted largely by the capacity of the injection inlet that can contain the total sample and solvent vapors. The expansion volumes of three common solvents at injection temperature of 250 °C for three injection volumes and column head pressures are listed in Table II, which serves as a guide for matching sample injection volume to the injection inlet capacity. Excess vapors from classical hot injection techniques (20-μL injection volume of methanol produces an expansion volume of 15,840 μL at 5 psig; see Table II) exit through the septum purge line and also can back diffuse to contaminate the carrier gas supply line. Modern implementations of LVI are most commonly based upon on-column injection or programmed temperature vaporization (PTV) injection techniques. With LVI, the proportionate increment in the introduction of impurities to the chromatographic system places more stringent requirements on the purity of the solvents and chemicals used in the sample preparation step, and on ensuring maximum efficiency of the separation step to ensure adequate resolution of target analytes from coextracted volatiles. On-column injection should be the first method of choice for implementing LVI when the analyte is presented in a relatively "clean" matrix (35). Common large-volume on-column injection configurations consist of a retention gap that is installed just before the analytical column. The retention gap helps to circumvent the problem of band broadening in space (that is, liquid sample traveling a considerable distance into the analytical column before the chromatographic process begins) that occurs with the injection of large sample volumes, as well as to prevent the buildup of nonvolatile materials on the analytical column. A retaining precolumn also can be fitted between the retention gap and the analytical column to improve the recovery of analytes with boiling points near to that of the solvent. Another mode of implementing large volume on-column injection incorporates a solvent vapor exit, in addition to a retention gap and a retaining precolumn, also has been reported (36–38) and made commercially available (for example, Agilent Technologies, Palo Alto, California and Thermo Finnigan, Waltham, Massachusetts). A schematic illustration of such a setup is provided in Figure 5. The solvent vapor exit helps to accelerate solvent evaporation and to prolong the analytical column and detector life. However, for such systems, the timing in shutting the solvent exit is critical to avoid discriminatory losses of volatile analytes. The timing problem can be solved by using carrier gas flow rate to monitor the solvent evaporation process, thus, realizing the automation of the solvent vent closure (39). Overall, large-volume on-column injection provides the widest application range with respect to volatility and thermostability, together with improved precision and accuracy in the analytical results. The principles of the on-column injection technique have been discussed (32).
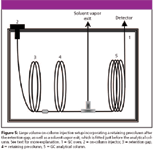
Figure 5
Despite the numerous practical incentives for direct on-column injection, its limitation to only relatively clean samples precludes its utility to the majority of analyses involving complex sample matrices. The next best option for LVI would be PTV-based injection techniques. PTV injections involve the introduction of sample into the inert support packings of a relatively "cold" temperature-controlled vaporizing inlet where the retained analytes are vaporized in succession with a predetermined temperature programmed rate. This alleviates the thermal stress on the analytes and ensures that high boiling point analytes are vaporized sufficiently to be transferred quantitatively to the analytical column. Most PTV-based LVIs require the selective elimination of the solvent through the vent before analytes are vaporized successively to the analytical column and can occur by any one of the three most common operational modes: PTV splitless, PTV solvent split, and PTV vapor overflow. These operational modes are illustrated schematically in Figure 6.
In PTV splitless mode (Figure 6a), the split vent is closed during sample introduction into the packed inlet at temperatures lower than the solvent boiling point (or close to pressure corrected solvent boiling point), while the solvent is eliminated through the analytical column before analytes are transferred to the GC column. This mainly requires an uncoated precolumn, retaining column, and analytical column with solvent vapor exit.
In PTV solvent split mode (Figure 6b), sample is injected into a packed liner at temperatures lower than the solvent boiling point. Following the (almost) complete elimination of the solvent through the split vent, the split vent is closed and vaporization of the retained analytes is initiated to transfer them to the GC column. This technique is not suited for high volatile analytes, which can be lost during the solvent elimination step. The small amount of solvent transferred to the column aids the Grob solvent effect to reduce inlet band broadening.
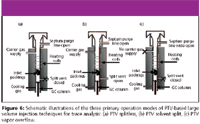
Figure 6
In the PTV vapor overflow mode (Figure 6c), sample is introduced into the inlet usually at temperatures higher than the solvent boiling point. The rapidly expanding vapor pressures in the inlet drive the solvent elimination process through the septum purge line. After the solvent elimination is complete, retained analytes on the packings are then vaporized and swept into the GC column by the resumed flow of carrier gas. This self-regulating system does not rely heavily on parameters such as solvent elimination flow rate and timing of solvent vent closure.
The PTV splitless operational mode is more suited for samples containing volatile analytes, although the slow solvent elimination rate restricts this technique to injection volumes of 20–30 μL (40). The difference between PTV solvent split and vapor overflow operational modes lies in the simplicity of the latter setup because the latter technique is more of a self-regulating system, which does not rely heavily on parameters such as solvent elimination flow rate and timing of solvent-vent closure. Volatile analytes have a higher probability of being lost during the solvent elimination step for both PTV solvent split and vapor overflow modes. Multiple injections (after the completion of each solvent elimination step) and the variation in the speed of sample introduction can be used for PTV solvent split and vapor overflow modes to attain the required volume for sufficient analytical sensitivity when the inlet capacity is not large enough to contain the sample vapors for one large volume injection (see Table II).

Table II: Expansion volumes for selected solvents that are injected at 250 °C with various column head pressures and injection volumes
Many commercial robotic sample preparation stations mentioned in the previous section can be equipped with PTV injection systems that also have the flexibility of performing classical hot split–splitless injections. A robust large volume injection method is also key to successful on-line couplings between HPLC and GC, that is, LC–GC. The on-line LC–GC system is an effective means to marry together the best attributes inherent in both techniques to further improve analytical sensitivity (41). Effective sample cleanup and preconcentration are provided by HPLC, as it possesses large sample capacity and high resolving power.
Specific fractions following HPLC separations are transferred on-line to GC for sensitive selective detection. Further improvements in LOD and sensitivity are possible with on-line setups due to minimal analyte losses arising from experimental and operator errors because on-line operations are automated fully. In addition, because all analytes in the selected LC fractions are transferred to the GC system, both accuracy and reproducibility are enhanced (42). Derivatization also is possible on-line with such LC–GC systems (43). Clearly, the benefits (with respect to enhanced sensitivity and LODs) offered by on-line LC–GC are remarkable but the actual setups do require an added degree of complexity compared with nonhyphenated techniques. It is beyond the scope of this article to discuss in detail the principles and developments in this area, although excellent reviews have been published on this topic and readers are directed to them (35,42,44–46) for further information.
Improved Chromatographic Performance
The strategies discussed in the previous sections to improve sensitivity and LODs presume that the chromatographic GC system has the ability to adequately resolve target analytes from one another and from the sample matrices. Poor chromatographic resolution obviously will negate the efforts made in sample handling and introduction. The following equation relates the fundamental factors that contribute to chromatographic resolution (Rs) and illustrates the challenges in one-dimensional (1-D) capillary GC-based methods. Manipulation of column lengths, phase ratios, elution temperatures, and pressures all can contribute toward chromatographic resolution — but the combination of these strategies is nowhere as rewarding or productive as tuning the selectivity (α), of the chromatographic system with regards to resolution of adjacent analytes.
where

- N is the number of theoretical plates;
- α is selectivity of chromatographic system toward the two analytes;
- k is the average retention factor of the two adjacent chromatographic peaks.
Selectivity tuning in 1-D chromatographic systems is largely dependent upon the availability of stationary phases and detection technologies. Perhaps the most fundamental point to this debate relates back to the chemical and physical characteristics of the analytes. Problems arising from inadequacy to resolve enantiomeric pairs require specific "chiral" solutions in the form of either chiral derivatizing agents or specific chiral stationary phases (for example, β-cyclodextrin), provided that target analytes are not obscured by an "avalanche" of matrix interferences. The probability of coelution of target analytes with matrix interferences also takes on greater significance especially when LVI strategies are to be considered.
Fortunately, multidimensional GC has evolved through the years and has proved to be an invaluable analytical tool for trace analysis in notoriously complex samples. The coupling of two columns of different stationary phases effects selectivity (α) in the separation process by subjecting some or all of the sample to two fundamentally different separation mechanisms.
In the GC–GC "heart-cutting" implementation mode for multidimensional GC, specific fractions of a 1-D chromatogram are directed from the 1-D column to the 2-D column by means of a switching device at the confluence of the two columns, for further analysis. The different selectivity of the two-dimensional (2-D) column affords enhanced resolution power to reveal trace analytes in the problematic fractions, which would otherwise be obscured by other major sample components in a conventional 1-D GC setup, without the penalty of long analysis time. Switching devices that incorporate a focusing step during the heart-cutting of analytes from the 1-D column to the 2-D column not only act as an enrichment tool for trace analysis but also reset the band broadening incurred in the 1-D column by reinjecting the "heart-cut" portions into the 2-D column as sharp bands. The Longitudinally Modulating Cryogenic System (LMCS, Chromatography Concepts, Doncaster, Australia), which has been developed in this laboratory, is one flexible device for performing several different modes of operation for use with GC–GC heartcutting (47) and comprehensive 2-D GC (GC×GC) (48,49) procedures.
GC×GC encompasses all the merits of the previous "heartcutting" setup, but yields even better performance. Instead of sampling only discrete subsections of the 1-D chromatographic profile for further separation in the "heartcutting" setup, for GC×GC, the entire sample is subjected to further analysis on the different selectivity second GC column to get the most separation and information within the 1-D GC analysis time. This generates a 2-D contour plot, which provides a set of coordinates based upon the retention times obtained from the two sequentially coupled columns. In-depth reviews on GC–GC (49,50) and GC×GC (51) have been published while schematic diagrams of multidimensional GC and GC×GC instrumentation are shown in Figure 7.

Figure 7
Focusing devices in multidimensional GC instrumentation contribute significantly to the sensitivity (signal-to-noise ratio [S/N]) enhancement for trace analysis (52). It is possible to establish a general relation between sensitivity as an inverse function of peak dispersion (peak width), which is also an accurate measure of GC performance. The relation is depicted in the following equation:
Sensitivity ∝ 1/σ
By way of example, solely on the basis of peak width, a normal 1-D GC peak of 6 s peak width when compared to a narrow 2-D GC peak (acquired by GC×GC) of 200-ms peak width, indicates an approximate sensitivity increase of 30-fold. Typical GC×GC operations are acquired at high data-acquisition rates of at least 50 Hz as opposed to that of 1-D GC operations of about 2 Hz, as dictated by the narrowness of the peak width in each operation. Because detector noise is directly proportional to the square root of the detector data acquisition rate, the sensitivity enhancement when comparing 1-D GC and GC×GC operations also must be moderated for the different S/N responses that are acquired when each is operated under optimum detector sensitivity conditions (53). Assuming that flame ionization detection (FID) is used for both 1-D GC and GC×GC operations, the detector noise enhancement of 50 Hz versus 2 Hz is approximately five times greater (53). Hence, the corrected sensitivity gain, after taking into account the detector noise factor, is still an impressive sixfold increment in sensitivity under nonoverloaded (54) conditions in 1-D and 2-D column. The previous sensitivity increment for GC×GC is modest, having not yet taken into account the reduction in peak area measurement error that results from peak focusing at the junction of the two columns. Of course, removal of underlying interferences, and generation of more pure peaks, should produce a better baseline signal that is itself advantageous to GC×GC data.
Similar peak-focusing accessories, analogous to that mentioned previously, also have been commercialized, one of which is the AirSharp trap by SGE International. This device uses air as the coolant to focus peaks just before they enter the detector. Its utility is limited, however, to only high-boiling, late-eluted compounds in 1-D GC, such as organohalogen pesticides, as dictated by the coolant source. It is noteworthy that the LMCS also is capable of the same task for focusing both low (≤70 °C) and high-boiling, late-eluted compounds in the entire chromatographic run by installing the cryogenic trap just before the detector. A short piece of uncoated fused-silica column that bridges the cryogenic trap to the detector also can be used to boost sensitivity and detectability by accelerating the focused peaks to the detector (thereby further minimizing peak dispersion).
Alternative (Selective–Sensitive) Detection Transducers
The detector is the sensing device or the transducer that converts a chemical compound into a measurable electrical signal. Obviously, the detector is responsible for producing the response, and so directly gives the sensitivity that we see. A particular detector type might, however, be relatively inconsequential in improving detectability of a compound — once it is set at optimum, then no further improvement will arise. Better detection sensitivity must therefore be sought by choice of a detector design with a more favorable S/N performance.
Technical improvements in detectors can be slow, however, although detectors suited to capillary flows, through minimized detection volumes, often give significantly better results. Thus, the micro-electron capture detector has a better response than a conventional electron capture detector.
Unlike some of the strategies discussed in the previous sections, the selection of a detector based solely upon the merit of its sensitivity is rarely put into practice. Other factors to consider include specificity–selectivity, detector speed, costs, and mandatory legal requirements that can be unique to a specific analytical application. The simplest general classification of GC detectors into mass spectrometric (MS) and non-MS types illustrates the differences and diversity of the theories behind detector designs. GC coupled to MS detection plays a key role in today's analytical laboratories, enduring two decades of technological revolution. Analytically, full-scan electron ionization (EI) GC–MS mode at 70 eV finds one of its greatest uses for systematic toxicological analyses in forensic and clinical toxicology, which involves the detection of all substances of toxicological relevance.
Selected ion monitoring (SIM) mode in (EI) GC–MS can be as much as 100 times more sensitive (but lower specificity) than full-scan (EI) GC–MS mode for non–ion trap GC–MS systems, depending upon the number of ions that are selected for monitoring in SIM. Greater sensitivity in MS detection also can be achieved with softer ionization modes and tandem MS techniques such as with chemical ionization (CI) and MS–MS, respectively, or both. For trace analytes containing electronegative entities in their molecules, sensitivity enhancements of as much as several thousand times can be obtained by negative ion chemical ionization (NICI) GC–MS compared with full-scan (EI) GC–MS. Results from (CI) GC–MS and from (EI) GC–MS are often complementary, to give greater certainty to detection and identification in the trace analysis. The recent development of inert ion sources also promises enhanced sensitivity for the analysis of active analytes, with an example being that of the HP59735 MSD instrument (Agilent).
The sensitivity of non-MS detectors is largely dependent upon the detector response mechanism and experimental conditions, and so optimum operation of detectors is important. For nitrogen–phosphorus detection (NPD), the variation of detector flow rate and detector output frequency can have profound effects on the detector performance. Ryan and Marriott (55) observed sensitivity gain of 36% just by increasing the bead voltage by 20 units. The enhanced selectivity offered by detection methods such as electron capture detection (ECD) and NPD for the chemically relevant analytes frequently is accompanied by enhanced sensitivity in their detection when compared with the universal FID, and are therefore valuable detection methods for trace analysis. Where the problem of coelution cannot be solved by improved chromatographic resolution in single column analysis of complex samples, the selectivity and specificity of non-MS and MS detectors can be exploited in the form of a (simultaneous) dual detector system to significantly improve S/N and detectability. The combination of NPD and MS to provide resolution of the trace drug analytes from the matrix interferences in the detection domain (rather than in the chromatographic domain) has been reported in forensic toxicology. Other dual detector systems also include ECD–NPD and ECD–MS, which have been reported for drugs (56) and pesticides (57) analyses, respectively.

Table III: Comparison of various GC techniques using information theory
The role of MS in providing improved information power recently has been considered in the area of drug analysis (58). A comparison of selected GC- and MS-related techniques is provided in Table III. Information theory suggests that GC provides approximately 550 "bits" of information (resolving elements) whereas capillary EI–GC–MS has 6.6 × 106 bits. Capillary GC–MS-MS, on the other hand, provides a staggering 6.6 × 109 bits. Based upon the same information theory approach, the information power of GC×GC coupled with non-MS detection can be calculated as 1.1 × 10⁴ , using the estimated resolving power of each GC column in an orthogonal GC×GC configuration that employs a long capillary column as 1-D (for example, 30 m × 0.25 mm i.d. × 0.25 μm df) and a short narrow-bore capillary column (for example, 1 m × 0.1 mm i.d. × 0.1 μm df) as 2-D.
This simplistic calculation does not acknowledge the structured retention patterns that arise from GC×GC analysis, which provide further valuable compound class information in for example, complex petroleum samples, and so the information power of GC×GC (1.1 × 104 bits) appears somewhat diminished compared with capillary EI–GC–MS (6.6 × 10⁶ ). Providing MS detection to GC×GC separation yields about 108 bits of information. As the trend moves toward ultratrace analysis, the specificity of MS detection in combination with maximum possible chromatographic performance to provide both best sensitivity and selectivity makes for a robust, interference-free analysis. Discussion on MS detectors also should distinguish between unit mass resolution, accurate mass instruments, and MS–MS operation when evaluating their informing power. Although the informing power of EI–GC×GC–MS is approximately 20 times greater than that of EI–GC–MS, the former technique still lags behind the power of the GC–MS-MS technique. As the placement of GC–MS equipment became widespread and electronic mass spectral databases became readily available, the role of retention time data in assisting compound identification today appears to have diminished in significance (59). The use of EI–GC×GC–MS to enhance sensitivity (by peak focusing), mass spectral purity (enhanced separation to remove background interferents), and specificity in compound retention (an additional retention time on 2-D) should lead to much greater certainty in compound identification. The superficial "informing power" model should not be used to prematurely dismiss a new analytical technique such as GC×GC–time-of-flight MS for drug analysis (60), when measured against GC–MS-MS, without rigorous experimental evaluation.
Conclusion
Solutions for sensitivity enhancements and lower LODs in GC abound with possibilities. Each part of the analytical method needs to be addressed, making use of appropriate technologies, if the best analytical result is to be achieved. Thus, strategies from sampling, sample preparation and handling, introduction, and the instrumental analysis procedure play their part in producing the overall result. Trace multiresidue analysis is the ultimate test for the total procedure. While cost (for example, capital investment, skilled labor, and so forth) is invariably the deciding factor for many laboratories, this review is not limited to expensive hardware investments but also includes easy and affordable recommendations and ideas. Future innovations in GC will be aimed at speed, flexibility and convenience, in addition to improvements in sensitivity and LODs.
References
(1) P. Kintz and N. Samyn, in Handbook of Analytical Separations, M.J Bogusz, Ed. (Elsevier Science, Amsterdam, 2000), pp. 459–488.
(2) P. Kintz and N. Samyn, Ther. Drug Monit. 24, 239–246 (2002).
(3) O.H. Drummer and J. Gerostamoulos, Ther. Drug Monit. 24, 2002 (2002).
(4) Http://www.iupac.org/goldbook/S05606.pdf (1 Dec 2004).
(5) J. Tyson, Analysis: What Analytical Chemists Do (The Royal Society of Chemistry, London, 1988).
(6) J.C. Miller and J.N. Miller, Statistics for Analytical Chemistry (Ellis Horwood Ltd., New York, 3rd ed., 1993).
(7) J. Segura, R. Ventura, and C. Jurado, J. Chromatogr. B 713, 61–90 (1998).
(8) H.M. McNair and J.M. Miller, Basic Gas Chromatography (John Wiley & Sons, Inc., New York, 1st ed., 1998).
(9) B.A. Rashid, P. Kawasowski, and D. Stevenson, J. Pharm. Biomed. Anal. 21, 635–639 (1999).
(10) B.A. Rashid, G.W. Aherne, M.H. Katmeh, P. Kwasowski, and D. Stevenson, J. Chromatogr. A 797, 245–250 (1998).
(11) J. Beike, H. Kohler, B. Brinkmann, and G. Blaschke. J. Chromatogr. B 726, 111–119 (1999).
(12) H.D. Yuan, W.M. Mullett, and J. Pawliszyn, Analyst 126, 1456–1461 (2001).
(13) N. Delaunay, V. Pichon, and M-C. Hennion, J. Chromatogr. B 745, 15–37 (2000).
(14) D. Stevenson, J. Chromatogr. B 745, 39–48 (2000).
(15) C. Berggren, S. Bayoudh, D. Sherrington, and K. Ensing, J. Chromatogr. A 889, 105–110 (2000).
(16) P. Martin, I.D. Wilson, and G.R. Jones, J. Chromatogr. A 889, 143–147 (2000).
(17) W.M. Mullett, P. Martin, and J. Pawliszyn, Anal. Chem. 73, 2383–2389 (2001).
(18) M.T. Muldoon and L.H. Stanker, Anal. Chem. 69, 803–808 (1997).
(19) R.E. Majors, LCGC Eur. 17, 333–346 (2004).
(20) R.E. Majors, LCGC 22, 1062–1072 (2004).
(21) J. Scheurer and C.M. Moore. J. Anal. Toxicol. 16, 264–269 (1992).
(22) C.L. Arthur and J. Pawliszyn, Anal. Chem. 62, 2145 (1990).
(23) M. Yashiki, T. Kojima, T. Miyazaki, N. Nagasawa, Y. Iwasaki, and K. Hara, Forensic Sci. Int. 76, 169–177 (1995).
(24) E. Baltussen, P. Sandra, F. David, and C. Cramers, J. Microcol. Sep. 11, 737–747 (1999).
(25) S. Pedersen-Bjergaard, T.S. Ho, and K.E. Rasmussen, J. Sep. Sci. 25, 141–146 (2002).
(26) H.G. Ugland, M. Krogh, and L. Reubsaet, J. Chromatogr. B 798, 127–135 (2003).
(27) C. Basheer, H.K. Lee, and J.P. Obbard, J. Chromatogr. A 1022, 161–169 (2004).
(28) M.A. Jeannott and F.F. Cantwell, Anal. Chem. 68, 2236–2240 (1996).
(29) M. Ma and F.F. Cantwell, Anal. Chem. 71, 388–393 (1999).
(30) B. Buszewski and T. Ligor, LCGC Europe 15(2), 92–97 (2003).
(31) D.C. Wood, J.M. Miller, and I. Christ, LCGC Europe 17, 573–579 (2004).
(32) K. Grob, On-Column Injection in Capillary Gas Chromatography (Dr. Alfred Huethig GmbH, Heidelberg, 1987), p. 363.
(33) J. Teske and W. Engewald, Trends Anal. Chem. 21, 584–593 (2002).
(34) F.M. Norlock, J.-K. Jang, Q. Zou, T.M. Schoonover, and A. Li, J. Air & Waste Manage. Assoc. 52, 19–26 (2002).
(35) K. Grob and M. Biedermann, J. Chromatogr. A 750, 11–23 (1996).
(36) C. Bicchi, A. D'Amato, I. Semararo, A. Galli, and M. Galli, J. High Resol.Chromatogr. 15, 155 (1992).
(37) J.F. Hiller, T. McCabe, and P.L. Morabito, J. High Resol. Chromatogr. 16, 5–12 (1993).
(38) J.C. Bosboom, H.-G. Janssen, H.G.J. Mol, and C.A. Cramers, J. Chromatogr. A 724, 384–391 (1996).
(39) T. Hankemeier, S.J. Kok, R.J.J. Vreuls, and U.A.Th. Brinkman, J. Chromatogr. A 811, 105–116 (1998).
(40) K. Grob and Z. Li, J. High Resol. Chromatogr. & Chromatogr. Comm. 11, 626–632 (1988).
(41) T. Hyötyläinen and M.-L. Riekkola, Chem. Australia, 12–14 (1999).
(42) K. Grob, J. Chromatogr. A 892, 407–420 (2000).
(43) T. Hyötyläinen, H. Keski-Hynnilä, and M.-L. Riekkola, J. Chromatogr. A 771, 360–365 (1997).
(44) T. Hyötyläinen and M.-L. Riekkola, J. Chromatogr. A 1000, 357–384 (2003).
(45) H.G.J. Mol, H.-G.M. Janssen, C.A. Cramers, R.J.J. Vreuls, and U.A.Th. Brinkman, J. Chromatogr. A 703, 277–307 (1995).
(46) K. Grob. J. Chromatogr. A 703, 265–276 (1995).
(47) M. Dunn, R. Shellie, P. Morrison, and P. Marriott, J. Chromatogr. A 1056, 163–169 (2004).
(48) P.J. Marriott and R.M. Kinghorn, J. Chromatogr. A 866, 203–212 (2000).
(49) P.J. Marriott, P.D. Morrison, R.A. Shellie, M.S. Dunn, E. Sari, and D. Ryan, LCGC Europe, 16(12A) 23–31 (2003).
(50) K. MacNamara, R. Leardi, and A. Hoffman, LCGC Europe, 16(12A) 14–22 (2003).
(51) J. Dallüge, J. Beens, and U.A.Th. Brinkman, J. Chromatogr. A 1000, 69–108 (2003).
(52) J. ?evcík J. Chromatogr. 186, 129–144 (1979).
(53) A.L. Lee, K.D. Bartle, and A.C. Lewis, Anal. Chem. 73, 1330–1335 (2001).
(54) L.M. Blumberg, J. Chromatogr. A 985, 29–38 (2003).
(55) D. Ryan and P. Marriott. In Press; DOI: 10.1002/jssc.200400033
(56) P. Lillsunde and T. Seppala, J. Chromatogr. 533, 97–110 (1990).
(57) K. Takahashi, Y. Tanaka, S. Hosoi, T. Hidaka, and S. Usui, J. Food Hygienic Soc. Jap. 43, 127–132 (2002).
(58) D.A. Kidwell and L.A. Riggs, Forensic Sci. Int. 145, 85–96 (2004).
(59) W.P. Eckel, American Lab. Mar., 17–20 (2000).
(60) S.M. Song, P. Marriott, A. Kotsos, O.H. Drummer, and P. Wynne, Forensic Sci. Int. 143, 87–101 (2004).
(61) D.D. Fetterolf and R.A. Yost, Int. J. Mass Spec. Ion Proc. 62, 33–49 (1984).
(62) W. Vogt, K. Jacob, A.-B. Ohnesorge, and H.W. Obwexer., J. Chromatogr. 186, 197–205 (1979).
Removing Double-Stranded RNA Impurities Using Chromatography
April 8th 2025Researchers from Agency for Science, Technology and Research in Singapore recently published a review article exploring how chromatography can be used to remove double-stranded RNA impurities during mRNA therapeutics production.


