Advances in the Ageing Chemistry of Distilled Spirits Matured in Oak Barrels
LCGC Europe
Describing developments in LC–MS and GC–MS that reveal the ageing chemistry of whiskey aged in oak barrels.
Elucidation of the ageing chemistry of whiskey aged in oak barrels is important for an understanding of the final aroma and taste. Both volatile and non-volatile species comprise the additional compounds produced during maturation and their analysis requires the complimentary techniques of gas chromatography mass spectrometry (GC–MS) and liquid chromatography mass spectrometry (LC–MS). The recently introduced technology of GC large volume injection (LVI) with solvent venting is used for direct injection of samples without extensive sample pre-treatment. Data deconvolution of the resulting total ion chromatogram (TIC) allows rapid isolation of targets from other co-eluting — mainly fermentation — compounds. LC–MS then reveals additional subtle differences in compound profiles in whiskey matured in oak barrels from different wood species. Ion trap (IT) and time-of-flight (TOF) mass spectrometry (MS) techniques can than be used to give structural information and empirical formula determination on these relatively unknown species. A final important tool is use of an LC active splitter preparative system, where the specific MS signal of a compound is the trigger for isolation and collection. In this way unknown compounds can be collected in high purity for both further spectroscopic analysis and sensory evaluation.
Introduction
For a premium commercial spirit, such as whiskey, wood ageing or maturation in oak barrels for extended periods is essential to give it the unique taste that consumers like.The various processing stages of barley brewing, fermentation and distillation all contribute a unique sub-set of flavours to the spirit, but it is clear that the final long ageing step in oak barrels has a significant influence on the final distinctive aroma and taste. During maturation the flavour compound changes that contribute to taste (1,2) can be subdivided into four areas:
- The extraction of wood compounds
- The reaction of wood and wood compounds with components of the unaged distillate, including the dominant component: ethanol
- Reactions involving only wood extractives
- The evaporation of volatile compounds.
The processes involved and the final outcome are made more complex by additional variables, including the pre-treatment of the barrel when new, the type and origin of the wood used, and whether the barrel has been previously used in a maturation cycle (3)
Pre-treatment of the barrel involves heating the inside of the cask and may vary from an intense charring over a fire to more gentle toasting with hot air. The intensity of heating will affect the type and levels of compounds produced from the degradation of wood lignin and macromolecules. In addition to heat pre-treatment an additional mechanism that contributes to flavour involves the production of a complex from wood lignin and ethanol in which ethanol acts as a solvent and a reactant.
The mild acidic hydrolysis of this complex produces simple aromatic phenolic compounds. The majority of published work in this area to date has concentrated on elucidating the mechanisms involved in this degradation of wood to give simpler flavour molecules. An examination of the literature indicates many studies on the development, determination, structural elucidation and sensory properties of oak wood ellagitannins, a large group of polyphenolic compounds widely distributed in plants (4,5). The usual practice is to chemically extract these ellagitannins directly from the corresponding heartwood of the oak species that has initially been converted into oak chip or sawdust form. Interesting results are presented but practically no linkage is established between the species identified and their possible presence in spirits that have undergone a "natural" maturation cycle. Methanol–water extracts of oak wood chips, and wine and spirit samples actually aged with oak chips have also been used to analyse and determine low-molecular-weight phenolic compounds (6,7). Again, the problem is that this much shorter, forced ageing with a hugely increased wood-to-spirit surface exposure cannot replicate the intricate complexity and result of a natural ageing cycle.
In this article we concentrate entirely on the comparative analysis of the actual pot distillate at various intervals of barrel maturation extending to 20 years in both new Quercus alba (American) and Quercus robur (European) wood. Six of each of these barrels were made to identical dimensions of 500 litres volume, were lightly toasted on the inside and had no additional treatments or seasoning to uniquely allow the wood effect to be expressed in the subsequent analyses.
Figure 1 visually compares the unaged spirit (parent) before cask filling with the equivalent at 20 years from the two wood species and clearly illustrates the remarkable influence of the wood. Needless to say the sensory properties of the two aged samples in terms of both aroma and taste are also dramatically different. Gas chromatography–mass spectrometry (GC–MS) and liquid chromatography–mass spectrometry (LC–MS) analysis were performed. GC–MS was specifically used to investigate compounds associated with wood toasting and lignin breakdown. In our opinion comparative analysis of those compounds, mainly of fermentation origin, originally present in the unaged distillate, provides only limited information in the context of changes induced by maturation.
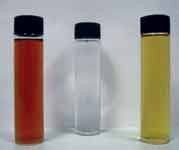
Figure 1: Visual changes in unaged parent whiskey (centre) after 20 years in new Quercus robur (left) and Quercus alba oak barrels.
Direct large volume injection (LVI) of actual spirit samples with solvent venting of the ethanol–water matrix was used for GC–MS analysis. This injection technology removes the need for extensive sample preparation and concentration, and offers a boiling point recovery of target analytes when correctly optimized. Less volatile compounds were analysed by different LC–MS techniques using atmospheric pressure chemical ionization (APCI) in the negative mode. Ion trap mass spectrometry (IT-MS–MS) was used for structural information and the accurate mass time-of-flight (TOF) technique was used to determine the compound empirical formula.
LVI-GC–MS
The most widely applied LVI technique uses a PTV (programmable temperature vaporization) inlet in solvent vent mode and important parameters are the PTV temperature, the carrier gas venting flow and the sample introduction rate. If the solvent is not removed at the same time as a vapour as it enters the injector liner, then analytes will simply be removed with liquid solvent through the split line. The goal is to recover and retain the maximum amount of analytes from the solvent for subsequent splitless transfer to the column.
Research groups in Germany and Holland have pioneered research into the fundamentals of this technique and have explained the interactions between the variables involved (8–10). In the case of distilled spirits the "solvent" will be the natural ethanol-water matrix of the sample and while the maximum rate of injection for a particular solvent can be theoretically calculated from the solvent vapour pressure, split gas venting flow and the PTV temperature, an additional reduction of this maximum is necessary when water is present. This is because the high latent heat of vaporization of water induces an additional cooling effect in the liner, and the venting gas flow will have a lower than theoretical saturation with water vapour.
For the results described in this article 100 µL of spirit samples were successfully injected with 60% water at a PTV temperature of 40 °C, a solvent vent gas flow of 500 mL/min and an injection rate of 12 µL/min. This latter parameter is critical because doubling the injection speed results in more than 80% of the analyte being lost compared with the optimum injection rate of 12 µL/min. Under optimum conditions recovery data for 100 µL injections of a compound test mix compared with standard 1 µL injections of prorata concentrated solutions show more than 90% recovery of analytes and good area reproducibility vis-à-vis added internal standards (ISs). Proper column choice is also important and we use an apolar CP-Sil 5 CB (Agilent Technologies, Santa Clara, California, USA) with dimensions 25 m × 0.15 mm i.d. × 2.0 µm df.
Injection of 100 µL will also transfer substantial amounts of non-target ester and acid analytes to the column and the thick film with phase ratio β = 19 provides the high capacity needed for retention of good analyte peak shape. The large injections were performed on disposable 2 mm i.d. plain glass liners packed with glass wool. This is useful as more frequent liner changes are obviously necessary. Unattended sequences can be accommodated by using an automated liner exchange module (Gerstel, Mülheim an der Ruhr, Germany).
A recent publication (11) describes a 5–10 µL solvent injection on an acidic wax column of distilled spirits for major fermentation esters and acids and a limited number of minor compounds associated with cereal raw material preparation and wood ageing. The present work is an extension of this successful approach, but introducing much larger volumes requiring injection speed programming and using a high temperature apolar phase for elution of less volatile analytes. Finally, because the mass spectra of target analytes will be known, expected fragment ion ratios can be used by deconvolution software (Ion Signature Technology, North Smithfield, Rhode Island, USA) to return a reconstructed ion chromatogram (RIC) of target analytes only, from the generic TIC. In this way a useful synergy is achieved with LVI simplifying the first rate limiting step of sample preparation and deconvolution the second rate limiting step of data reduction.
Table 1 describes the target compound data base for deconvolution of these compounds from the standard total ion chromatogram (TIC). This database is first established, either from the spectral data of expected compounds (vanillin, etc), literature data on monomeric lignin-derived products after thermal degradation of wood (12,13), or similar compounds after pyrolysis GC–MS of plant and lignin materials (14,15). Lignins may be pyrolyzed reproducibly to produce a mixture of relatively simple phenols resulting from cleavage of ether and certain C-C linkages. Other sources for identification of candidate target compounds are LC–GC–MS and GC–GC–MS (16). Deconvolution processes the scan data file looking for the expected relative abundances (Table 1) associated with each target and provides a list of compounds found and their relative concentrations. This process is more comprehensive than selected ion monitoring (SIM) because the software identifies and discards contributions to the spectra that have not originated from the target compounds.

Table 1: Database for target compound GCâMS deconvolution after large volume injection with solvent venting.
Figure 2 shows an overlay of the TIC and associated target RIC for a 100 µL injection of a composite 20-year-old sample from the Quercus robur casks, and demonstrates the ability of this procedure to extract a more meaningful pattern from the standard TIC.
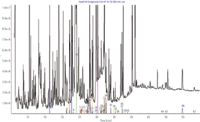
Figure 2: Overlay of a GC total ion chromatogram (TIC) and corresponding target compound reconstructed ion chromatogram (RIC) after 100 µL injection of aged whiskey.
Figure 3 shows a comparison of the target RIC's for the 20 year old Quercus robur- and Quercus alba-matured samples. Additional complexity is apparent for the Quercus robur sample, but this mainly reflects an increased response for many of the same target compounds. This type of rapid profiling can be very useful for cask quality assessment and will also in authenticity verification. We will now look at how LC–MS technology applied to the less volatile compounds reveals unique and interesting differences between these samples.
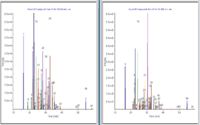
Figure 3: Comparison of GC RIC traces for 100 µL injections of aged whiskey from Quercus robur (left) and Quercus alba oak barrels.
HPLC–MS
In contrast to GC–based studies, relatively few publications feature HPLC–MS or the characterization of important oak wood compounds in aged distilled spirits (17). The principal application has been high performance liquid chromatography with diode array detection (HPLC–DAD) to quantify vanillin-type phenolic aldehyde structures, as well as their associated acids and coumaric acid side chain derivatives (18). Where LC–MS has been used the main ionization mode has been electrospray ionization (ESI), which requires care to avoid problems of ionization suppression and adduct formation. In this study atmospheric pressure chemical ionization (APCI) in the negative mode was used because this provides highly selective detection for compounds with an acidic ionizable phenolic hydroxyl group. Mass spectra show almost no fragmentation and predominantly give the [M—H]– ion after proton abstraction with much reduced chromatographic background compared with electrospray mode. APCI and electrospray are relatively weak ionization techniques and therefore the molecular ion [M–H] is usually dominant in the mass spectra of compounds. This facilitates the use of extracted ion chromatograms (EIC) of the molecular ion for quantification. Good separation was achieved on a 250 × 4.6 mm Zorbax SP-Phenyl column (Agilent Technologies) in reversed phase (RP) mode using 5 mM formic acid and methanol as eluents.
Figure 4 shows the comparison of the TIC–MS chromatograms obtained during the analysis of aged Quercus robur and Quercus alba samples and also the UV trace (λ = 290 nm) for an aged Quercus robur sample. Compounds in the region up to 35 min are the welldocumented vanillin-type structures and are detected in both MS and UV modes. More apolar later eluting species, with typical molecular weights from 400–700 Da, are only amenable to MS detection. The TIC–MS chromatograms of whiskey from both woods at the same age shows that, for the earlier eluting phenolic aldehydes and acids, the concentrations are generally higher from Quercus robur compared with Quercus alba. Later eluting compounds with higher molecular masses show substantial interwood concentration differences with significantly higher concentrations from Quercus robur wood.
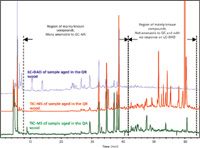
Figure 4: Comparison of TICâMS APCI negative traces for aged whiskey from Quercus robur and Quercus alba oak barrels with the corresponding LCâUV trace for aged whiskey from Quercus robur barrels.
Ion Trap MS and Time-of-Flight MS
The previous section has shown how a single mass analysis in APCI negative mode is well suited for method development, basic characterization of the sample composition and quantification of interesting compounds. However, more advanced MS techniques such as Ion trap (IT) and time-of-flight (TOF) offer the possibility of obtaining structural information of interesting compounds. Mass spectral databases for LC–MS techniques are generally not available and therefore structure determination of unknown compounds needs to be performed by complex experiments which involve all available LC–MS techniques.

Table 2: Fragmentation and exact mass data on interesting low volatility compounds after LCâIon Trap and LCâTOF.
Table 2 summarizes all LC–MS data on most of the compounds detected in whiskey from both wood species. With ion trap, up to MS6 fragmentations were performed to reveal interesting substructures of compounds. The masses of these fragments are listed in Table 2. Without changing the chromatography exact mass information was obtained from TOF measurements on the molecular ion [M—H]. Partial overlap of the signals as well as varying concentration can influence the accuracy of the mass determination. Therefore, the exact masses and calculated formulas were recorded only for those non-overlapping main compounds present at fairly high concentration. These are listed in Table 2.
The use of these techniques can be illustrated by considering the fragmentation of compound 12 (Table 2), m/z = 419, identified as lyoniresinol, and the earlier eluting compound 11, m/z = 581, identified as glucolyoniresinol. Lyoniresinol (19) with its typical phenolic aldehyde structure has four methoxy groups resulting in the expected sequential losses of m/z = 15 fragments and MSn spectral fragments with m/z = 404, 389, 374 and 359. Figure 5 shows the parent lyoniresinol structure and its MS, MS2 and MS3 spectra together with the corresponding fragmentation patterns for glucolyoniresinol. In general, compounds which are formed by the addition or condensation of smaller molecules to lyoniresinol should show similar fragmentation and in this respect it can be seen that the MS3 and MS4 spectra respectively of glucolyoniresinol are identical with the MS2 and MS3 spectra of lyoniresinol. Compound 11 is a derivative of lyoniresinol and is also significantly more polar. The most probable formula obtained from the TOF measurement and proposed chemical structure of glucolyoniresinol is presented in Table 2. The reaction of phenolic compounds with glucose in plants has been extensively described in the literature (20), an additional new example is compound 5 in Table 2, identified as glucogallic acid. An analogous relationship can be established between compound 25 (m/z = 679) and compound 31 (m/z = 517). Compound 25 forms a fragment m/z = 517 and the MS3 pattern is identical the MS2 pattern of compound 31. Compound 25 is again a glucoside of compound 31. Additionally, compound 31 has isomers with significantly lower concentrations and among these compound 28 is the isomer with the highest relative concentration and identical fragmentation to compound 31.
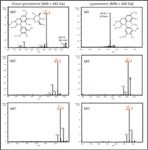
Figure 5: Comparison of Ion Trap LCâMSâMS fragmentation of Lyoniresinol and Glucolyoniresinol.
Preparative Isolation of Unknowns
Fragmentation pattern and exact mass experiments can give information on structural details and the possible formula mass of a compound, but for the final determination of the compound chemical structure it may be necessary to isolate the compound for further spectroscopic examination.
Compound isolation also provides pure material for sensory examination and spiking at various levels into spirits at various stages of wood maturation. Previous data has shown that the ultra-violet (UV) response of new unknown high molecular compounds is very low and therefore we use preparative LC–MS for the isolation of compounds. This system is outlined in Figure 6 and is based on the "active splitter" principle where the MS signal for the target compound is used to divert the compound to the fraction collector. The fractions were cut with the MS in selected ion mode and using the typical APCI negative m/z of the target. Progress so far has provided the following three main compounds at high purity: Compound 12 (m/z = 419), compound 31 (m/z = 517) and compound 32 (m/z = 501) at the milligramme level. Purified samples will be further investigated for structure determination by 1 H and 13 C NMR.
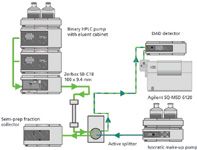
Figure 6: LCâMS configuration for preparative isolation of compounds.
Conclusions
Various novel GC–MS and LC–MS techniques have been used to investigate quite obvious visual and sensory differences in whiskey matured in oak barrels made from different wood species. Substantial information can be obtained by using approaches that allow direct analysis of samples without extensive sample preparation. In GC–MS this is achieved by on-line concentration in the inlet by LVI with solvent venting of the dominant ethanol-water fraction followed by target compound deconvolution, and in LC–MS by using atmospheric pressure chemical ionization (APCI) as a selective detection mechanism for the compounds of interest. LC–IT-MS provides molecular fragmentation information to assist in structure determination and LC–TOFMS provides exact mass information for empirical formula determination.
Kevin MacNamara, PhD, is Head of Technical Development at Irish Distillers, an important subsidiary of Groupe Pernod Ricard. He has published extensively on modern GC sample introduction techniques applied to distilled spirits, where much larger volumes than standard can be introduced with matrix removal incorporated into the injection procedure. He represents Ireland on the Technical Committee of CEPS, the European Spirits Producers Association.
Dagmara Dabrowska, PhD, is a Senior Scientist at Irish Distillers, Pernod Ricard, and has experience in state-of-the-art separation science and chromatographic techniques. She previously worked in the environmental and pharmaceutical sectors with a specialty in LC–MS and LC–TOF-MS techniques. Her main focus is on the methods development, validation and compound identification.
Norbert Helle, PhD, is the owner and general manager of TeLA GmbH, a contract laboratory in the field of Food Safety Analysis. Norbert Helle has more than 15 years experience working in food safety and environmental analysis for various German Federal and State agencies, mainly in the field of HPLC–MS. He chairs two working groups under the German § 64 Foodstuffs and Commodities Act charged with developing food safety analysis methods for phycotoxins and biogenic amines.
Meike Baden is the Head of Research and Development at TeLA GmbH, including method development on HPLC–MS, HPLC–MS–MS and ICP–MS instruments for the determination of residues of pesticides, biotoxins and drugs. She oversees various national research projects on preparative and analytical HPLC–MS and HPLC–MS–MS work in the area of food safety. Meike Baden is a member of a working group under the German § 64 Foodstuffs and Commodities Act charged with developing food safety analysis methods for phytotoxins.
References
1. K. Nishimura and R. Matsuyama, The Science and Technology of Whiskies, J. Piggot, R. Sharp, R. Duncan (Eds), Longman, London, 235 (1989).
2. K. Nishimura et al., Flavour of Distilled Beverages, J. Piggot (Ed), Ellis Horwood, Chichester, UK, 241 (1983).
3. J.R. Mosedale and J.-L. Puech, Trends in Food Science and Technology, 9, 95 (1998).
4. P. Chatonnet and D. Dubourdieu, Am. J. Enol. Vitic., 49(1) (1998).
5. A. Glabasnia and T. Hofmann, J. Agric. Food Chem., 54, 3380 (2006).
6. B. Fernández de Simán et al., J. Agric. Food Chem., 44, 1507 (1996).
7. M. del Alamo Sanza et al., Anal. Chim. Acta, 513, 229 (2004).
8. W. Engewald, J. Teske and J. Efer, J. Chromatogr. A, 842, 143 (1999).
9. H. Mol et al., Trends in Analytical Chemistry, 15(4) (1996).
10. E. Hoh and K. Mastovska, J. Chromatogr. A, 1186, 2 (2008).
11. K. MacNamara, M. Lee and A. Robbat Jr., J. Chromatogr. A, 1217 136–142 (2009).
12. R. Flamini et al., J. Mass Spectrom., 42, 641 (2007).
13. O. Faix, D. Meier and I. Fortmann, Holz als Roh- und Werkstoff, 48 281 (1990).
14. J.C. del Río et al., J. Anal. Appl. Pyrolysis, 74, 110 (2005).
15. J Ralph and R.D. Hatfield, J. Agric. Food Chem., 39, 1426 (1991).
16. K. MacNamara et al., S. Afr. J. Enol. Vitic., 22(2) (2001).
17. S. Canas et al., Ciencia Tec. Vitiv., 15(2), 75–94 (2000).
18. P. Lehtonen, Proceedings of the Alko Symposium on Flavour Research of Alcoholic Beverages, Helsinki, 121–130 (1984).
19. K. Koga et al., J. Food Sci., 72, 212–217 (2007).
20. J.B. Pridham and M.J. Saltmarsh, Biochem. J., 87, 218–224 (1963).

New TRC Facility Accelerates Innovation and Delivery
April 25th 2025We’ve expanded our capabilities with a state-of-the-art, 200,000 sq ft TRC facility in Toronto, completed in 2024 and staffed by over 100 PhD- and MSc-level scientists. This investment enables the development of more innovative compounds, a broader catalogue and custom offering, and streamlined operations for faster delivery. • Our extensive range of over 100,000 high-quality research chemicals—including APIs, metabolites, and impurities in both native and stable isotope-labelled forms—provides essential tools for uncovering molecular disease mechanisms and exploring new opportunities for therapeutic intervention.
New Guide: Characterising Impurity Standards – What Defines “Good Enough?”
April 25th 2025Impurity reference standards (IRSs) are essential for accurately identifying and quantifying impurities in pharmaceutical development and manufacturing. Yet, with limited regulatory guidance on how much characterisation is truly required for different applications, selecting the right standard can be challenging. To help, LGC has developed a new interactive multimedia guide, packed with expert insights to support your decision-making and give you greater confidence when choosing the right IRS for your specific needs.

.png&w=3840&q=75)

.png&w=3840&q=75)


.png&w=3840&q=75)


.png&w=3840&q=75)


