Addressing PFAS Challenges with Modern High Resolution IMS-MS Methods
This article explores the integration of high-resolution ion mobility spectrometry–mass spectrometry (HRIMS-MS) with liquid chromatography (LC) and quadrupole time-of-flight mass spectrometry (QTOF-MS) as a comprehensive workflow for PFAS analysis.
The detection and characterization of per- and polyfluoroalkyl substances (PFAS) remain a significant analytical challenge because of their structural complexity and isomeric diversity. Traditional one-dimensional chromatographic techniques often fail to achieve sufficient separation, necessitating the adoption of multidimensional approaches. This article explores the integration of high-resolution ion mobility spectrometry–mass spectrometry (HRIMS-MS) with liquid chromatography (LC) and quadrupole time-of-flight mass spectrometry (QTOF-MS) as a comprehensive workflow for PFAS analysis. Using a well-characterized 3M PFOS Lot 217 sample, three analytical workflows are demonstrated: high-throughput screening, suspect screening, and non-targeted analysis. The combination of LC and HRIMS-MS aids rapid screening, enhances isomeric resolution, and enables deeper characterization of PFAS mixtures. Furthermore, software advancements now allow HRIMS-MS-integrated data processing and analysis, paving the way for broader adoption of this approach in environmental applications and beyond. The combination of LC-HRIM as a powerful tool for improving PFAS detection and identification will also be highlighted.
Demands on analytical measurement have increased enormously—partly but not exclusively due to requirements in -omics research in recent years. Samples are becoming more complex and numerous, and an all-encompassing non-targeted analysis (NTA) approach is also increasingly desired. Additionally, the need for more rapid approaches to compound detection are necessary to ensure the time spent more deeply characterizing samples is conducted where it matters most. While there is a gold standard for targeted analysis, namely gas chromatography (GC) or high performance liquid chromatography (HPLC) coupled with triple-quadrupole-mass spectrometry (QQQ-MS), the state of NTA is much less standardized. For NTA, high-resolution mass spectrometers are most frequently used in combination with an upstream chromatographic separation. For the analysis of PFAS, targeted approaches have become heavily scrutinized for their limited ability to fully annotate and determine the burden of PFAS in tested samples (1,2). Non-targeted methods for isomeric profiling of PFAS have emerged as a viable approach for establishing source, migration, treatment approaches, and potential toxicity (3,4). However, as a result of the complexity of the samples and extensive isomeric species, baseline separation with a single dimension of chromatography is not typically feasible.


PFAS molecules © Studio F. - stock.adobe.com

Two-dimensional (2D) chromatography, for both LC and GC, has historically been used to unravel similarly complex challenges in other fields (5,6). Classical two-dimensional LC (2D-LC) and GC (2D-GC), where individual fractions from the first separation dimension are transferred to a second separation column for additional separation have been used successfully for many decades. GC-GC, for example, is based on work carried out by Simmons and Snyder in 1958 (7). However, there are two major disadvantages with classical 2D chromatography: i) only a few fractions can be transferred from the 1st to the 2nd dimension, and ii) a new fraction can only be injected once the previous analysis in the 2nd dimension has been completed. There is also no guarantee that any pre-separation in the 1st dimension will be retained in the 2nd dimension, which may also lead to a reduction in separation performance. Despite several modifications available for 2D separations, including heart-cutting and multiple heart-cutting strategies (6), they are unsuitable for an all-encompassing analysis of a complex sample.
Similar to the arc of adoption with other technologies, ion mobility spectrometry (IMS) has become more prominent in recent years, despite being introduced decades earlier (8). Various types of IMS with differing modes of operating principles have been introduced, giving rise to a wide variety of applications (9). As a result, ion mobility is having an impact in nearly every field of analytical analysis (10–19). In recent years, high-resolution ion mobility spectrometry–mass spectrometry (HRIMS-MS) has distinguished itself as a particularly powerful method for the separation of structurally similar compounds (11,20,21). For HRIMS-MS technologies that provide high resolving power across the entire mobility and mass range, the added peak capacity that comes with the use of HRIMS-MS as a 2nd dimension of separation has opened up the possibility of simplifying even the most complex samples (22–24).
The basic concepts of IMS involve the separation of ions in an electric field according to their size, shape, and charge—the incorporation of which is defined as a molecule’s collision cross-section (CCS) reported in sq. Angstroms (8). The recent development and commercialization of structures for lossless ion manipulation (SLIM) represents a novel method for IMS analyses that uses printed circuit boards with a combination of direct current and alternating current electrodes to confine and transmit ions over considerably longer distances to maximize resolving power compared to other benchtop systems (23). Since the resolving power of IMS is proportional to the square root of the separation path length, the 13 m of the SLIM technology offers the ability to resolve isomers with CCS differences as small as 0.5% (25). This added dimension of separation occurs post-ionization on the millisecond timescale, providing a nested time structure that makes integration with LC and quadrupole time-of-flight mass spectrometry (LC–QTOF-MS) analyzers an optimal configuration (26). The combination of LC, HRIMS-MS, and QTOF-MS for PFAS analysis provides a comprehensive workflow for the profiling of samples analogous to comprehensive two-dimensional LC (LC×LC) while eliminating the majority of the known analytical limitations.
Until recently, the availability of vendor-supported solutions for multiple dimensional analyses, specifically software workflows for analysis, has been a challenge (27). IMS as a separation technology has had a similar trajectory, with vendor-supplied software for integration of data being somewhat limited. Nevertheless, a healthy open-source community with vendor collaboration in addition to vendor-supplied tools has led to the availability of numerous solutions for the analysis of four-dimensional (4D) data. Even more exciting is the availability of processing and conversion tools that enable the integration and exchange of the additional IMS dimension, creating a three-dimensional (3D) file that can be analyzed using existing routine data workflows (28,29).
Using the well-characterized 3M PFOS Lot 217 sample, multiple workflows are demonstrated that are available to handle the data generated using a HRIMS-enabled QTOF-MS system. Three separate workflows were used including a high-throughput screening (HTS) workflow with a 4D to 3D converted file, a suspect screening analysis (SSA) workflow using a 4D file, and a non-targeted analysis (NTA) workflow using the same 4D file. Each has value in answering the various questions that come with studying the pervasive and growing list of compounds categorized as PFAS (30).
Materials and Methods
A sample of 3M PFOS Lot 217 (3M Corporation) was dissolved in methanol, diluted to 1 ng/µL, and combined 3:1 methanol–2.5 mM ammonium acetate for analysis. Chromatographic separation was performed using an Agilent 1290 Infinity II UHPLC system and a 50 mm × 2.1 mm, 1.9-µm Agilent Poroshell 120 EC-C18 column using a column temperature of 50 °C with a flow rate of 400 µL/min. The sample was separated chromatographically using mobile phase A (2.5 mM ammonium acetate in 95:5 deionized [DI] water–methanol) and mobile phase B (2.5 mM ammonium acetate in 95:5 methanol–DI water). The sample was analyzed with three LC conditions: i) no column, ii) a ballistic gradient, and iii) the usual gradient program. For the no column analysis, the LC was kept isocratic at 10%A and 90%B. The ballistic gradient elution program was 25%B to start, ramping to 100%B in 1 min, and holding until 3 min, with a 3-min equilibration to starting conditions. The usual gradient was 25% B to start with a 1-min hold, then ramping to 75% B at 3 min, and 100% B at 8 min, held until 12 min with a 3-min equilibration to starting conditions.
An Agilent 6546 QTOF equipped with a Dual AJS ESI Ion Source (Agilent Technologies) and a Mobie High-resolution Ion Mobility device (Mobilion Systems) was used for analysis. For this device, nitrogen buffer gas was used with a 100 ms fill time, 450 ms frame length, and a separating traveling wave of 24 kHz and 45V.
High-Throughput Screening Workflow
The HTS workflow used the ballistic gradient described above. As a result of the short and aggressive nature of the gradient, the LC domain is primarily used to alleviate ion suppression and is not relied upon for compound separation or identification. The resultant *.mbi file from the IMS System was converted to the *.d format for downstream processing using supplied software (Agilent Technologies). After *.d conversion, PNNL PreProcessor (29) (Pacific Northwest National Laboratory) was used to reduce the file to a 3D format including ion mobility, m/z, and intensity. As part of the conversion, the following steps occurred in file processing: i) the individual ion mobility frames were collapsed into a single frame, ii) CCS calibration was applied using the coefficients collected during sample acquisition, and iii) the CCS/z (z being charge) values were parsed to the retention time (RT) domain, with 1 sq. Angstrom equating to 1 min on the x-axis providing compatibility for manual and automated workflows in the MassHunter Qualitative 10.0 software (Agilent Technologies).
Suspect Screening Using LC–HRIMS-MS with Skyline
Skyline is a freely available, open-source software tool designed to analyze targeted quantitative mass spectrometric data (31). A 4D *.d file was used for analysis and the required transition list was from the PFAS LC–IMS-MS Skyline Library provided by the Baker laboratory (32). Following transition list import and 3M PFOS 217 LC–HRIMS -MS 4D result file import, compounds were annotated without the use of the mobility data. An IMS library was subsequently generated using the 3M PFOS 217 sample with resolving power set to 250 and precursor adducts of [M-H] and [M-H-CO2] to ensure decarboxylated PFAS were not missed (14). After the creation of the ion mobility library, the file was reimported and the ion mobility parameters of arrival time (a term used for traveling wave systems compared to classic drift tube systems) and CCS were applied for compound annotation. Retention times were not supplied as the transition library used was from a different analytical method.
NTA Analysis Using LC–HRIMS-MS with Dedicated IMS Software
FluoroMatch (IM) provides interactive visualizations that combine parameters such as CCS, drift time (DT), RT, and accurate mass to discern PFAS homologous series and structures from non-targeted data sets analogous to the non-mobility version of FluoroMatch (33). A *.mzML file was generated from the 4D *.d file using MSConvert from ProteoWizard (34) and was required for visualization of mobiligrams. To generate the required 4D feature list, the IMFE function in IM-MS Browser (Agilent Technologies) was used to extract features with a charge state of 1 and an ion intensity of 100 or greater based on a review of background signal in the file. The RScript for processing the 4D feature list was executed in RStudio (35) and a 10% CCS match window was used for annotation. A customized CCS library was used that removed internal standards and compounds lacking simplified molecular input line entry system (SMILES) notation to ensure proper visualization of all annotated PFAS. For manual investigations, IM-MS Browser (Agilent Technologies) was used to investigate individual 4D *.d files.
Results
High-Throughput Screening

Table I
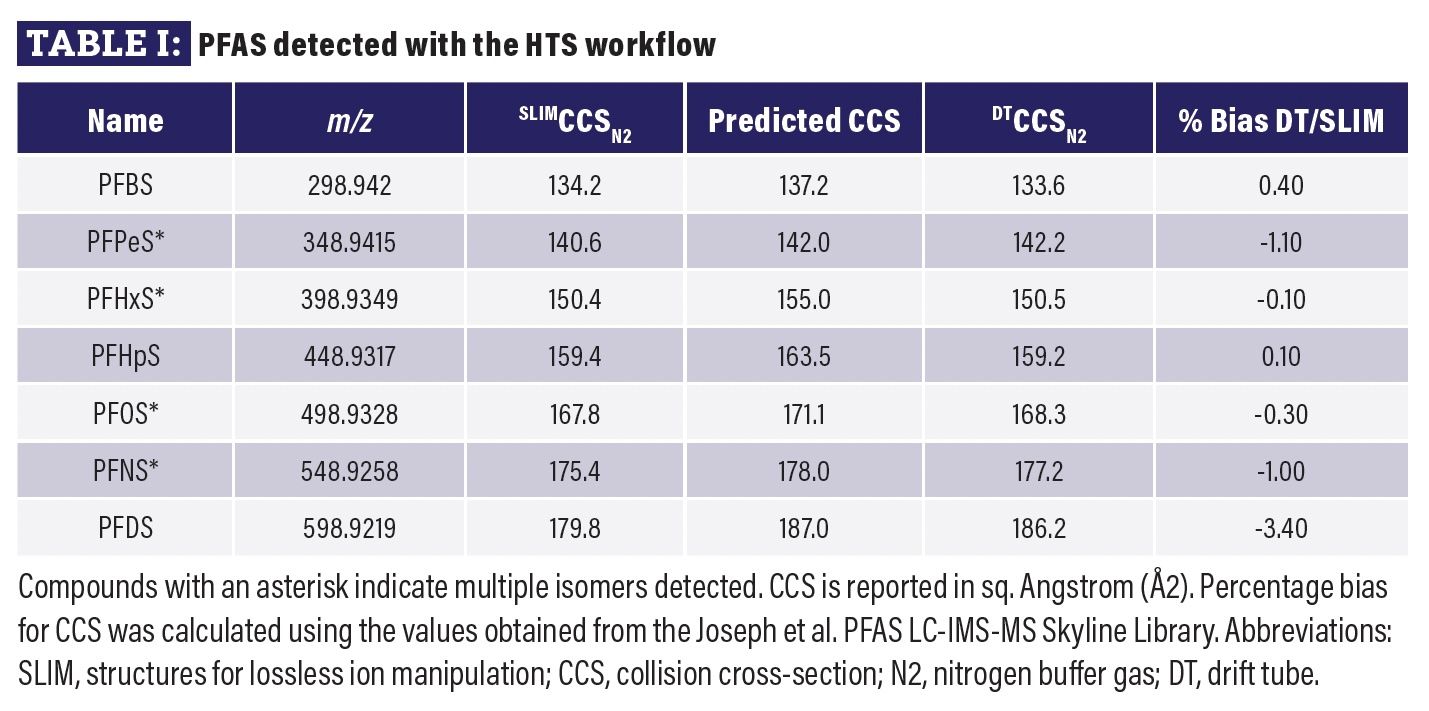
The 3M PFOS Lot 217 sample has been previously characterized for linear and branched constituents using relatively lengthy chromatographic methods (3). Ten separate impurities were identified including four greater than 1% by weight (perfluorobutanesulfonate, PFBS; perfluoropentanesulfonate, PFPeS; perfluorohexanesulfonate, PFHxS; perfluoroheptanesulfonate, PFHpS) with the remaining less than 1% by weight (perfluorodecanesulfonate, PFDS; perfluorooctanoate, PFOA; perfluorononanoate, PFNA; perfluorodecanoate, PFDA; perfluoroundecanoate, PFUnA; perfluorododecanoate, PFDoA). Using the HTS analytical method and a SSA workflow with a personal compound database (PCD) derived from compounds listed in EPA 1633 (36) and predicted CCS from CCSBase (37), all compounds greater than 1% by weight were found, while only one of the six compounds below 1% were detected (Table I). In addition, isomeric signatures were detected for PFOS, PFNS, PFPeS, and PFHxS. Of note, PFNS was not originally reported in the previous characterization of the 3M PFOS Lot 217 referenced, though the measured m/z and CCS were consistent with DT and predicted CCS values. Percent bias was calculated for all detected compounds and ranged from -3.4% to 0.4% when compared to publicly available CCS values determined using a drift tube instrument (32).

Figure 1: Extracted ion mobiligrams from the HTS and MassHunter workflow. Individual EIMs are overlaid including unique colors per compound, with the largest PFOS peak detected labeled with its detected CCS of 167.846. All other peaks are normalized for viewing. The x-axis has been left unmodified to illustrate how the CCS/z data has been mapped to the retention time domain (acquisition time) displayed in minutes, but now corresponding to CCS in sq. Angstroms. The inset shows the EIM and spectra for a manual extraction of the decarboxylated form of PFOA at m/z 368.9765.
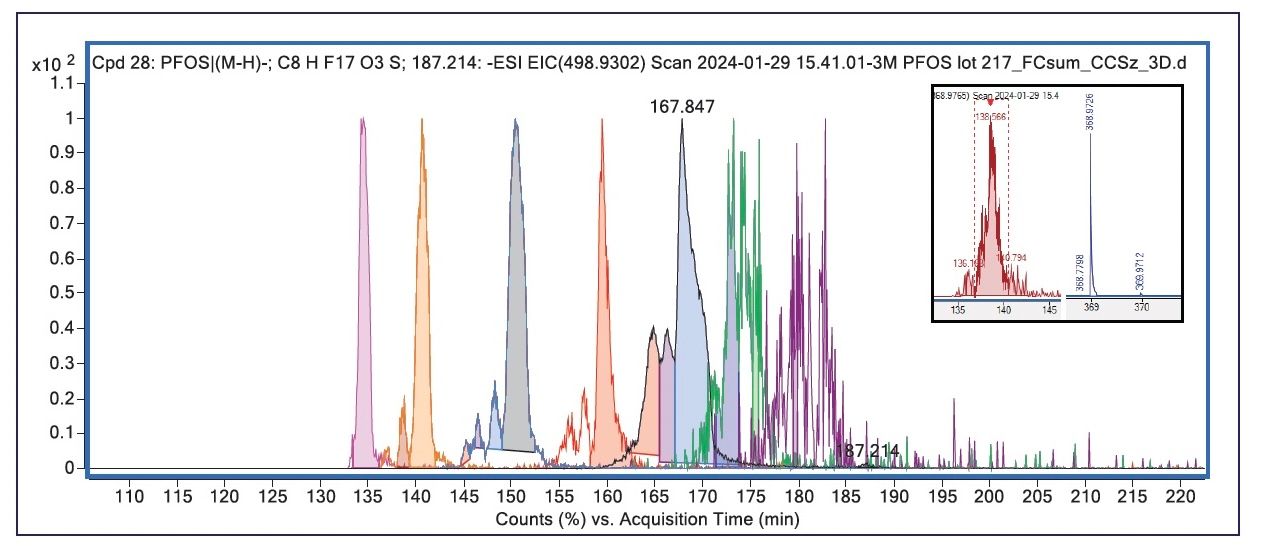
As the original *.d file was processed into a QTOF/3D format using PNNL PreProcessor, the resultant *.d file was able to be analyzed in unmodified vendor software in a similar manner to a conventional *.d file. During the conversion process, the CCS values were parsed to retention time with 1 sq. Angstrom (resulted as CCS/z or collision cross-section divided by charge), equivalent to 1 min in the LC–MS data file. Figure 1 shows overlaid “extracted ion chromatograms (EICs)” after processing with the HTS/SSA workflow. However, because the CCS/z values have been mapped to the RT domain and the x-axis values are in CCS/z, the visual is better termed an “extracted ion mobiligram” or EIM. The use of CCS-calibrated data files is of tremendous value for the HTS workflow as the PCD created can use CCS/z placed into the retention time column for conventional workflows and scoring algorithms present in the software. Additionally, data can be interrogated manually using familiar commands, as shown in the inset for Figure 1 where a low signal for the decarboxylated form of PFOA (m/z 368.9726) was detected using a manual EIC of m/z 368.9765, with a measured CCS value of SLIM138.6N2 vs. DT139.5N2 found in the publicly available LC–IMS-MS Skyline Library (32). Using a similar approach, trace amounts of PFNA (m/z 462.9474, CCS/z 165.7) were detected.
Suspect Screening

Figure 2: Overlaid extracted ion chromatograms using an LC–IM library and a 4D data file in Skyline. Each tentatively identified compound is integrated with a unique color, with the large, light blue peak containing PFOS linear and branched isomers. Labels for individual compounds are automatically applied. Inset, the integrated linear PFOS peak, the full ion mobility data, and a zoomed portion showing the ion mobility data at m/z 498.9302 for PFOS.
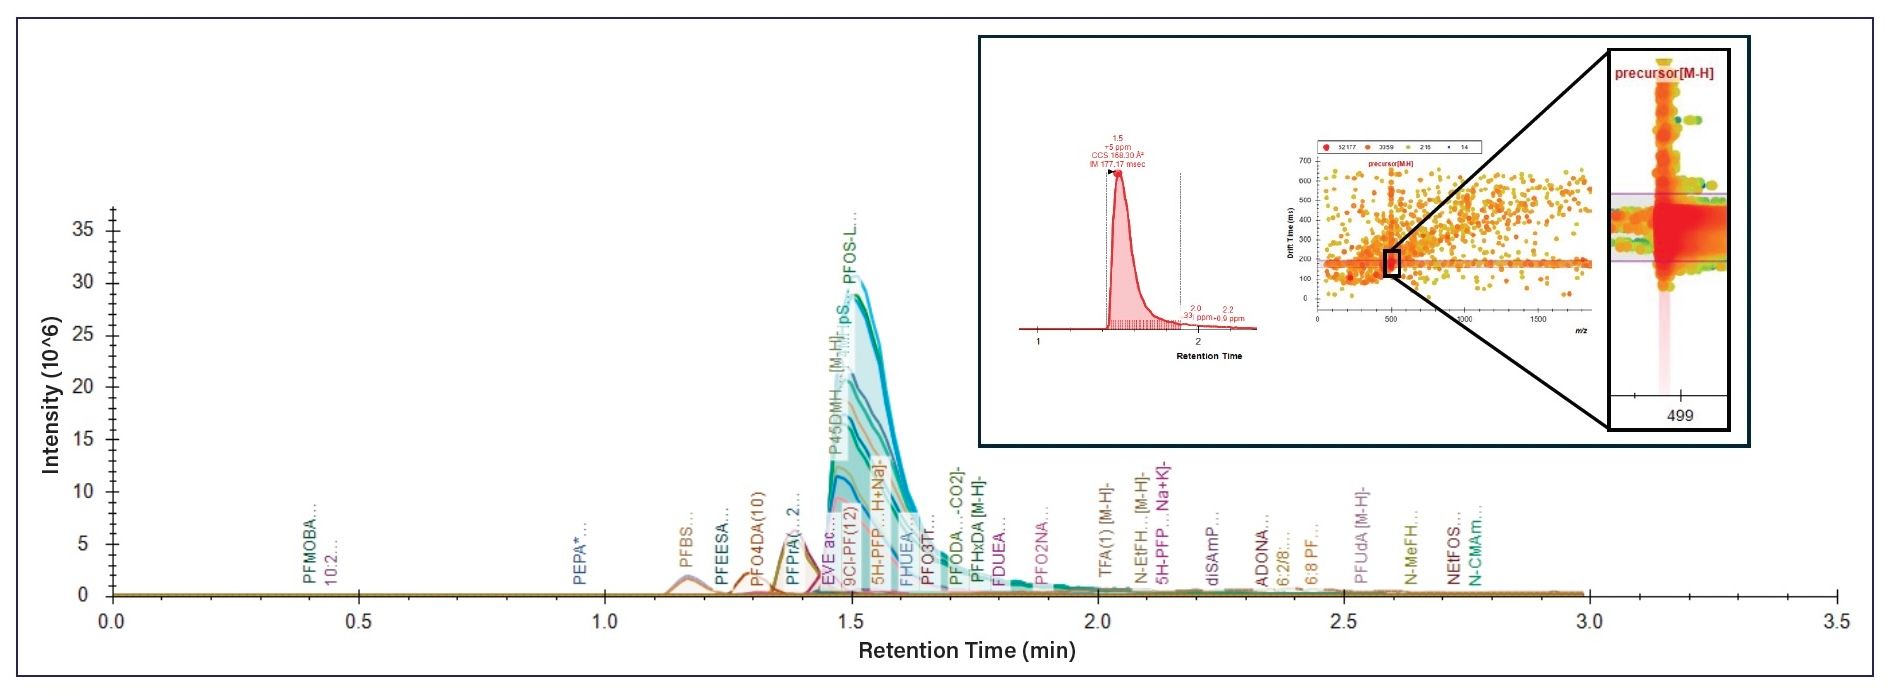
The use of LC and HRIMS-MS is a combination comparable to comprehensive 2D LC×LC analytical workflows as the eluate from the first LC domain is repeatedly sent to a second domain in sequential fractions for separation (27). In LC×LC, the primary limitation beyond extended analysis time and excess solvent use is that the separation of the first dimension is limited in its contribution to overall resolution because of the slow speed of the second dimension of separation. However, when HRIMS-MS is used as the second dimension of separation, the resolution obtained in the first dimension is not compromised because the separation by HRIMS-MS takes less than one second per ion mobility frame. In this manner, LC–HRIMS-MS represents a comprehensive 2D approach with partial orthogonality to both the LC and MS domains. Use of this combination of separation techniques results in a 4D file (RT, CCS, m/z, intensity) that requires specialized software for analysis. The 3M PFOS 217 sample was analyzed using the freely available Skyline software provided for use with ion mobility data files. A Skyline transition list provided from the Baker laboratory (32) was used for targeted evaluation of 173 PFAS. An IMS library was generated based on the data file and the resultant EICs are shown in Figure 2. Review of the library hits for the compounds reported in 3M PFOS 217 confirmed identification in Skyline, with the compounds less than 1% detected based on an identified RT, spectra, and mobility. Considerably more PFAS were identified in Skyline as a result of the lack of RT entries in the transition library. Numerous isomers were tentatively identified in Skyline and further investigated in IM-MS Browser.
Manual Isomer Investigation

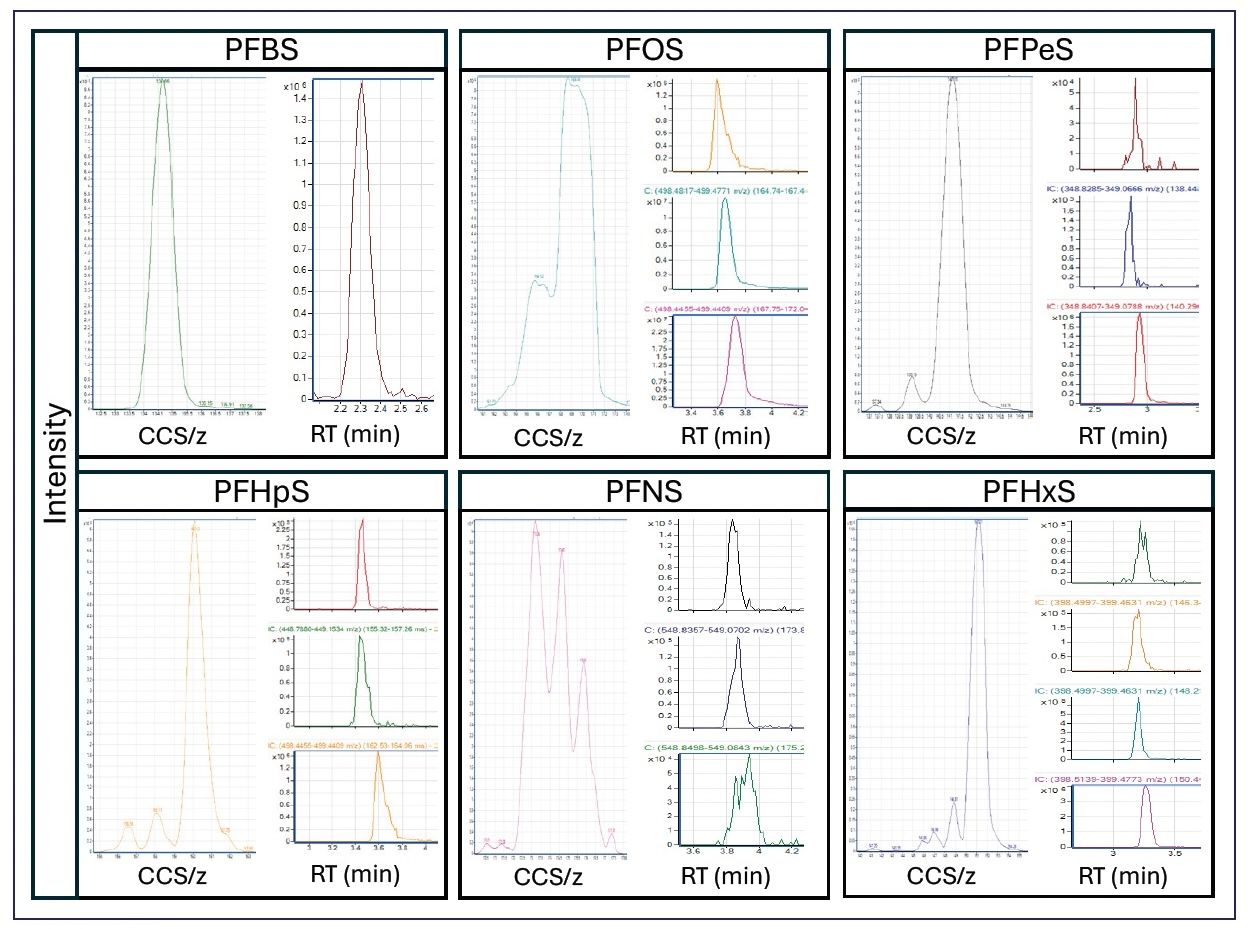
Figure 3: Mobiligrams (left; x-axis) and HRIM filtered EICs (right) for each of the HTS detected compounds. PFBS is included to illustrate the single mobility peak and single EIC. All other PFAS detected with isomers present have three to four isomers found in the mobility dimension, despite minimal to no chromatographic separation.
Because the chromatography used did not sufficiently separate the identified isomers, HRIMS-filtered EICs were generated using a vendor-supplied 4D visualization software. Prior to analysis, the CCS/z values were parsed to the DT domain using PNNL PreProcessor so that visualizations would plot CCS/z rather than DT. Figure 3 provides mobiligrams for all isomeric features originally identified in the HTS workflow and the Skyline suspect screening workflow.
Additionally, HRIMS-filtered EICs were generated demonstrating isomer presence, despite a lack of chromatographic separation. PFBS was included to demonstrate the consistency of the HTS workflow and the resultant mobiligram showing a single PFBS detection. PFOS, PFHpS, PFNS, and PFPeS had three isomers identified, with HRIMS-MS-filtered EICs showing partial to no chromatographic separation. Four isomers were detected for PFHxS, despite no chromatographic separation for three of the four, with only minimal separation of one.
Non-Targeted Analysis

Figure 4: The annotated feature table provided by Fluoromatch IM. Column scoring for the previously reported compounds in the 3M PFOS 217 sample were all A to A-. The overlay is a popup window from a PFOS feature providing feature information and a structure based on SMILES notation in the library file.
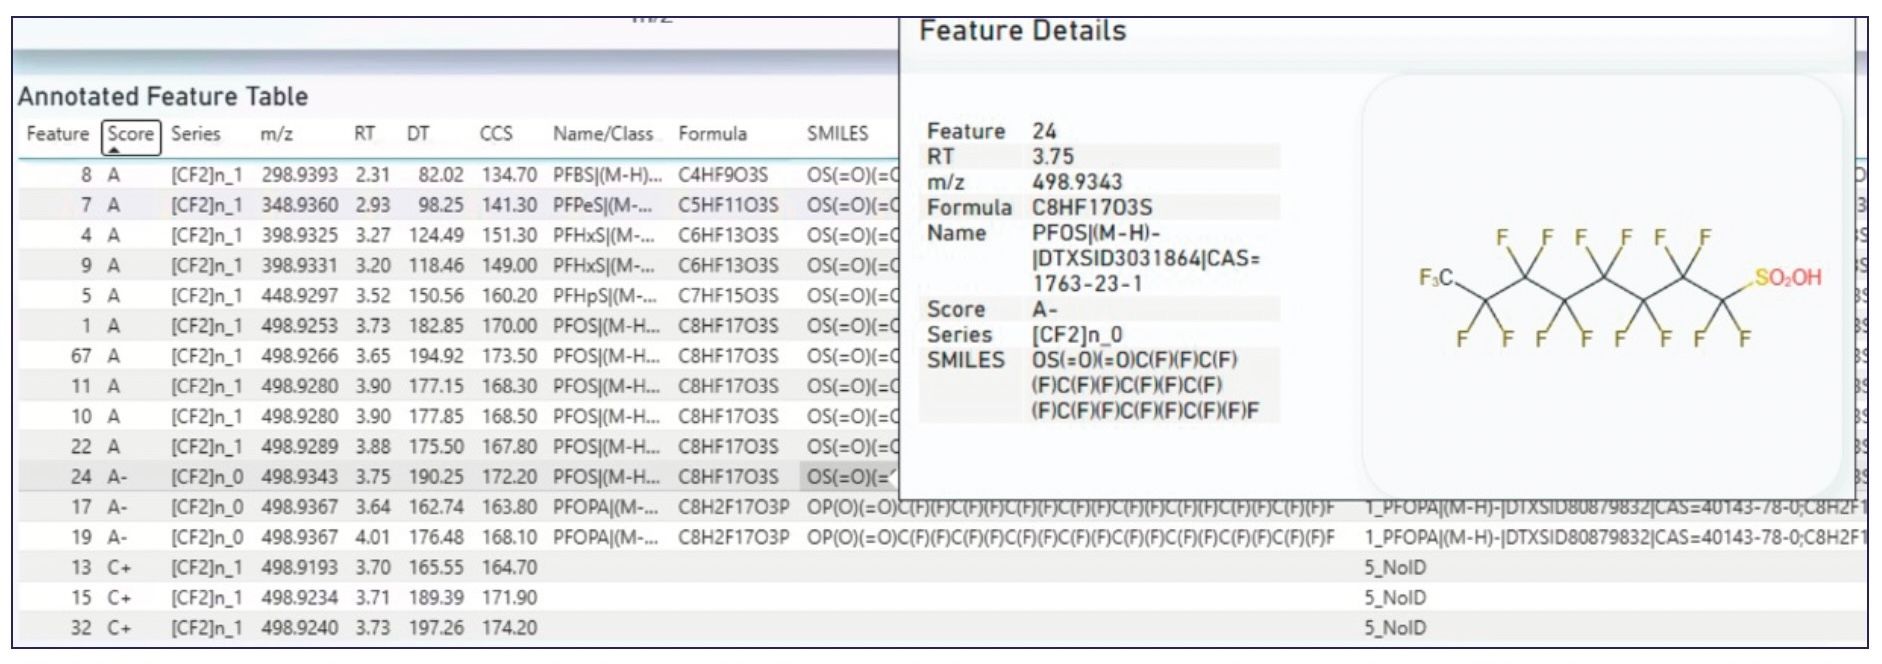
The substantial number of matches for PFAS were further analyzed using FluoroMatch IM. This software developed for IMS is built on the same framework as the FluoroMatch software widely used for NTA of non-mobility containing PFAS data (33). The IMS version of the software requires a feature list for PFAS scoring and a *.mzML file for visualization of mobiligrams. MSConvert was used to generate the *.mzML file and IM-MS Browser was used for 4D feature finding of the 3M PFOS 217 4D file. A total of 91 unique features were identified using the 4D feature-finding capability of IM-MS Browser. However, it is highly unlikely that all 91 features were PFAS and analysis using the IMS version of FluoroMatch substantially narrowed down the number of tentative PFAS. Of the 91 original features, 16 were annotated as PFAS against the CCS-containing library, with scores ranging from A (the highest possible) to C+, (Figure 4). The library does not include specific CCS annotations for isomeric species and as a result the individual isomers are labeled with a single label (for example, PFOS for all PFOS isomers). Interestingly, the IMS version of the software annotated six distinct PFOS isomers, despite only three being identified through manual interrogation.

Figure 5: Visualization of the LC–HRIM 3M PFOS 217 sample. Among the numerous visualizations available, a plot of m/z vs. RT (left), m/z vs. DT (middle), and DT vs. RT (right) are provided to aid in reviewing NTA data for isomeric clusters. In the m/z domain, the compounds are vertically aligned, while the RT and DT domains have differing impacts on separation. The ability to visualize the two separation domains, shown in the far-right plot, highlights the utility of combining LC and HRIMS. Coloring of the individual points is based on homologous series assignment.
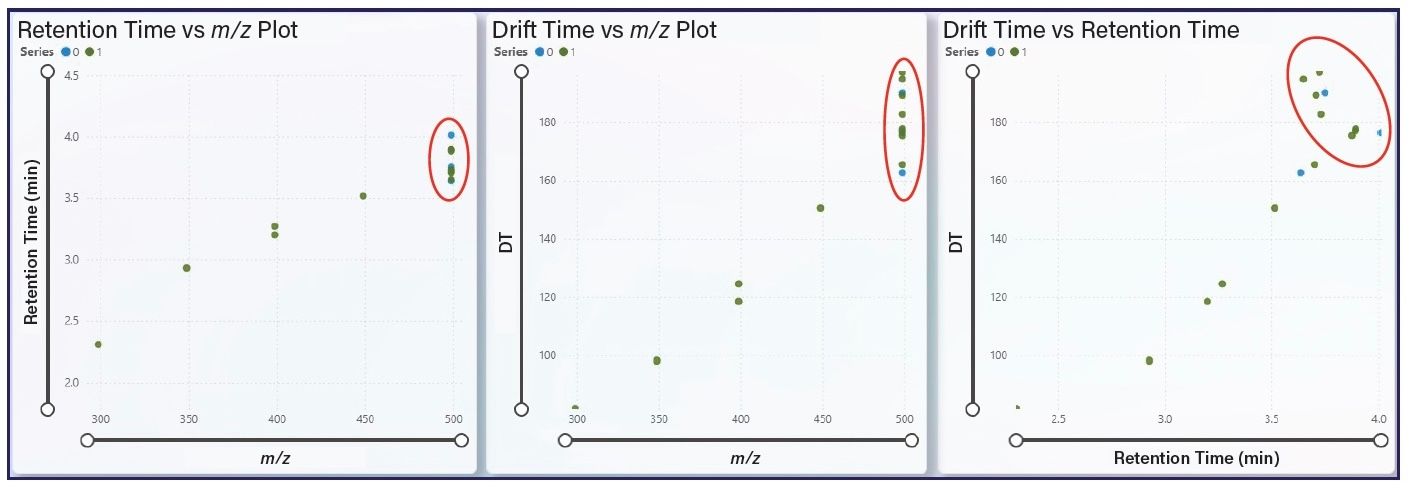
In addition to scoring of potential PFAS, the sofware used also provided several visualizations of substantial value for NTA of samples containing PFAS. Figure 5 illustrates the value of being able to view the detected features with varying combinations of DT, RT, and m/z. The m/z 498.92 isomeric cluster (outlined with red ovals in Figure 5) is vertically aligned on the m/z axis while the RT (Figure 5, left plot) and DT (Figure 5, middle plot) domains demonstrate varying degrees of separation. Viewing the data with DT vs. RT (Figure 5, right plot) illustrates the utility of combining LC and HRIMS-MS separation as the eight potential m/z 498.92 features are fully separated by the combination.
Conclusion
Despite the high resolution of HRMS detection, even the most advanced mass spectrometers cannot distinguish the majority of PFAS isomers without prior separation, as these isomers share the same molecular formula and differ only in structure. In general, most molecular formulas of substances with a molecular weight of approximately 200 Da or more comprise approximately 10,000 substances with different structures per molecular formula (38). Further, the amount of testing required to fully understand the implications of the pervasive use and burden of PFAS will require novel approaches to analytical workflows that provide separation power on a timescale feasible for large studies and higher sample volumes. Greater depth of characterization often comes at the price of slower and more complex workflows, yet the availability of HRIMS-MS as an added dimension of separation, along with the growing availability of applicable software tools, make the combination of LC and HRIMS-MS an appealing method of analysis for future investigations. The HTS workflow demonstrated value for rapid PFAS analysis for concentrations above 1% by weight, indicating its utility in situations where time is of the essence and ultra-low detection limits are not required. Lower detection limits and deeper characterization workflows will likely require separation beyond what a ballistic gradient provides as a result of ion suppression and sample complexity, arguably requiring two dimensions of separation to fully unravel. The compatibility of HRIMS-MS with LC and even ultrahigh-performance liquid chromatography (UHPLC) separations, along with demonstrated processing workflows, provides a roadmap for the widespread adoption of this combination. Though fragmentation analysis was not incorporated into the workflows above, the same PNNL PreProcessor used for 3D to 4D transformation provides an additional processing workflow to transform HRIMS-MS workflows, incorporating fragmentation to be viewed in a similar manner to 3D data-dependent acquisition files (28). Despite numerous software programs required to conduct the entirety of the analyses included, the availability of vendor and open-source software has opened up the possibility of LC–HRIMS-MS as a powerful tool for PFAS analyses. As the field continues to gravitate towards advanced tools capable of providing the separation power required, streamlined workflows will inevitably become more widely available. In time, it is easy to imagine a workflow where the IMS dimension becomes opaque to the end user, identifiable only by the higher quality data not previously obtainable.
Acknowledgments
We would like to thank Dr. Mark Strynar from the EPA for the analysis of the 3M PFOS Lot 217 sample.
References
(1) Patlewicz, G.; Richard, A. M.; Williams, A. J.; Judson, R. S.; Thomas, R. S. Towards Reproducible Structure-based Chemical Categories for PFAS to Inform and Evaluate Toxicity and Toxicokinetic Testing. Comput. Toxicol. 2022, 24, 100250. DOI: 10.1016/j.comtox.2022.100250
(2) Pu, S.; McCord, J. P.; Bangma, J.; Sobus, J. R. Establishing Performance Metrics for Quantitative Non-targeted Analysis: A Demonstration Using Per- and Polyfluoroalkyl Substances. ABC 2024, 416 (5), 1249–1267. DOI: 10.1007/s00216-023-05117-4
(3) Benskin, J. P.; De Silva, A. O.; Martin, J. W. Isomer Profiling of Perfluorinated Substances as a Tool for Source Tracking: A Review of Early Findings and Future Applications. REV ENVIRON CONTAM T 2010, 208, 111–160. DOI: 10.1007/978-1-4419-6880-7_2
(4) Londhe, K.; Lee, C.-S.; McDonough, C. A.; Venkatesan, A. K. The Need for Testing Isomer Profiles of Perfluoroalkyl Substances to Evaluate Treatment Processes. Environ. Sci. Technol. 2022, 56 (22), 15207-15219. DOI: 10.1021/acs.est.2c05518
(5) Santos, N. A. d.; Tose, L. V.; Silva, S. R. C. d.; et al. Analysis of Isomeric Cannabinoid Standards and Cannabis Products by UPLC-ESI-TWIM-MS: A Comparison with GC-MS and GC × GC-QMS. J. Braz. Chem. Soc. 2019, 30, 60–70. DOI: 10.21577/0103-5053.20180152
(6) Pursch, M.; Buckenmaier, S. Loop-Based Multiple Heart-Cutting Two-Dimensional Liquid Chromatography for Target Analysis in Complex Matrices Anal. Chem. 2015, 87 (10), 5310–5317. DOI: 10.1021/acs.analchem.5b00492
(7) Simmons, M. C.; Snyder, L. R. Two-Stage Gas-Liquid Chromatography. Anal. Chem. 1958, 30 (1), 32–35. DOI: 10.1021/ac60133a007
(8) Dodds, J. N.; Baker, E. S. Ion Mobility Spectrometry: Fundamental Concepts, Instrumentation, Applications, and the Road Ahead. J. Am. Soc. Mass Spectrom. 2019, 30 (11), 2185–2195. DOI: 10.1007/s13361-019-02288-2
(9) Gabelica, V.; Marklund, E. Fundamentals of Ion Mobility Spectrometry. Curr. Opin. Chem. Biol. 2018, 42, 51–59. DOI: 10.1016/j.cbpa.2017.10.022
(10) Aderorho, R.; Chouinard, C. D. Improved Separation of Fentanyl Isomers Using Metal Cation Adducts and High-resolution Ion Mobility-Mass Spectrometry. Drug Test Anal. 2023, 16 (4), 369–379. DOI: 10.1002/dta.3550
(11) Arndt, J. R.; Wormwood Moser, K. L.; Van Aken, G.; et al. High-Resolution Ion-Mobility-Enabled Peptide Mapping for High-Throughput Critical Quality Attribute Monitoring. J. Am. Soc. Mass Spectrom. 2021, 32 (8), 2019–2032. DOI: 10.1021/jasms.0c00434
(12) Berthias, F.; Thurman, H. A.; Wijegunawardena, G.; et al. Top-Down Ion Mobility Separations of Isomeric Proteoforms. Anal. Chem. 2023, 95 (2), 784–791. DOI: 10.1021/acs.analchem.2c02948
(13) Craven, K.; Gerbaux, P.; DeWinter, J. Characterizing Polymer Folding Patterns Using Ion Mobility Mass Spectrometry. Waters Corporation, University of Mons Application Note, 2013.
(14) Dodds, J. N.; Hopkins, Z. R.; Knappe, D. R. U.; Baker, E. S. Rapid Characterization of Per- and Polyfluoroalkyl Substances (PFAS) by Ion Mobility Spectrometry–Mass Spectrometry (IMS-MS). Anal. Chem. 2020, 92 (6), 4427–435. DOI: 10.1021/acs.analchem.9b05364
(15) Dubland, J. A. Lipid Analysis by Ion Mobility Spectrometry Combined with Mass Spectrometry: A Brief Update with a Perspective on Applications in the Clinical Laboratory. JMSACL 2022, 23, 7–13. DOI: 10.1016/j.jmsacl.2021.12.005
(16) Dyukova, I.; Ben Faleh, A.; Warnke, S.; et al. A New Approach for Identifying Positional Isomers of Glycans Cleaved from Monoclonal Antibodies. Analyst 2021, 146 (15), 4789–4795. DOI: 10.1039/d1an00780g
(17) Feuerstein, M. L.; Kurulugama, R. T.; Hann, S.; Causon, T. Novel Acquisition Strategies for Metabolomics Using Drift Tube Ion Mobility-Quadrupole Resolved All Ions Time-of-Flight Mass Spectrometry (IM-QRAI-TOFMS). Anal. Chim. Acta 2021, 1163, 338508. DOI: 10.1016/j.aca.2021.338508
(18) Joshi, R.; Sharma, S.; Kumar, D. Advances of Ion Mobility Platform for Plant Metabolomics. Crit. Rev. Anal. Chem. 2024, 54 (1), 175–91. DOI: 10.1080/10408347.2022.2070000
(19) van Dyck, J. F.; Burns, J. R.; Le Huray, K. I. P.; et al. Sizing Up DNA Nanostructure Assembly With Native Mass Spectrometry and Ion Mobility. Nat. Commun. 2022, 13 (1), 3610. DOI: 10.1038/s41467-022-31029-5
(20) Aderorho, R.; Lucas, S. W.; Chouinard, C. D. Separation and Characterization of Synthetic Cannabinoid Metabolite Isomers Using SLIM High-Resolution Ion Mobility-Tandem Mass Spectrometry (HRIMS-MS/MS). J. Am. Soc. Mass Spectrom. 2024, 35 (3), 582–589. DOI: 10.1021/jasms.3c00419
(21) Koomen, D. C.; May, J. C.; Mansueto, A. J.; Graham, T. R.; McLean, J. A. An Untargeted Lipidomics Workflow Incorporating High-Resolution Demultiplexing (HRdm) Drift Tube Ion Mobility-Mass Spectrometry. J. Am. Soc. Mass Spectrom. 2024. 35 (10), 2448–2457. DOI: 10.1021/jasms.4c00251
(22) DeBord, D.; Rorrer, L.; Deng, L.; Strathmann, F. Abandoning the Quadrupole for Mass Spectrometry Fragmentation Analysis: Towards 1,000 Hz Speeds with 100% Ion Utilization Using High Resolution Ion Mobility Precursor Isolation. bioRxiv 2024, DOI: 10.1101/2024.10.18.619158.
(23) Deng, L.; Ibrahim, Y. M.; Baker, E. S.; et al. Ion Mobility Separations of Isomers Based Upon Long Path Length Structures for Lossless Ion Manipulations Combined with Mass Spectrometry. ChemistrySelect 2016, 1 (10), 2396–2399. DOI: 10.1002/slct.201600460
(24) Kedia, K.; Harris, R.; Ekroos, K.; et al. Investigating Performance of the SLIM-Based High Resolution Ion Mobility Platform for Separation of Isomeric Phosphatidylcholine Species. J. Am. Soc. Mass Spectrom. 2023, 34 (10), 2176–2186. DOI: 10.1021/jasms.3c00157
(25) Varona, M.; Dobson, D. P.; Napolitano, J. G.; et al. High Resolution Ion Mobility Enables the Structural Characterization of Atropisomers of GDC-6036, a KRAS G12C Covalent Inhibitor. J. Am. Soc. Mass Spectrom. 2024, 35 (11), 2586–2595. DOI: 10.1021/jasms.4c00103
(26) Wormwood, K. L.; Deng, L.; Hamid, A. M.; DeBord, D.; Maxon, L. The Potential for Ion Mobility in Pharmaceutical and Clinical Analyses. Adv. Exp. Med. Biol. 2019, 1140, 299–316. DOI: 10.1007/978-3-030-15950-4_17
(27) Stoll, D. R.; Carr, P. W. Two-Dimensional Liquid Chromatography: A State of the Art Tutorial. Anal. Chem. 2017, 89 (1), 519–531. DOI: 10.1021/acs.analchem.6b03506
(28) Stow, S. M.; Gibbons, B. C.; Rorrer Iii, L. C.; et al. Exploring Ion Mobility Mass Spectrometry Data File Conversions to Leverage Existing Tools and Enable New Workflows. J. Am. Soc. Mass Spectrom. 2024, 35 (8), 1991–2001. DOI: 10.1021/jasms.4c00220
(29) Bilbao, A.; Gibbons, B. C.; Stow, S. M.; et al. A Preprocessing Tool for Enhanced Ion Mobility-Mass Spectrometry-Based Omics Workflows. J. Proteome Res. 2022, 21 (3), 798–807. DOI: 10.1021/acs.jproteome.1c00425
(30) Strathmann, F. G.; Burden, S.; Hua, J.; Patterson, A.; Middleberg, R. Forever Chemicals, Endless Testing? Expert Advice to Be Prepared for Per- and Polyfluoroalkyl Substances. Clin. Chem. 2024, 70 (12), 1402–1410. DOI: 10.1093/clinchem/hvae165
(31) Adams, K. J.; Pratt, B.; Bose, N.; et al. Skyline for Small Molecules: A Unifying Software Package for Quantitative Metabolomics. J. Proteome Res. 2020, 19 (4), 1447–1458. DOI: 10.1021/acs.jproteome.9b00640
(32) Joseph, K.; Baker, E.; Boatman, A.; et al. PFAS LC-IMS-MS Skyline Library. Zenodo, 2024, DOI: 10.5281/zenodo.13387493
(33) Koelmel, J. P.; Stelben, P.; Godri, D.; et al. Interactive Software for Visualization of Nontargeted Mass Spectrometry Data—FluoroMatch Visualizer. Exposome 2022, 2 (1), osac006. DOI: 10.1093/exposome/osac006
(34) Chambers, M. C.; Maclean, B.; Burke, R.; et al. A Cross-platform Toolkit for Mass Spectrometry and Proteomics. Nat. Biotechnol. 2012, 30 (10), 918–920. DOI: 10.1038/nbt.2377
(35) RStudio: Integrated Development Environment for R. http://www.posit.co/ (accessed 2025-02-27).
(36) U.S. Environmental Protection Agency, Method 1633A: Analysis of Per- and Polyfluoroalkyl Substances (PFAS) in Aqueous, Solid, Biosolids, and Tissue Samples by LC-MS/MS. (U.S. Environmental Protection Agency, 2024).
(37) Ross, D. H.; Cho, J. H.; Xu, L. Breaking Down Structural Diversity for Comprehensive Prediction of Ion-Neutral Collision Cross Sections. Anal. Chem. 2020, 92 (6), 4548–4557. DOI: 10.1021/acs.analchem.9b05772
(38) May, J. C.; McLean, J. A. Advanced Multidimensional Separations in Mass Spectrometry: Navigating the Big Data Deluge. ARAC 2016, 9, 387–409. DOI: 10.1146/annurev-anchem-071015-041734
Frederick G. Strathmann is the senior VP for the Global Business at Mobilion Systems in Chadds Ford, Pennsylvania, USA, and is responsible for all business related to product launch and strategy development. He has worked in hospital and national reference laboratory environments, is board certified by the American Board of Clinical Chemistry in both clinical chemistry and toxicological chemistry, and serves as a CLIA Laboratory Director for High Complexity Testing for Smithers Pharmaceutical Development Services and QPS, LLC.
Oliver J. Schmitz has been a full professor at the University of Duisburg-Essen and is the chair of the Institute of Applied Analytical Chemistry since 2012. In 2018, Schmitz founded, together with Agilent, the Teaching and Research Center for Separation (TRC) at the University of Duisburg-Essen. His main research area is separation science, with a particular focus on non-target analysis of complex samples, the development of ion sources, the use and optimization of multidimensional LC and GC, ion mobility-mass spectrometry, and metabolomics.


, also known as an immunoglobulin (Ig). 3d vector © sakurra - stock.adobe.com")


; An Interview with Fabrice Gritti")
: An Interview With Fabrice Gritti")


Determining the Effects of ‘Quantitative Marinating’ on Crayfish Meat with HS-GC-IMS
April 30th 2025A novel method called quantitative marinating (QM) was developed to reduce industrial waste during the processing of crayfish meat, with the taste, flavor, and aroma of crayfish meat processed by various techniques investigated. Headspace-gas chromatography-ion mobility spectrometry (HS-GC-IMS) was used to determine volatile compounds of meat examined.


University of Tasmania Researchers Explore Haloacetic Acid Determiniation in Water with capLC–MS
April 29th 2025Haloacetic acid detection has become important when analyzing drinking and swimming pool water. University of Tasmania researchers have begun applying capillary liquid chromatography as a means of detecting these substances.

Using GC-MS to Measure Improvement Efforts to TNT-Contaminated Soil
April 29th 2025Researchers developing a plant microbial consortium that can repair in-situ high concentration TNT (1434 mg/kg) contaminated soil, as well as overcome the limitations of previous studies that only focused on simulated pollution, used untargeted metabolone gas chromatography-mass spectrometry (GC-MS) to measure their success.

