Towards Automated Routine Analysis of the Distribution of Trace Elements in Single Cells Using ICP-MS
Special Issues
Analysis of the compositional variation in living cells is essential for understanding biological processes. Single-cell elemental analysis by triple-quadrupole ICP-MS is emerging as a selective, highly sensitive, and potentially high-throughput technique for the study of constitutive elements, and uptake of metallodrugs (or metal-containing nanomaterials) in single cells.
Cell-to-cell variability is known to be of crucial importance to understand different biological processes. Studying the individual variations of, for example, trace elements in cell populations can be carried out only by means of single cell analysis techniques, and, for this aim, single cell elemental analysis by ICP-MS is emerging as a selective, highly sensitive, and potentially high-throughput technique. The study of constitutive elements, and uptake of metallodrugs (or metal-containing nanomaterials), are of special interest and importance. In this work, a highly efficient sample introduction system and a triple-quadrupole (TQ) ICP-MS, in combination with a dedicated microflow autosampler, was used for single cell analysis. This setup enables the transport of intact single cells to the inductively coupled plasma used as an ion source, with transport efficiencies over 50% for different cell lines. The analysis of single cells using an element selective detection system, such as an ICP-MS, allows one to study the elemental content of both intrinsic and exogenous elements. For some of the intrinsic elements, such as phosphorus, typically occurring spectral interferences need to be removed by using a triple-quadrupole based ICP-MS system. The strategy to analyze concentration distributions at single cell level will be presented for yeast cells. The selected combination of instruments enables fully automated, unattended, and potentially high-throughput analysis of single cells.
The analysis of elements in biological systems has a long tradition, due to its importance for the understanding of their functions. Because of the increasing sensitivity of modern analytical techniques like inductively coupled plasma-mass spectrometry (ICP-MS), the determination of various elements in small individual objects like cells, called single cell analysis, is now possible. This significant improvement can provide insights into the biological variation of the elemental composition within a cell population. Other important information can be gathered for the cellular uptake of nanomaterials or pharmaceutical drugs.
Single cell ICP-MS usually refers to the introduction of a cell suspension via a nebulization system, although laser ablation might be considered useful for this purpose as well. Similar to single-particle ICP-MS developed by Degueldre and associates in 2003, the concept of single cell ICP-MS is based on introducing a diluted cell suspension into the ionization source in combination with short integration times (between µs and a few ms) on the detector side (1). Once a cell enters the ionization source, it produces a plume of ions that can be registered at the detector as a short signal of approximately 500 µs duration. The signal intensity for a certain isotope is related to the corresponding elemental mass within the cell and the frequency of signals (usually called events) correlates to the cell number concentration in the suspension. It was first shown by Li and colleagues, and forms the conceptual basis of recent approaches (2). Most critical of such a system is the sample introduction through nebulization. First, it requires the transport of intact cells until they reach the plasma, and, second, the transport efficiency should be as high as possible. Recent developments presented combinations of nebulizers and spray chambers that permit high efficiencies of up to 100% (3–5). In this work, we will present a highly efficient sample introduction system, and a triple- quadrupole (TQ) ICP-MS in combination with a dedicated microflow autosampler. Transport efficiencies will be illustrated on several examples. Finally, we will demonstrate the application to the analysis of yeast samples, in order to demonstrate the intracellular incorporation of elements by the commercial producer.
Experimental
Instrumentation
For all ICP-MS measurements, an iCAP TQ ICP-MS (Thermo Fisher Scientific) was used. For measurements of phosphorus, selenium, and chromium, TQ-O2 mode was selected (mass shift from 31P+ to 31P16O+, 80Se+ to 80Se16O+ and 52Cr+ to 52Cr16O+, respectively, after reaction with oxygen in the reaction cell). For single cell measurements, the instrument was fitted to the high sensitivity single-cell sample introduction system for ICP-MS (Glass Expansion). The data were acquired using time-resolved analysis mode at a dwell time of 5 ms. All ICP-TQ-MS parameters are summarized in Table I.
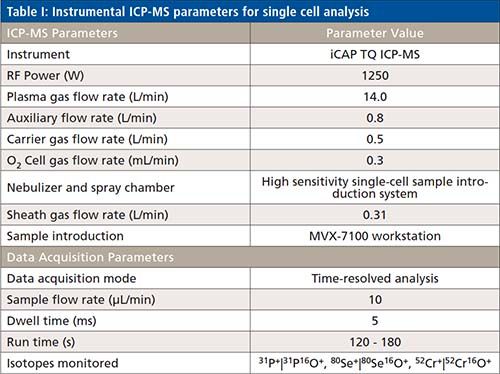
Samples and rinsing solutions were introduced into the plasma at a flow rate of 10 µL/min, using the MVX-7100 µL workstation (Teledyne CETAC Technologies). This autosampler system is connected to the iCAP TQ through a trigger cable, which allows the unsupervised analysis of sample sequences. This system also offers the possibility of diluting and mixing the samples before the injection. Briefly, the workstation allows to place the samples in a cooled holder, where they are aspirated through an inert sample probe. Only the measured sample volume needs to be taken, because the sample is then brought to the injection loop. After settling the sample volume into the loop, a carrier flow pushes it to the sample introduction system. The carrier flow is also used as washing solution, and, therefore, 2% nitric acid is used for this purpose. All internal parts of the autosampler are inert and metal-free. One sample can be analyzed in a total time of less than 7 min, with an effective measurement time of up to 3 min.
Preparation of Cell Samples
Lyophilized yeast samples were resuspended in water, washed twice by centrifugation, and diluted to a final concentration of around 50,000 yeast cells per mL in water (determined by flow cytometry). Similarly, the other cell lines (A2780 and GM04312) were washed with a TBS solution, and finally diluted to approximately 25,000 cells per mL.
Data Treatment
As previously reported (4,6), each data set was averaged, and the data points higher than three or five standard deviations over the mean were considered as cell or particle events. This procedure was iterated, after removal of the events, until no new data points above the threshold were detected. All single-cell or particle signals higher than three standards deviations above their mean were discarded as multiple-cell or particle events.
Results and Discussion
Transport Efficiency of the Sample Introduction System
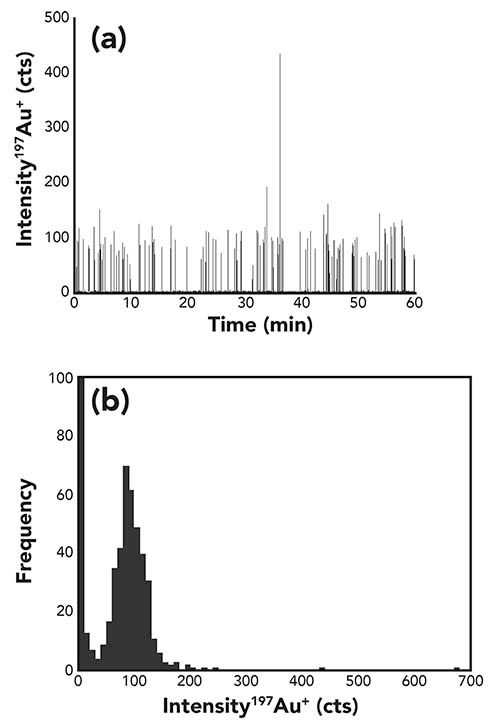
The transport efficiency of the liquid elemental standards for mass determination was calculated using the 30 nm gold nanoparticles reference material NIST 8012, as previously reported (4). A typical measurement of gold nanoparticles and its corresponding histogram is shown in Figure 1. The average signal was 99±10 counts per nanoparticle, and 124 nanoparticles per minute were detected. The transport efficiency was calculated by dividing the number of detected particles by the number of particles in the suspension, which was calculated using the certified values of gold concentration and particle size. The transport efficiency calculated in this manner resulted to be 55% for 30 nm gold nanoparticles.
Figure 1: (a) Time-resolved signal and (b) histogram for the measurement of a suspension of 24000 particles per mL of the 30 nm gold nanoparticle standard NIST 8012.
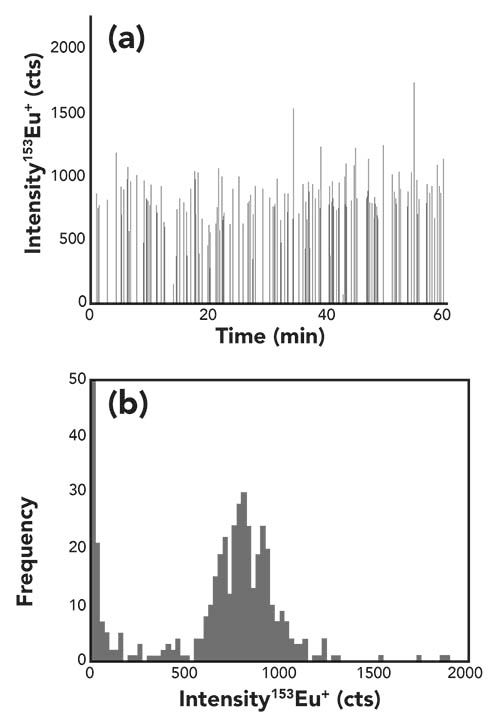
In order to mimic the transport efficiency of cells (an important factor for the determination of the cell number concentration), europium-loaded calibration beads (Fluidigm) were used. This calibration standard contains 3.3 x 10⁵ natural isotopic europium-loaded polystyrene beads per mL, with a particle size of 3 µm. These particles are better comparable to cells in terms of particle size and matrix composition than gold nanoparticles. After 10 times dilution in water, a typical measurement of polystyrene calibration beads and its corresponding histogram is shown in Figure 2. In this case, 174 particles per minute were detected, with an average intensity of 818 ± 101 counts per particle. The transport efficiency was 51% for the calibration beads, showing that there is no significant change in the transport efficiency when calculated with gold nanoparticles or polystyrene beads.
Figure 2: (a) Time-resolved signal and (b) histogram for the measurement of a 33000 beads per mL suspension of polystyrene calibration beads loaded with Eu.
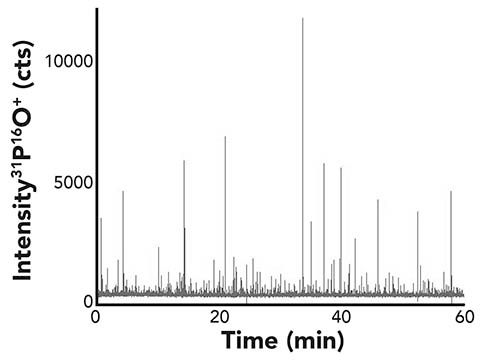
For the determination of the cell transport efficiency, the strategy applied was initially to determine the cell number concentration of the suspension by flow cytometry (4). This determination served as a reference for the following single cell ICP-MS experiments. In a recent work, we suggested, either after the uptake of a non-toxic terbium-containing complex or the detection of the constitutive element iron, for counting cell events by ICP-MS (4). Since the ICP-TQ-MS offers the sensitive detection of other constitutive elements like phosphorous, we figured out that this element was better suited as a general ICP-MS cell marker. Due to its ubiquitous presence in biological systems (in form of DNA, RNA, phosphate, phospholipids, and so forth), the detection of 31P+ with a mass shift to 31P16O+ after reaction with oxygen turned out to be a good indicator for the presence and number of cells. Figure 3 shows a typical example of the time-resolved analysis of GM04312 cells in the single cell mode. Cell events could be clearly distinguished from the background using the criteria mentioned in paragraph “data treatment.” The number of detected cell events was then set into relation to the theoretically expected cell number, as obtained from the flow cytometric experiments, and the resulting ratios were equal to the transport efficiencies.
Figure 3: Time-resolved signal of phosphorus for the measurement of a 25,000 GM04312 cells per mL.
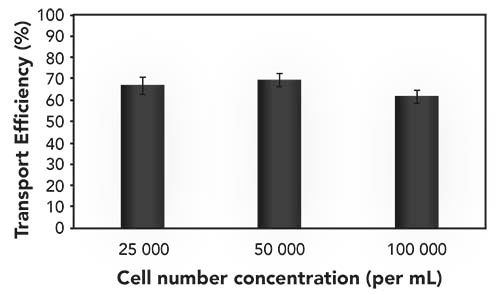
The different cell lines showed the transport efficiencies, as summarized in Table II. Differences between the cell types could be observed, and might be explainable by the differing cell shapes, robustness, and sizes. The day-to-day variations were in the order of 5% absolute, and the transport efficiency was virtually independent from the introduced cell number concentration (Figure 4). Initial experiments on the effect of cell sedimentation showed that any influence was negligible up to 30 min analysis time. In any case, the sample introduction system used offers in principle a resuspending step. Quantification of different elements in individual cells was carried out after external calibration using single elemental standards, and the required transport efficiency for the aqueous standard was obtained by correlating it to a standard of gold nanoparticles (NIST 6012 or NIST 6013) (4,7).

Figure 4: Transport efficiency of yeast cells in function of the cell number concentration.
Analysis of Commercially Available Yeast Samples
Nutritional yeast is sold commercially as a food product, but yeast with added elements like selenium, calcium, chromium, and others can be found in various pharmacies as food supplement products. They should support the supply of essential elements to the human body in case of deficiency. The control of quality of these products is essential, and here we applied the single cell ICP-MS approach to investigate the cellular incorporation of the added elements. As examples, the results on commercially available yeast products enriched in selenium and chromium are shown.
The strategy was to determine the total number of cells by measuring phosphorus and then compare it with the number of cell events in which the sought elements were detectable (7). In order to discriminate between cell events and background signals, the procedure as described in the paragraph data treatment was followed.
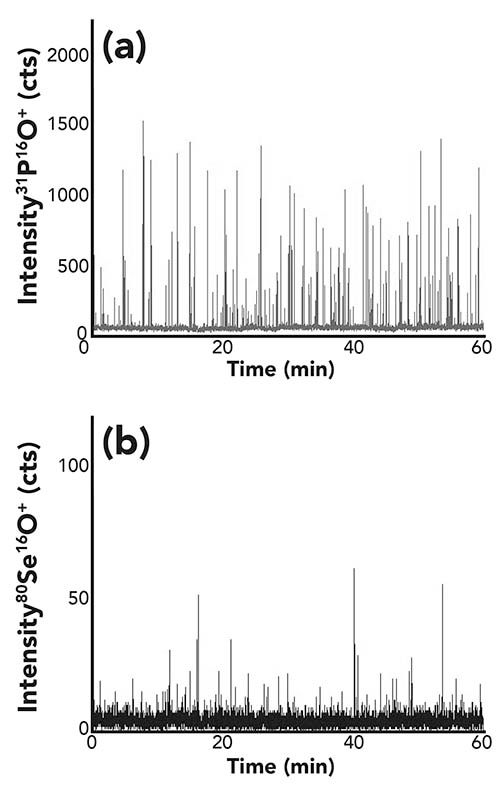
Typical time-resolved measurements for the elements phosphorus and selenium are shown in Figure 5. Phosphorus again served as a cell marker, and the resulting ratio between cell events containing selenium and the number of cells detected by monitoring phosphorus resulted in 62%. That means that only two-thirds of the yeast cells incorporated selenium, at least above the detection limit for selenium (0.16 fg per cell [7]). The detected amounts of selenium per cell were between 0.5 and 30 fg. It can be concluded that an active cell incorporation occurred during the production of the so-called “selenized yeast.”
Figure 5: (a) Time-resolved signal of phosphorus and (b) selenium for the measurement of a selenized yeast sample.
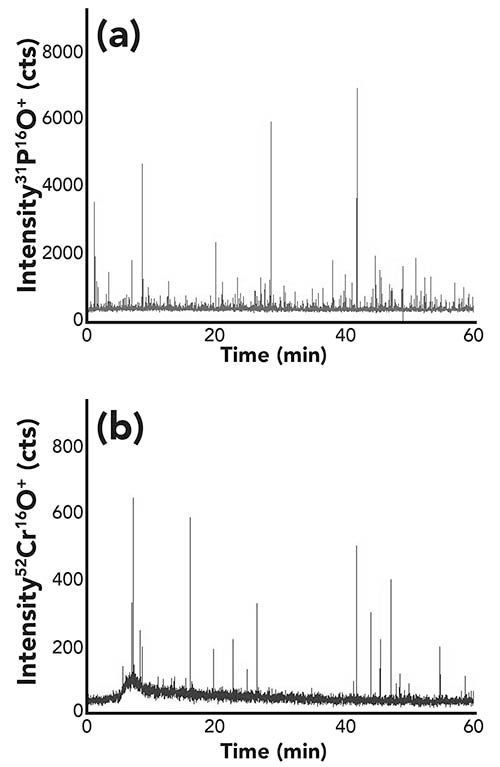
In the case of the yeast enriched with chromium, the same strategy was followed. Figure 6 reflects the observations for monitoring phosphorus and chromium in the single cell mode. It becomes clearly visible that much less cell events were observable for the chromium trace. Furthermore, the background signals were relatively high, indicating the presence of dissolved chromium in the cell suspension, even after the applied washing steps. These findings showed that either the yeast cells were not actively incorporating chromium, or the cells were just mixed with an unknown chromium species.
Figure 6: (a) Time-resolved signal of phosphorus and (b) chromium for the measurement of a yeast sample enriched in chromium.
In any case, these preliminary results demonstrate that single cell ICP-TQ-MS can deliver important information in the control of yeast-based products enriched with elements. Apart from quantitative data, it can provide a fast tool to distinguish between incorporated and extracellular elements, as shown on the example of chromium. Finally, it might be generally useful for controlling the production of commercial products based on yeast.
Conclusions
The analysis of the content of trace elements at an individual cell level is possible using single cell ICP-MS with a dedicated sample introduction system. The technique allows to screen a high number of individual cells in a short period of time, so that excellent counting statistics are achieved, allowing a true overview on whether a given element is distributed homogenously within cell population, included in the cells or not, or evaluation of differences in intake or metabolism under certain conditions. Furthermore, accurate quantification of the amount of metal per cell is possible after calibration. This information can be valuable in a variety of applications, such as structural biology, clinical research, and biotechnology.
References
- C. Degueldre and P.-Y. Favarger, Coll. Surf. A Physicochem. Eng. Asp. 217, 137–142 (2003).
- F. Li, D.W. Armstrong, and R.S. Houk, Anal. Chem. 77, 1407–1413 (2005).
- H. Wang, M. Wang, B. Wang, L. Zheng, H. Chen, Z. Chai, and W. Feng, Anal. Bioanal. Chem.409, 1415–1423 (2017).
- M. Corte-Rodríguez, R. Álvarez-Fernández García, E. Blanco, J. Bettmer, and M. Montes-Bayón, Anal. Chem.89, 11491–11497 (2017).
- P.E. Verboket, O. Borovinskaya, N. Meyer, D. Günther, and P.S. Dittrich, Anal. Chem. 86, 6012–6018 (2014).
- (M. Corte-Rodríguez, E. Blanco-González, J. Bettmer, and M. Montes-Bayón, Anal. Chem.91, 15532–15538 (2019).
- R. Álvarez-Fernández García, M. Corte-Rodríguez, M. Macke, K.L. LeBlanc, Z. Mester, M. Montes-Bayón, and J. Bettmer, Analyst, (2020) DOI: 10.1039/C9AN01565E
M. Corte-Rodríguez is with the Institute for Analytical Chemistry at the University of Vienna, in Vienna, Austria. R. Álvarez-Fernández García, P. García-Cancela, M. Montes-Bayón, and J. Bettmero are with the Department of Physical and Analytical Chemistry at the University of Oviedo, in Oviedo, Spain. D.J. Kutscher is with Thermo Fisher Scientific, in Bremen, Germany. Direct correspondence to: daniel.kutscher@thermofisher.com

Accelerating Monoclonal Antibody Quality Control: The Role of LC–MS in Upstream Bioprocessing
This study highlights the promising potential of LC–MS as a powerful tool for mAb quality control within the context of upstream processing.
Using GC-MS to Measure Improvement Efforts to TNT-Contaminated Soil
April 29th 2025Researchers developing a plant microbial consortium that can repair in-situ high concentration TNT (1434 mg/kg) contaminated soil, as well as overcome the limitations of previous studies that only focused on simulated pollution, used untargeted metabolone gas chromatography-mass spectrometry (GC-MS) to measure their success.
Prioritizing Non-Target Screening in LC–HRMS Environmental Sample Analysis
April 28th 2025When analyzing samples using liquid chromatography–high-resolution mass spectrometry, there are various ways the processes can be improved. Researchers created new methods for prioritizing these strategies.
Potential Obstacles in Chromatographic Analyses Distinguishing Marijuana from Hemp
April 28th 2025LCGC International's April series for National Cannabis Awareness Month concludes with a discussion with Walter B. Wilson from the National Institute of Standard and Technology’s (NIST’s) Chemical Sciences Division regarding recent research his team conducted investigating chromatographic interferences that can potentially inflate the levels of Δ9-THC in Cannabis sativa plant samples, and possible solutions to avoid this problem.

.png&w=3840&q=75)

.png&w=3840&q=75)


.png&w=3840&q=75)


.png&w=3840&q=75)


