The LCGC Blog: Back to School—Solving Practical HPLC Problems with Basic Theory
I’m very much a “big picture” type of thinker. By that, I mean unless I can understand all of the working parts of a problem and understand how they interact, I find it difficult to decide the best approach to figuring out how to solve the issue. While this is certainly a personality trait, I often wonder how chromatographers with some thirty-plus years less experience than myself begin to fathom the complexities of separation science and so begin to develop their own approach to practical problem solving.
The Purnell Equation shown in Figure 1 does an excellent job of describing the change in chromatographic Resolution (R) obtained when altering each of the principle chromatographic variables, namely efficiency (N), selectivity (a) or retention factor (k). When I’m teaching chromatography, it’s at the point we begin to roll out the governing equations that I see that glazed look come over many students, as the old guy “tries to tie everything back to theory,” “when was the last time I ever used an equation in the laboratory,” and “when was the last time he ever did any real chromatography.” Most times I can retrieve this situation by answering, “yesterday,” and by relating the mathematical relationships to the last time they stood in front of their HPLC equipment scratching their head for inspiration! Let’s do the same thing here and see how this particular equation can help with practical problems.

Figure 1 should immediately tell us that when trying to optimize resolution, the selectivity gives us by far the biggest return on our investment. It also seems to be the gift that keeps on giving with no real “plateau” in resolution as the selectivity increases. This will be empirically obvious to most chromatographers. Next most powerful perhaps is efficiency, with a pronounced improvement in resolution as we ramp up the plate numbers. This is borne out by the industries drive over the past decade and a half to switch to narrower internal diameter columns and smaller particles to improve inherent column efficiency and the improved pump hardware which is required to cope with the increased back pressures created as we reduce the particle diameter of the stationary phase. Least effective of all in improving resolution is retention factor, which seems to rapidly improve from k values of 0 to 5 and then hit a definite plateau that coincides with the point at which band broadening due to diffusion counteracts any gains in separation factor. This is true for isocratic separations, but I’ll talk more later on how useful k values can be in gradient analysis. OK, so that describes what is shown in Figure 1, but how can we translate this into action plans for getting out of chromatographic dire straits?
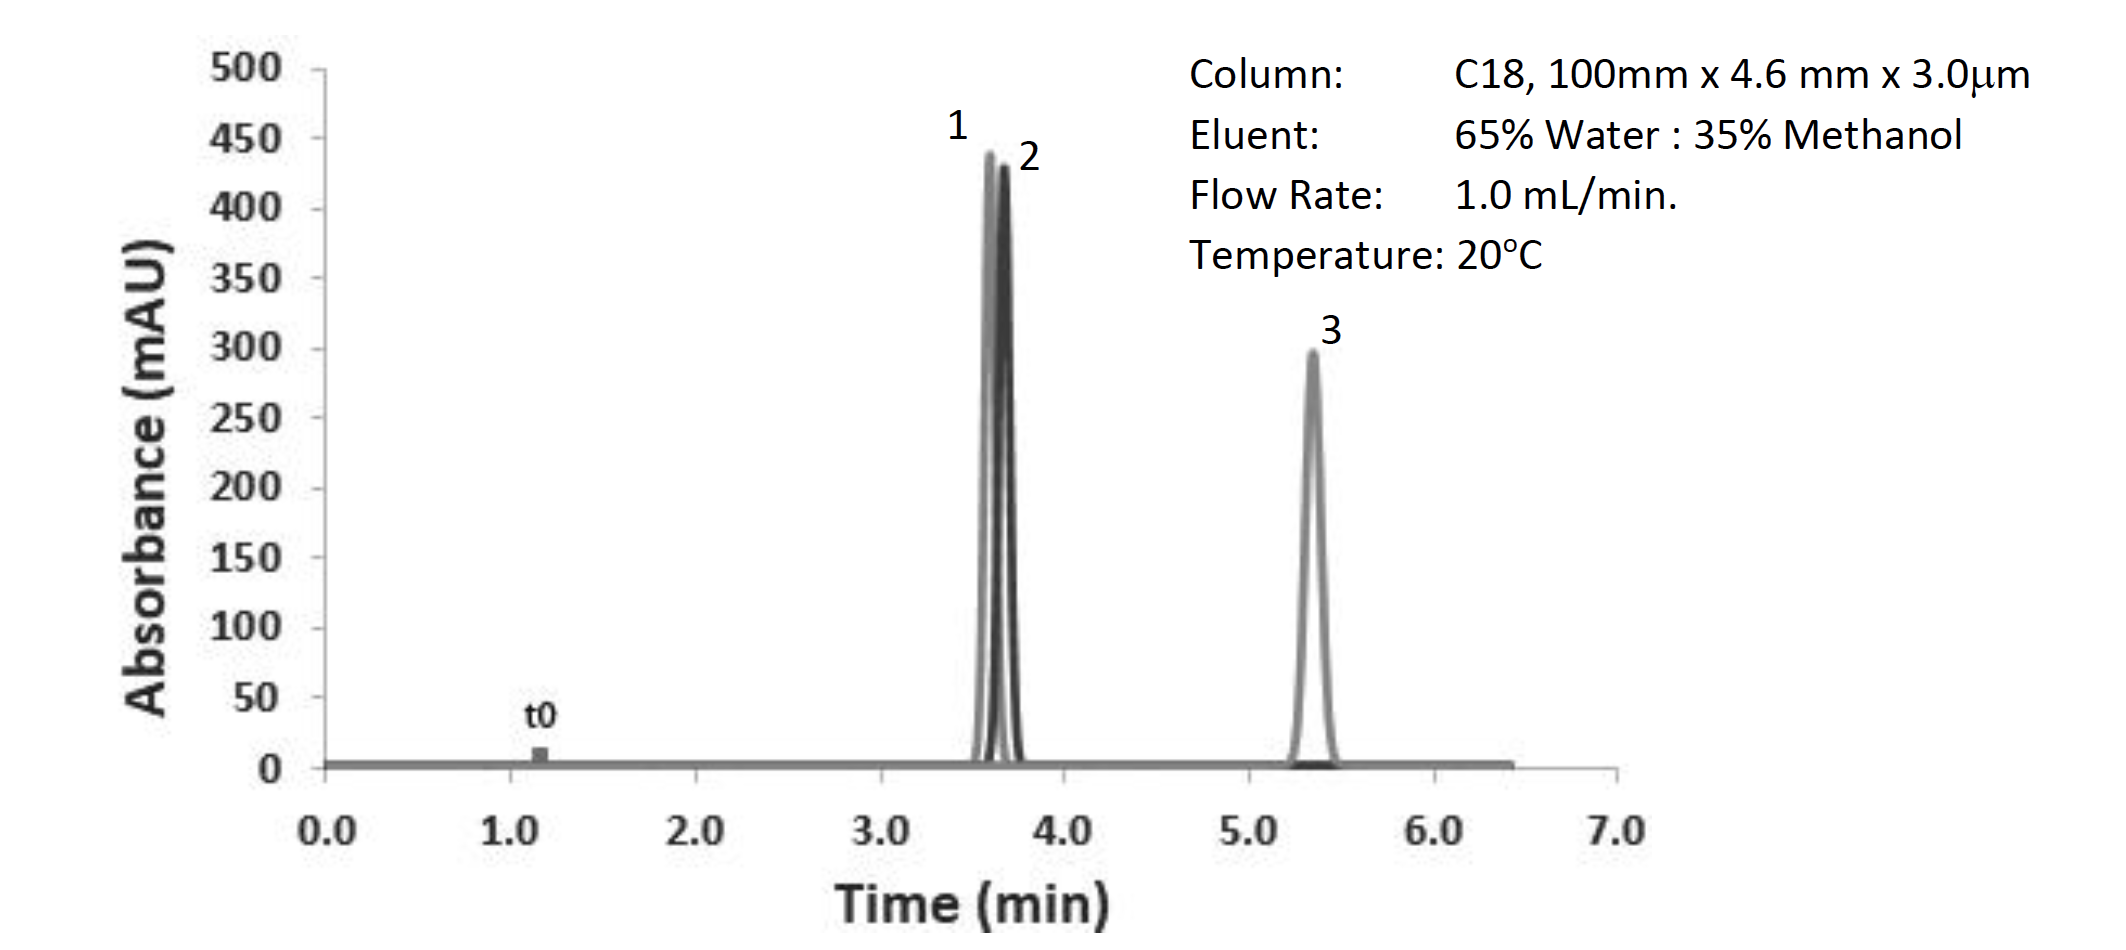
Let’s suppose we have an isocratic separation as shown in Figure 2. What’s the most efficient way to tackle this problem?
Figure 2: Separation of neutral test probes (LogP(1) – 2.0, LogP(2) – 2.4, LogP(3) – 3.0), other conditions shown in the figure

Clearly, we have a separation issue between the first two peaks within the chromatogram and need to think about how to improve the separation. We have seen that changing the selectivity of the separation makes a big impact on resolution, so how can that be done in this case? Well, my own personal golden rules of selectivity optimization follow a “lazy chromatographers” pathway:
- Optimize the % organic modifier
- Optimize temperature
- Optimize eluent pH (for ionizable analytes)
- Change the stationary phase
Why do I put such a big-hitting selectivity variable, such as the stationary-phase chemistry, last? Well, I’m lazy, and I’d like to see if I can get the separation done with the variables at hand, without having the change the column. And it’s not just about choosing a different phase, equilibrating the new column, and performing an injection. What if the new phase doesn’t work? Remember there are around 200 C18 stationary phases on the market to choose from, and they will all (or close to all), give a different selectivity. You might get lucky. You might not!
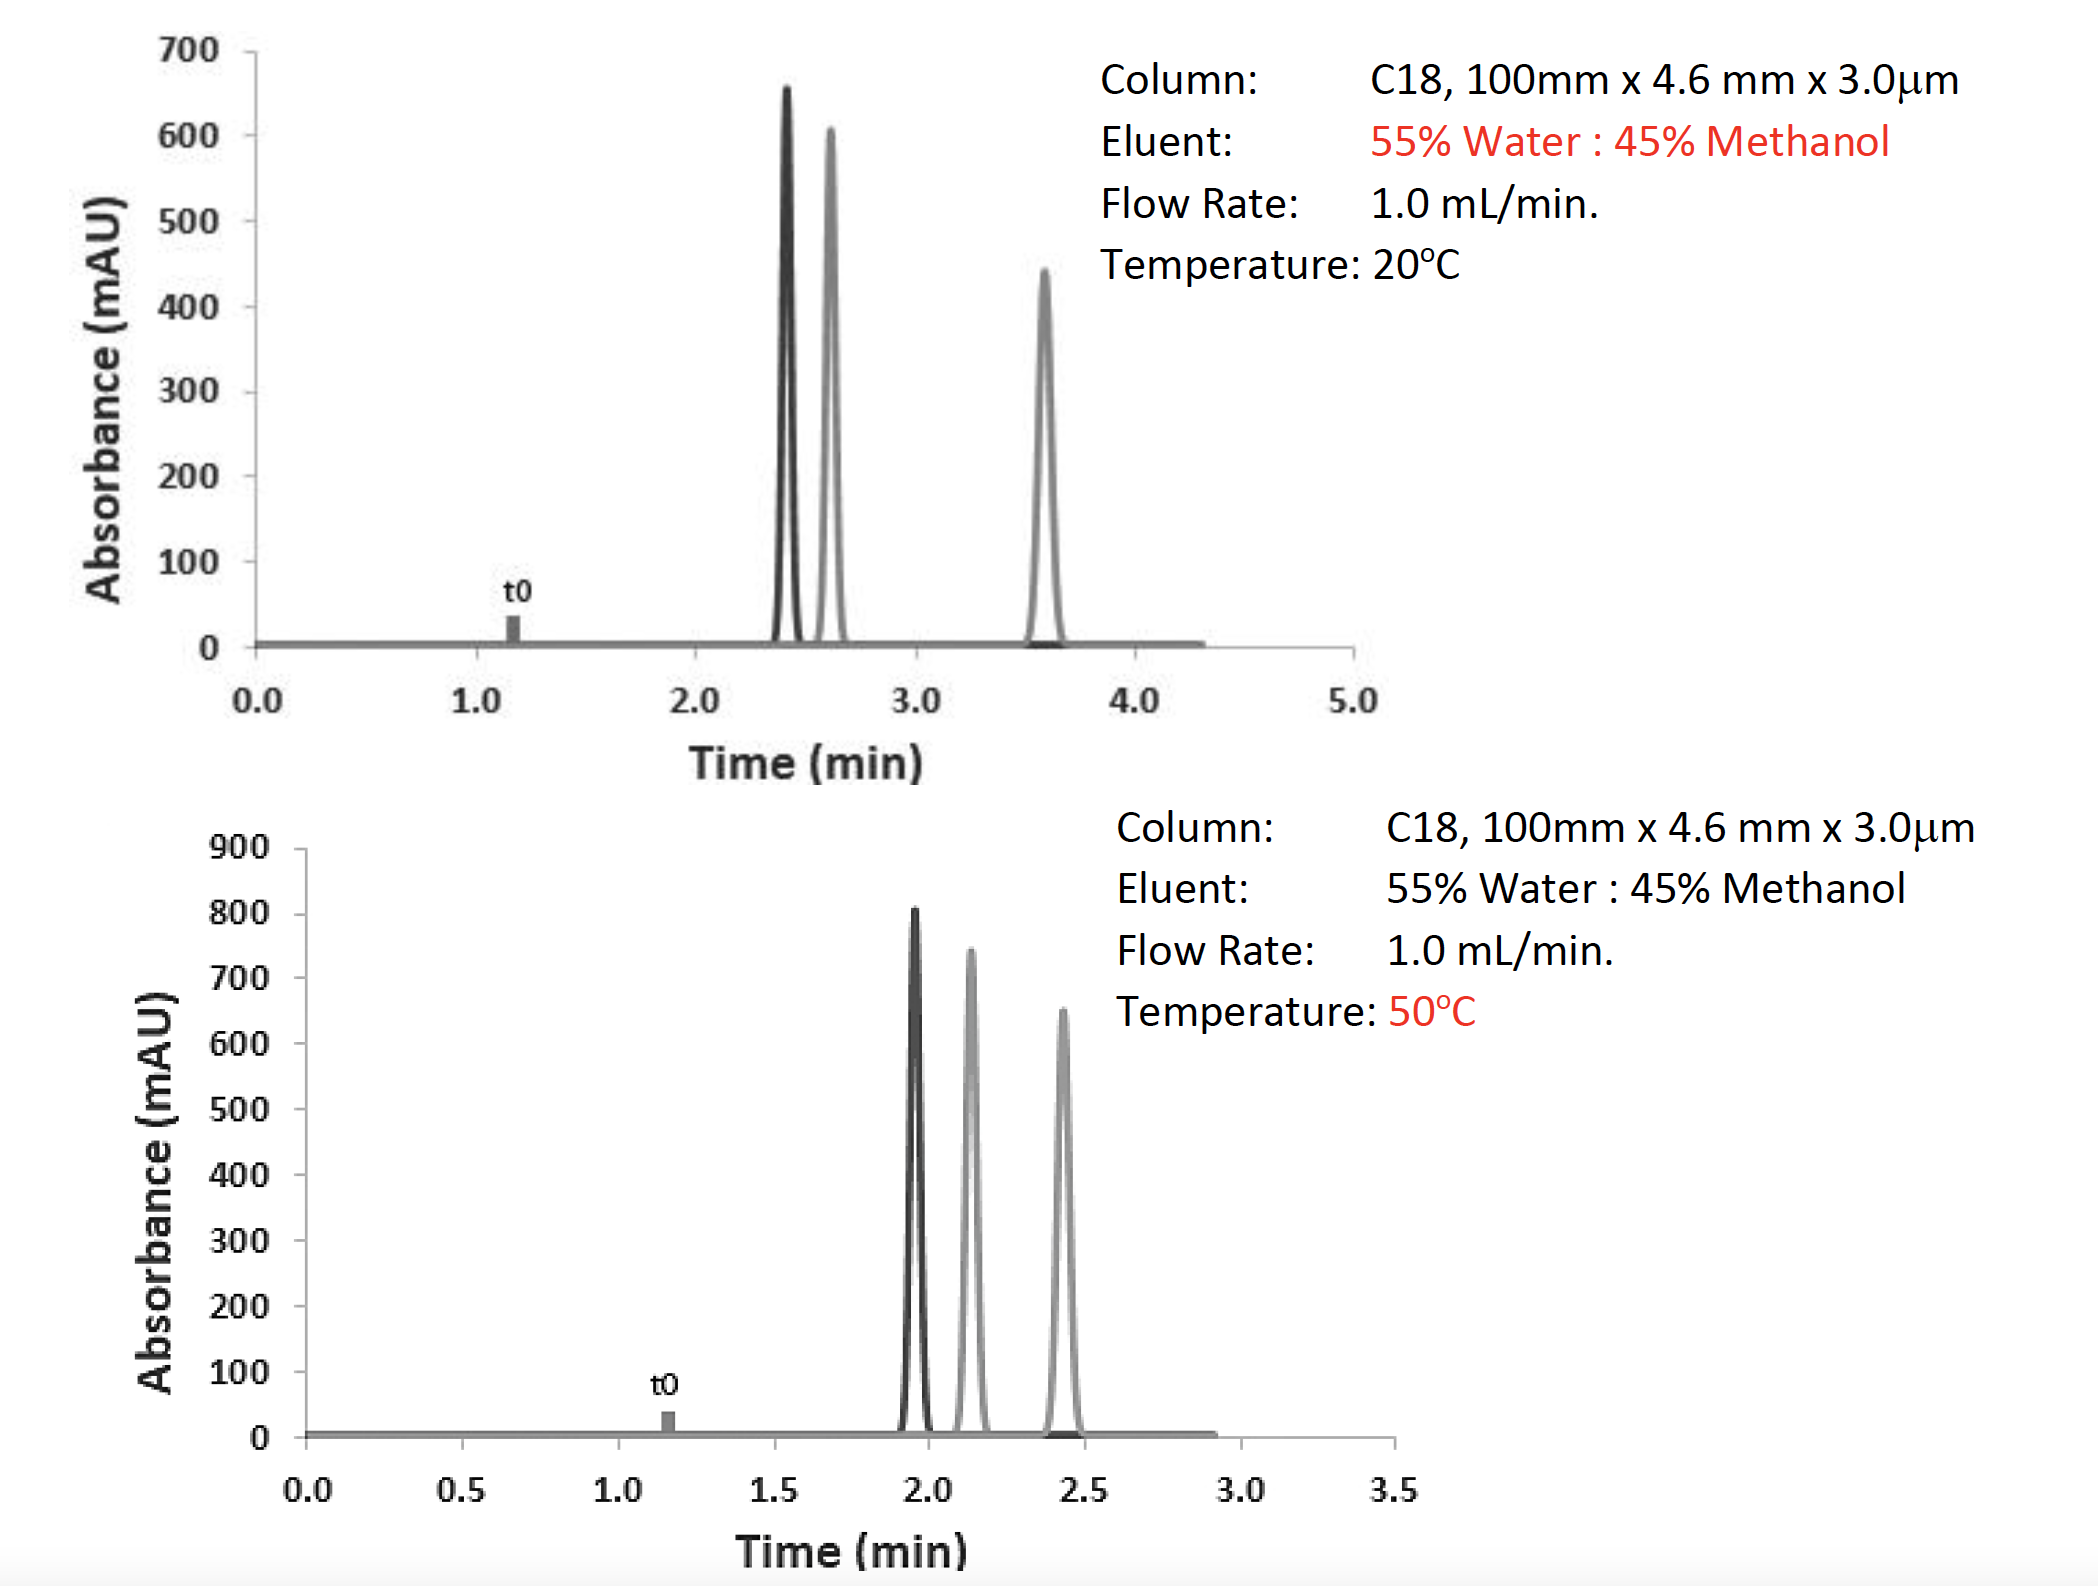
Figure 3: Optimization of the separation from Figure 2 using eluent isotropic strength (top) and temperature (bottom).

As can be seen from Figure 3, by following my rules of thumb, I managed to affect a good resolution for the separation in a very reasonable analysis time. I increased the % methanol as a first intent, because lowering it just gives me longer analysis time, and if I can get away with a faster analysis, then so much the better. The same is true with temperature. Higher temperatures give faster separations, although I should note that I got a little lucky with this separation, and temperature doesn’t always have such a profound effect on the separation of non-ionogenic analytes. All of this was achieved simply by changing settings in the data system. I didn’t touch the HPLC at any time during this optimization, only the data system.
Of course, if I was dealing with ionizable analytes, I could have gone on to optimize the eluent pH. But I wasn’t, primarily because I wanted to keep this article a little shorter! One could argue that optimizing eluent pH and changing the stationary phase are both complex and can be iterative processes if optimization software isn’t used. And that would be right, but I bet these very processes are going around in laboratories all over the world, right now. For pH optimization I would urge the reader to select one of the analytes in the mixture, find out its pKa value, and then adjust eluent pH so that the analyte is fully non-ionized (eluent pH two units above the pka for bases and two units below the pKa for acids). This will be a good starting point for the optimization. For stationary-phase selection, use a website such as www.HPLCcolumns.org to better understand what type of stationary phase is orthogonal to your current phase. You can choose the same chemistry (such as another C18) or try a different chemistry. I would recommend the use of polar-embedded phases for lower Log P analytes, Phenyl Hexyl for aromatic analytes, and Penta Fluoro Phenyl (PFP) for analytes that are closely structurally related.
Of course, one could try to change the efficiency using a different column diameter or smaller particle size or even optimizing the eluent flow rate, but as we saw in Figure 1, it’s better to start with the big-hitting variables in order to quickly get to the result you want. On that latter point of changing flow rate, remember that capacity factor in isocratic separations does not appreciably change with flow rate as can be seen from Equation 1 for calculating k:

where tR is analyte retention (mins) and t0 is the elution time of an unretained component.
In isocratic separations, as the retention time increases or decreases with flow, so does the hold-up time (t0) and therefore we can’t expect to influence resolution or selectivity (Equation 2, the ratio of the capacity factor of two adjacent peaks) by changing flow rate.
So, what about gradient separations? Well, most of what is said above holds true with gradient-mode analysis, with the exception of capacity factor. Because the eluent composition is constantly changing in gradient separations, the capacity factor will also be changing, and this variable becomes much more useful to us, in the form of this nice equation for the “average” retention factor (k*):

Where tg is the gradient time (min), F is the eluent flow rate, D%B is the change in eluent composition expressed as decimal (such as 10–90% change in component B would be 0.8), Vm is the column eluent volume (approximately 1 mL for the column in question) and S is a shape factor that can be assumed to be 5 for small molecule applications).
This equation can be very useful in helping us to adjust the gradient parameters to see if we can affect a separation. An interesting aspect of k* in gradient HPLC, as opposed to k in isocratic HPLC, is that flow rate changes will have an effect on k*—if the flow rate is doubled, then the k* value (and hence analyte retention relative to the hold-up time) will double. Selectivity in gradient elution is defined in the same manner as in Equation 3, except that k* values for adjacent peaks are used instead of isocratic k values. It is important to note that the relative peak spacing (a) changes if only the flow-rate is changed. The same is true when altering the gradient time tg, and changes in either of these parameters can be counterbalanced by lengthening or shortening the gradient range

I’m particularly focussing on these parameters as they appeal to my inner laziness—that is, one needs to do nothing other than to make changes to the method via the computer data system and no changes need to be made to the HPLC system, column, or eluent composition. Figure 4 shows some illustrative examples:

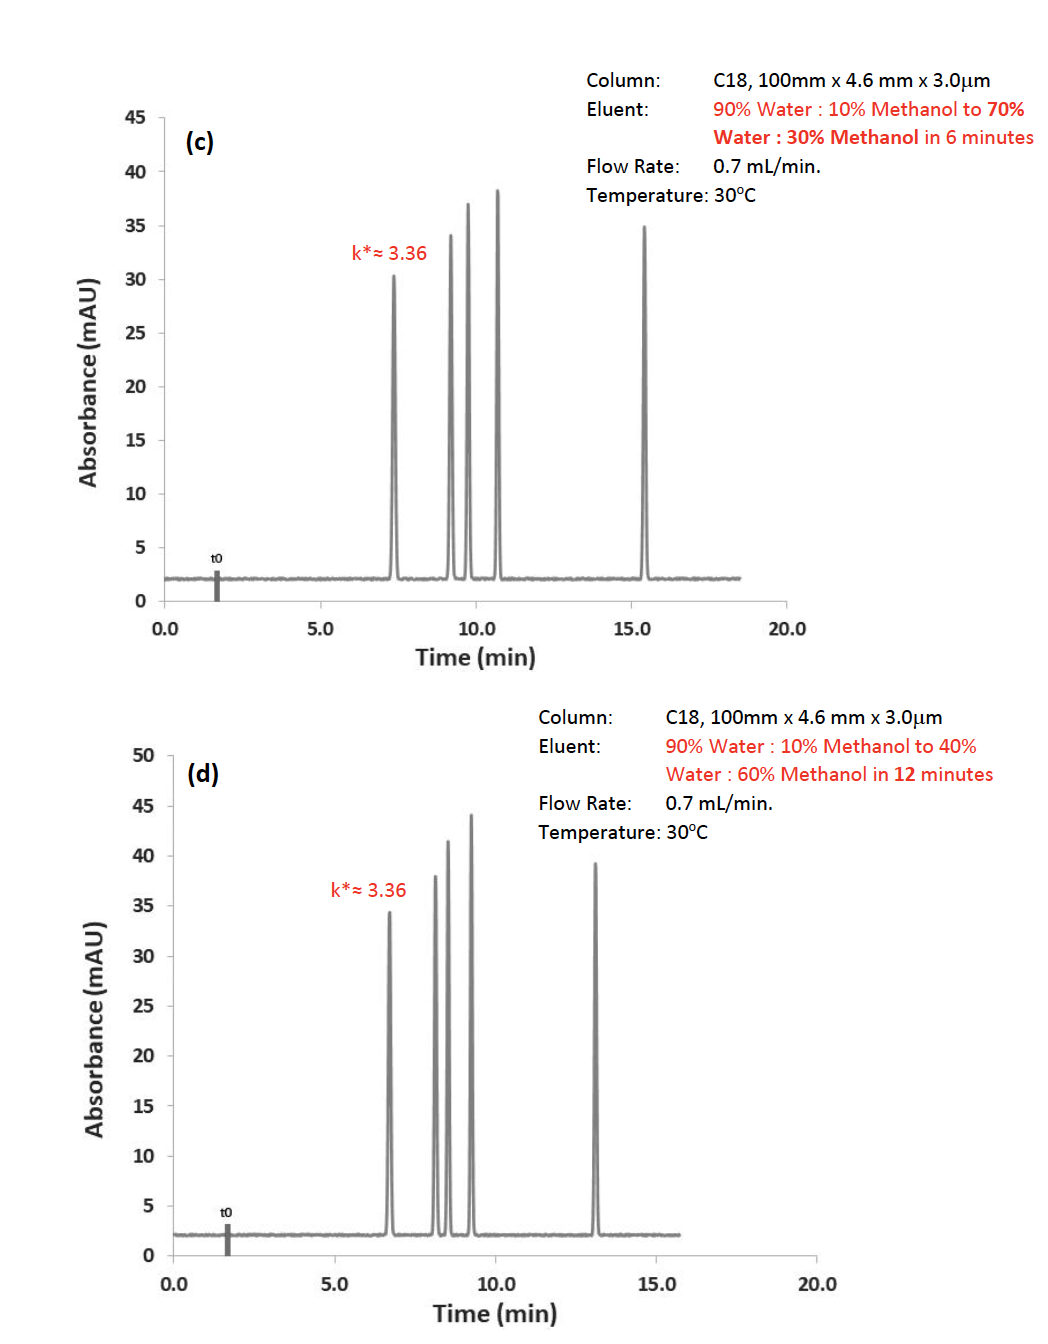
Figure 4: Separation of neutral test probes (LogP1 – 1.4, LogP2 – 1.9, LogP3 – 2.6, LogP4 – 3.0, LogP5 – 3.6), all relevant separation conditions shown on chromatograms.

Figure 4 (a) shows a gradient separation of 4 neutral test compounds of various LogP values, which isn’t quite working out as we had hoped. Using Equation 3, we first doubled the flow rate and, as can be seen, the average capacity factor (k*) of the peaks increased by a factor of two. The same effect can be seen when halving the gradient change in %B (gradient range) or doubling the gradient time.
What should be obvious is that in each case the resolution of the critical pair of peaks has improved! Figure 4 (c) is somewhat of a compromise separation in that most of the peaks are eluting in the “isocratic” phase at the end of the gradient. In practical terms, the conditions set out Figure 4(d) may be the most promising in terms of a basis for further optimization, given that most of the peaks elute within the gradient range. Of course, one might suspect that isocratic mode would have been more successful for this separation, but that will need to be reserved for a future technical tip.
I should state that this is quite a simple separation, and I did get a little lucky on this particular example, however, the fact remains that by doing not very much "practical" work, it has been possible to make some informed decisions, based on basic chromatographic relationships, which presented possible solutions for the optimization of the separation.
I realize that many of us working in HPLC don’t plan or even optimize separations based on equations. Many of us develop a “feel” for what is required through many years of experience. However, I do strongly believe that this “feel” can be very usefully backed up and even better informed when one understands and can use some of these simple relationships to understand the cause-and-effect nature of our work.
Tony Taylor

Tony Taylor is the Chief Scientific Officer of Arch Sciences Group and the Technical Director of CHROMacademy. His background is in pharmaceutical R&D and polymer chemistry, but he has spent the past 20 years in training and consulting, working with Crawford Scientific Group clients to ensure they attain the very best analytical science possible. He has trained and consulted with thousands of analytical chemists globally and is passionate about professional development in separation science, developing CHROMacademy as a means to provide high-quality online education to analytical chemists. His current research interests include HPLC column selectivity codification, advanced automated sample preparation, and LC–MS and GC–MS for materials characterization, especially in the field of extractables and leachables analysis.
Study Explores Thin-Film Extraction of Biogenic Amines via HPLC-MS/MS
March 27th 2025Scientists from Tabriz University and the University of Tabriz explored cellulose acetate-UiO-66-COOH as an affordable coating sorbent for thin film extraction of biogenic amines from cheese and alcohol-free beverages using HPLC-MS/MS.


