The Benefits of Multi‐angle Light Scattering for Size‐Exclusion Chromatography
Analytical size-exclusion chromatography (SEC) often suffers from several limitations. This article shows how some of these limitations can be partly (or even completely) resolved by a multi-angle light scattering (MALS) detector for the determination of molar mass distributions of synthetic and natural polymers.
Size‐exclusion chromatography (SEC) is the most frequently used chromatographic technique for the characterization of natural and synthetic polymers. However, conventional SEC, which uses a single concentration‐sensitive detector, may suffer from limitations and drawbacks that lead to incorrect or even mystifying information about the investigated polymer samples. The addition of a multi‐angle light scattering (MALS) photometer can reveal undesirable separation results in SEC, and determine molar mass correctly despite these effects. MALS also provides vital information about macromolecular topology and size in dilute solution. The enhancement of SEC analysis by MALS is demonstrated with several practical examples.
It has often been stated that size‐exclusion chromatography (SEC) is the most frequently used technique for the determination of molar mass distributions and molar mass averages of polymer samples of both natural and synthetic origin. Indeed, other classical techniques, such as solubility‐based fractionation, ultracentrifugation, membrane and vapour phase osmometry, classical light scattering of unfractionated samples, and conventional viscometry, play a marginal role in routine polymer characterization. The popularity of SEC has benefitted from technological development in other liquid chromatography techniques, and is driven by its relative simplicity, short analysis time, low sample demand and good repeatability. However, analytical SEC often suffers from several limitations that are overlooked or even knowingly ignored. These limitations result in erroneous and sometimes confusing results that can further lead to incorrect scientific or technological conclusions. An excellent critical review of the drawbacks and pitfalls of the method was given in reference (1). The purpose of this paper is to show how some of these undesirable SEC phenomena can be not only revealed, but also partly or even completely resolved by a multi-angle light scattering (MALS) detector.
The fundamentals of MALS and its combination with SEC are found in the literature (1,2). The MALS detector, connected to an SEC chromatographic system, directly measures the molar mass and the root‐mean‐square (RMS) radius (also called radius of gyration, Rg) of polymer molecules eluting from SEC columns. Molar mass is determined from the intensity of scattered light at zero scattering angle along with the concentration; intensity at zero angle is obtained by the extrapolation to zero of intensities measured at several different angles, and concentration is typically measured with a differential refractometer (RI detector) in‐line with the MALS detector. RMS radius is calculated from the slope of angular variation of the scattered light intensity.
Readings are taken at regular time intervals or “slices”, typically one second. In an efficient SEC separation, it is generally assumed that each slice contains molecules of identical molar mass, or at least of very narrow dispersity. The molar masses and concentrations obtained at consecutive slices are used for the calculation of molar mass distribution and molar mass averages. In contrast to conventional SEC, where the molar mass is always relative to calibration standards, molar mass values obtained by MALS are absolute, that is, based on the theoretical, first‐principles relation between the molar mass, the intensity of scattered light, and the concentration. Hence SEC–MALS analysis is completely independent of elution volume. In addition to molar mass distributions, the structural arrangement of polymer coils can be estimated from the log−log relation between the RMS radius and molar mass. If a linear counterpart of the same chemical composition is available, SEC–MALS data enable calculation of the number of branch units in randomly branched polymers, or the number of arms in star branched polymers.
With this introduction, we now proceed to review some common examples that illustrate the pitfalls of conventional SEC and how they are overcome with SEC‐MALS.
Experimental
The results presented in this paper were acquired with a DAWN MALS photometer and an Optilab RI detector and processed with Astra 7 software, all from Wyatt Technology. The SEC system consisted of an Agilent 1260 Infinity II high performance liquid chromatography (HPLC) instrument with two PLgel Mixed‐C 300 × 7.5 mm columns. The mobile phase was either tetrahydrofuran at a flow rate of 1 mL/min or dimethyl sulfoxide (DMSO) with 0.2% lithium bromide (LiBr) at a flow rate of 0.5 mL/min. The samples were prepared in the mobile phase at a concentration of ≈ 2.5–5 mg/mL, filtered with 0.45 μm filters and injected in the volume of 100 μL.
Results and Discussion
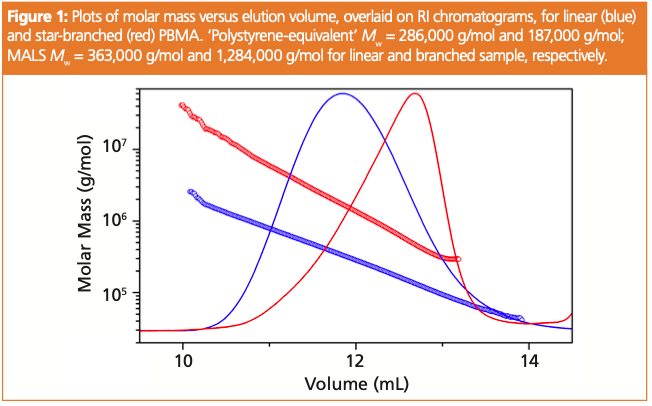
A vivid example of how confusing the column calibration‐based molar mass distribution can be is shown in Figure 1, which depicts plots of molar mass
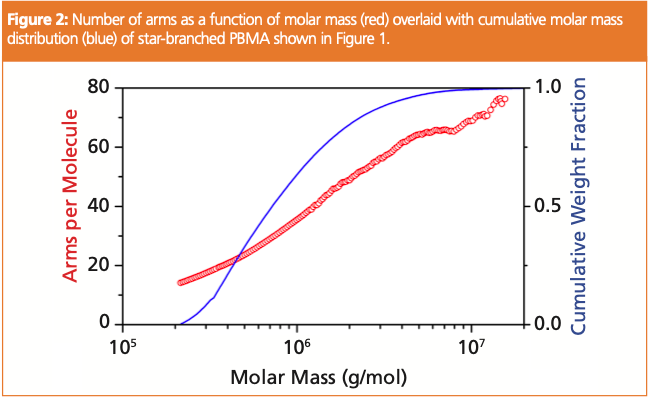
vs. elution volume for two samples of poly(butyl methacrylate) (PBMA)—one linear and one star‐shaped with multiple arms. Even if the calibration had been appropriate for PBMA, conventional SEC would have yielded a completely false molar mass distribution of the star‐branched sample, without any indication of the error or evidence of its branched topology. MALS not only provides a true molar mass distribution, but SEC–MALS data can be further analyzed to calculate the number of arms as a function of molar mass (Figure 2).
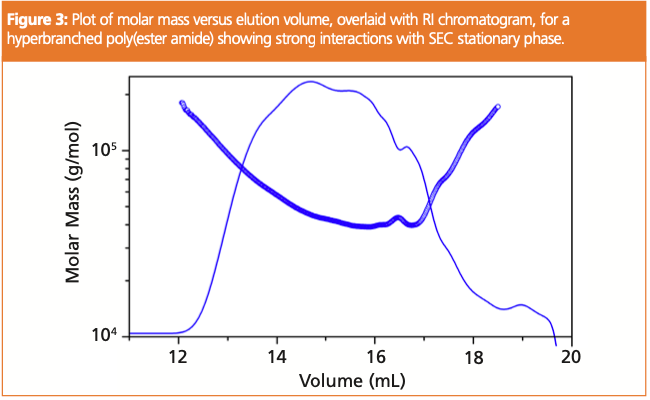
Non‐ideal elution can cause significant error in conventional SEC. Figure 3 depicts the plot of molar mass against elution volume overlaid on the RI chromatogram of a hyperbranched poly(ester‐amide). In contrast to conventional SEC theory and the molar mass plots shown in Figure 1, here the molar mass does not decrease evenly across the entire chromatogram, or even monotonically. With increasing elution volume, we initially observe a decline and then a minimum, followed by increasing molar mass at the end of chromatogram in the nominal “low molar mass” region. This behaviour reveals strong interactions between the eluting macromolecules and SEC stationary phase. In addition to enthalpic interactions, mechanical anchoring of the arms in the pores of SEC packing likely contributes to the delayed elution of the sample. In such cases of strong non‐SEC separation mechanisms, conventional SEC cannot in principle provide any molar mass results, not even relative to the column calibration established by calibration standards. However, since light scattering from a polydisperse, unfractionated sample yields the weight‐average molar mass (Mw), the value of Mw averaged by SEC–MALS analysis across the chromatogram can
still be assumed correct, despite poor separation. The only assumption required is 100% mass recovery of the sample from the SEC columns, which is easily checked by comparing the injected mass with the total eluted mass calculated from the RI signal.
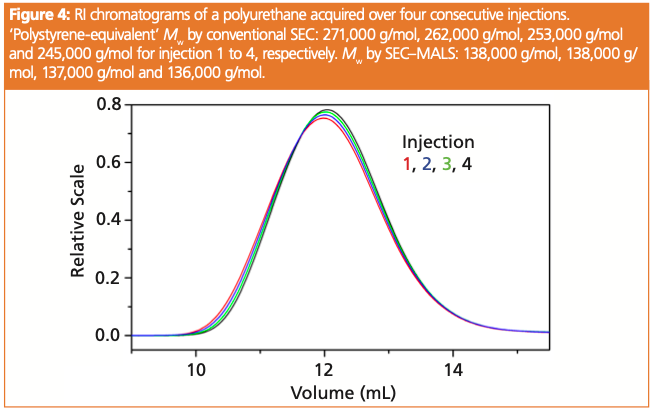
Conventional SEC analysis is dependent on repeatable chromatography. Figure 4 overlays four RI chromatograms recorded by consecutive injections of a sample of polyurethane. The chromatograms reveal a systematic shift of the chromatograms towards higher elution volumes. Consequentially, the “polystyrene‐equivalent” molar masses, determined from conventional SEC using polystyrene standards for calibration, decrease with successive injections from 286,000 g/mol to 187,000 g/mol. MALS does not depend on elution volume for the molar mass determination, with the results that Mw values of all four injections are essentially identical. It is worth noting that this type of drift in elution behaviour is quite common for various polyurethanes and has been observed for other polymers as well.
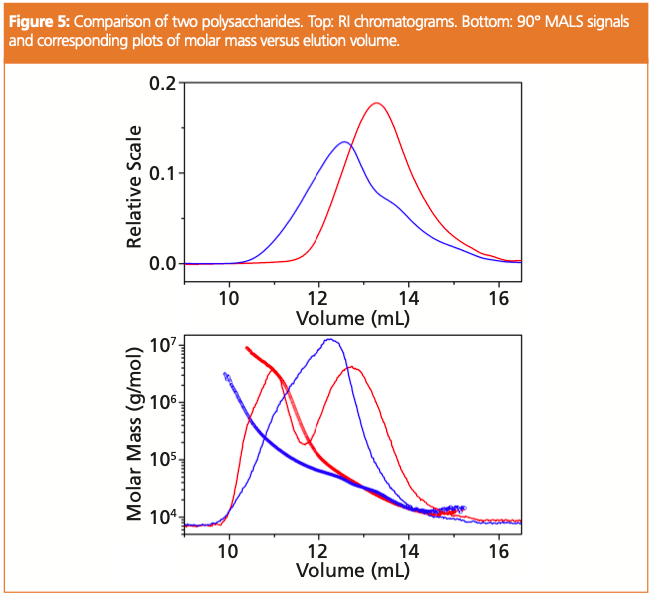
MALS is exquisitely sensitive to molecules with high molar mass. Figure
5 compares the SEC and SEC‐MALS measurements of two polysaccharides. Based solely on the RI chromatograms, one would evaluate the blue sample as having higher molar mass. However, the high MALS signal intensity during early elution of the red sample, and the corresponding molar mass plots, disclose the presence of high‐molar‐mass fractions. With a response that is proportional to the product of molar mass and concentration, the ability to detect even trace amounts of ultra‐high‐molar‐mass species such as aggregates or highly branched macromolecules is one of the key advantages of MALS detection. In this particular case MALS not only provides correct molar masses of the two samples, but also shows their markedly different molecular topology in the high molar mass region—the macromolecules of the red sample being markedly more compact, that is, most likely more branched.
Conclusions
The addition of a MALS detector and the transition to elution‐independent analysis makes SEC an absolute method for the determination of molar mass distributions of synthetic and natural polymers. In addition, it enables unbiased evaluation of SEC performance by revealing non‐ideal SEC separation. Even in the case of poorly separated samples, SEC– MALS provides correct weight‐average molar mass results. The presence of ultrahigh‐molar‐mass species can be detected with extremely high sensitivity that is unmatchable by traditional RI detection. SEC–MALS analysis further provides information about the structure of polymer chains and avoids the false conclusions that might be drawn from conventional SEC analysis. The blessings of MALS for polymer analysis are sure to continue to spread in analytical laboratories.
References
1. D. Berek, J. Sep. Sci. 33, 315–335 (2010).
2. P.J. Wyatt, Anal. Chim. Acta 272(1), 1–40 (1993).
3. S. Podzimek, Light Scattering, Size Exclusion Chromatography and Asymmetric Flow Field Flow Fractionation (Wiley, Hoboken, New Jersey, USA, 2011).
Stepan Podzimek is a scientific consultant for Wyatt Technology with research interests focused on the characterization of molecular structure of synthetic and natural polymers by means of separation techniques with light scattering and viscometric detectors. He also heads the Department of Analytical and Physical Chemistry at Synpo, a Czech R&D company conducting contract research in synthetic polymers and related materials, and holds a professorial position at the Institute of Chemistry and Technology of Macromolecular Materials at the University of Pardubice, Czech Republic.
E-mail: stepan.podzimek@wyatt.eu
Website: www.wyatt.com

Characterizing Polyamides Using Reversed-Phase Liquid Chromatography
May 5th 2025Polyamides can be difficult to characterize, despite their use in various aspects of everyday life. Vrije Universiteit Amsterdam researchers hoped to address this using a reversed-phase liquid chromatography (RPLC)-based approach.
Characterizing Plant Polysaccharides Using Size-Exclusion Chromatography
April 4th 2025With green chemistry becoming more standardized, Leena Pitkänen of Aalto University analyzed how useful size-exclusion chromatography (SEC) and asymmetric flow field-flow fractionation (AF4) could be in characterizing plant polysaccharides.
Rethinking Chromatography Workflows with AI and Machine Learning
April 1st 2025Interest in applying artificial intelligence (AI) and machine learning (ML) to chromatography is greater than ever. In this article, we discuss data-related barriers to accomplishing this goal and how rethinking chromatography data systems can overcome them.
Influence of Concentration in Conventional GPC/SEC and Advanced Detection GPC/SEC
March 21st 2025Sample concentration is a parameter that can influence the quality of gel permeation chromatography/size-exclusion chromatography (GPC/SEC) separations and the obtained results. Understanding this influence can help to support the development of reliable GPC/SEC methods.

.png&w=3840&q=75)

.png&w=3840&q=75)


.png&w=3840&q=75)


.png&w=3840&q=75)


