Readers’ Questions: Gradient Ghost Peaks
LCGC North America
Interfering peaks or high baseline background can compromise the results of gradient LC separations.
Interfering peaks or high baseline background can compromise the results of gradient liquid chromatography (LC) separations.
I regularly receive questions via e-mail from readers of “LC Troubleshooting” (to send me a question, contact me at the e-mail shown below with my biographical summary). I try to answer these questions at the time I receive them, or if I cannot answer the question I try to send the reader to another source, such as a written reference, a web source, or another expert. From time to time, as I purge my mailbox, I pick several of these questions that are likely to be of general interest to the readership of LCGC. For this month’s discussion, I’ve chosen two questions, centered around unwanted peaks in gradient methods.
Those Elusive Ghost Peaks in Gradients
Two readers had problems which require similar troubleshooting strategies. The first (R.H.) was running a reversed-phase gradient liquid chromatography (LC) method. He observed a peak that was eluted at a retention time that interfered with the active ingredient of a drug formulation being investigated. The peak was present in injections of blank sample diluent when no reference standard or sample was present. He also observed that the peak intensity varied between batches of mobile phase or when different grades of reagent were used. The second question (from S.K.) also involved a gradient LC method and was run at a detector wavelength of 210 nm. The mobile phase contained sodium lauryl sulfate (SLS), for which a solution was prepared, then filtered through a 0.2-µm porosity nylon-66 membrane filter before use. The SLS was “extra pure,” with a stated purity of >99.0%. When a blank gradient was run, the baseline was not sufficiently stable at the retention time of interest to allow analysis. It was not clear in the e-mail interaction if the blank gradient was with or without injection of sample. Unfortunately, as is often the case for e-mail communications, after a few interactions with each reader, I never heard if my advice helped them identify the definitive problem source so that the problem could be eliminated. (Note to readers: Please “complete the loop” with me-after I’ve invested my time in such troubleshooting activities, I would really like to know the final outcome of a problem I’ve helped with.)
Divide and Conquer
As with most troubleshooting activities, I find that the “divide-and-conquer” strategy is a very useful approach to isolating the problem source for situations like these. This strategy is quite simple-just do a mental or physical experiment designed to eliminate as many potential problem sources as possible, thus reducing the number of possibilities that need more attention. In the present examples, I notice a few common threads. First, the problem peak or noisy baseline occurs when no sample or standard is injected. This allows me to eliminate the analyte or sample matrix as the likely problem source. Also, I know that both methods are gradients. In my experience, problems with extra peaks (“ghost peaks”) in blank gradients usually are related to contaminants in the mobile phase or injection solvent.
A few more mental experiments will help me save time and perhaps refine my approach. The first reader (R.H.) made blank injections in sample diluent. This means that the diluent could be the source of the problems, so it might be fruitful to run a no-injection, blank gradient just to verify that the problem still exists. If the problem disappeared, the diluent or injection process would be the source of the problem-it would be silly to go to the work of the gradient tests discussed below if the problem could be isolated so easily to another source.
In the second case, S.K. was using SLS. I’m not sure why it was added, but SLS can act as an ion-pairing reagent. Ion pairing and gradient elution generally are not a good combination because the slow equilibration of the ion-pairing reagent and the column means that the system is never fully equilibrated. I also note that the SLS is not 100% pure, so impurities from the SLS are possible sources of the observed problems. If it were my problem, I would keep this possibility in mind throughout the troubleshooting process.
Three-Gradient Test
The first step in the isolation of the source of ghost peaks in gradients is to run a series of three blank gradients using what my business partner, Tom Jupille, refers to as the three-gradient test. This test takes advantage of the tendency of reversed-phase gradients to concentrate nonpolar contaminants during the equilibration phase of a gradient and then release them during the actual gradient. An oversimplified description of gradient elution is that sample components stick at the inlet of the column until a strong enough solvent comes along to wash them through the column. This means that the column can concentrate impurities from the initial mobile phase during equilibration; these impurities will be released during the gradient and appear as peaks in the gradient. That is, the gradient doesn’t “know” if the peaks originate in the sample or in the weak mobile phase.
To perform this test, a series of three gradient programs is run. The first two programs are identical-for example, a 10-min equilibration followed by the normal gradient ramp. For the third gradient program, increase the equilibration time by threefold-for example, to 30 min-followed by the normal gradient ramp. Run these three programs consecutively without injecting anything (zero-volume injection) and record the baselines. It is very difficult to control the true equilibration of the first run, because it includes the programmed equilibration time plus any time the system was running before starting the program. So discard the first run and compare the second two. If the background or problem peak in the chromatograms increases from the second to third blank run in the same proportion as the increase in equilibration, the source of the problem is the A-solvent.
An example of the three-gradient test is shown in Figure 1 (only the second two chromatograms are shown). The standard method comprises a 10-min equilibration at 5% B followed by injection and the start of a gradient of 5–83% B gradient in 13 min followed by a 5-min hold. The A-solvent is 0.1% trifluoroacetic acid; 0.1% trifluoroacetic acid in acetonitrile is the B-solvent. So the first two runs were programmed as a 10-min equilibration followed by a 13-min gradient and a 5-min hold. The third run was identical except that the equilibration between the second and third run was increased by threefold to 30 min. As you can see, the background peaks increase approximately threefold between the 10-min (Figure 1a) and 30-min (Figure 1b) runs. This increase tells us that the problem peaks are associated with the A-solvent.
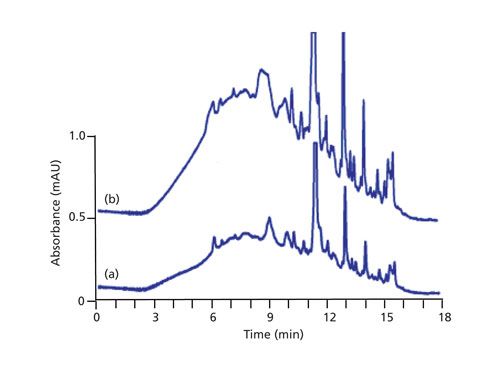
Figure 1: Comparison of gradient background peaks in no-injection blank gradients using the three-gradient test (runs 2 and 3 shown): (a) 10-min equilibration; (b) 30-min equilibration. Column: 150 mm × 4.6 mm C18; A-solvent: 0.1% trifluoroacetic acid in water; B-solvent: 0.1% trifuoroacetic acid in acetonitrile; gradient: equilibration followed by blank gradient of 5–83% B in 13 min plus a 5-min hold at 83% B; flow rate: 1.5 mL/min; column temperature: 35 °C; detection: UV absorbance at 255 nm. Adapted from Figure 1 in reference 1.
Because the source of the ghost peaks as described by the two readers is almost always in the mobile-phase reagents, I’ve assumed that this is true in the present cases. The next step, then, is to further apply the divide-and-conquer strategy to further isolate the problem source. In the first case, R.H. indicated that the problem peak changed intensity with different batches of mobile phase and different sources of reagents. In the second case, S.K. indicated that he suspected the nylon mobile-phase filter, but also indicated that the mobile phase contained SLS with a purity of >99.0%. Note, however, that >99.0% impurity implies that the impurities can amount to up to 1%-plenty to cause chromatographic problems. Next, we have to systematically eliminate one potential source of the problem at the time. One approach would be to compare mobile phase prepared from different buffer sources. Or compare an SLS source of higher purity with the >99.0% one. Or we could eliminate a reagent or a process step, such as skipping filtration of the mobile phase through the nylon filter to eliminate the filter (and associated glassware). Be sure to follow the “Rule of One,” which guides us to change just one thing at a time so that it is easy to identify the real problem source.
Often the source of ghost peaks is one of the reagents, such as the buffer. This could be the result of contamination of a reagent in the laboratory because of a poor laboratory practice, such as dipping into a reagent container instead of pouring from it or using glassware that is not properly cleaned. In other cases, there may be inherent contamination in the buffer, such as the possible 1% contamination of the SLS mentioned above. An example of differences between buffer sources is shown in Figure 2 (1). The top four chromatograms (Figures 2a–d) show identical conditions (for example, run 2 or 3 of the three-gradient test) for four different sources of phosphate buffer. The bottom chromatogram (Figure 2e) is a modified mobile phase in which no buffer is used. Two observations are apparent in the data of Figure 2. First, all the buffers generate peaks that are not present in the buffer-free method. Second, all buffers show some common peaks (for example, at ~13 and ~17 min), although with different intensity, and some buffers contain peaks that are absent in other buffers.
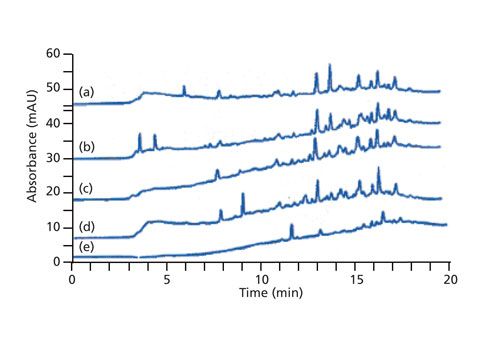
Figure 2: Comparison of gradient background peaks in no-injection gradients for different sources of buffer using the three-gradient test (run three of each sequence shown): (a–d) gradients with four different sources of phosphate reagents; (e) same as a–d, with no buffer, only HPLC-grade water as “buffer.” A pH 7.0 10 mM phosphate buffer was prepared by blending 10 mM monobasic potassium phosphate with 10 mM dibasic potassium phosphate. Column: 150 mm × 4.6 mm C18 column; A-solvent: 5:95 (v/v) acetonitrile–buffer; B-solvent: 80:20 (v/v) acetonitrile-buffer: gradient: 30-min equilibration followed by blank gradient of 0–100% B in 15 min plus a 5-min hold at 100% B; flow rate: 1.5 mL/min; column temperature: 30 °C; detection: UV absorbance at 215 nm. Adapted from Figure 2 in reference 2.
To further isolate the source of the extra peaks in the buffers of Figure 2, we first had to determine what they had in common: all had been filtered, all had the pH adjusted, and all had been degassed by helium sparging. Each of these steps was eliminated or changed (divide-and-conquer) in a one-at-a-time process (rule of one). In this case, the extra peaks were present only when the pH meter probe was dipped in the buffer during pH adjustment. Figure 3a (1) shows the baseline when the pH meter was allowed to contact the bulk buffer. Notice the difference when this run is compared to the same conditions, except that an aliquot of the buffer was poured off to check the pH and then discarded, so the pH probe never contacted the buffer that would be used in the LC system (Figure 3b). This rather involved (and expensive) troubleshooting process caused us to change our laboratory practice to eliminate contact of the pH probe with any buffer to be used as mobile phase.
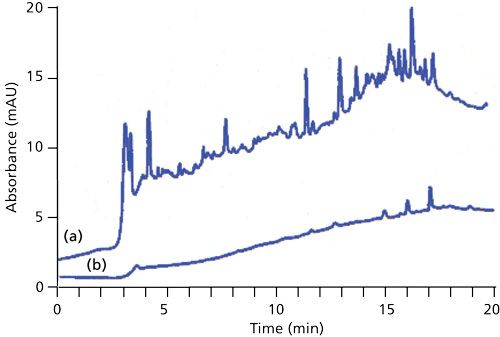
Figure 3: Comparison of chromatograms (general conditions as in Figures 2a–d) of (a) contaminated buffer; (b) buffer prepared in extra-clean glassware and without contacting the pH meter probe. Adapted from Figure 4 in reference 2.
In my experience, gradient ghost peaks most commonly arise from contaminated reagents, either created (or not eliminated) during manufacturing or inadvertently added in the laboratory, as was the case for the problem shown in Figures 2 and 3. Usually we trust high performance LC grade (HPLC-grade) reagents because of the high standard of purity ascribed to such reagents. It is rare today to have HPLC-grade acetonitrile or methanol be the source of extra peaks, but small peaks occasionally originate from these reagents. However, it is more common that HPLC-grade water can be the problem source, especially if it is generated in the laboratory, as is the usual practice. A well-maintained HPLC-grade water purification unit rarely fails, but problems can arise if the filter cartridges are installed in the wrong order or if the feed water is not of sufficient quality. Some laboratories use distilled or reverse-osmosis (RO) water or water from other sources as mobile phase water. This may not cause problems for isocratic methods or even gradient methods where detection limits are not of concern, such as content uniformity methods, but HPLC-grade water generally gives superior results for gradients. The simple way to check for potential water problems is to substitute one water source for another and compare them using the three-gradient test. For the problem in Figure 1, in a stepwise fashion we carefully eliminated the potential contributors to extra peaks. These included filtration, degassing, the column, the instrument, the operator, and glassware cleanliness (which was a minor source of ghost peaks, easily corrected by adding an additional solvent rinse before use). Finally, we tried a different water source-distilled water purchased at a local convenience store. In Figure 4, it is easy to see that the steam-iron grade distilled water (Figure 4b) was not perfect, but it was superior to the HPLC-grade water generated in the laboratory (Figure 4a)! This actually was not a surprise, because we knew we had a corroded pipe in our water supply system and suspected that it was the source of the ghost peaks. We did devise a work-around for the problem, but we ended up moving to a new laboratory building before the water problem was completely solved.
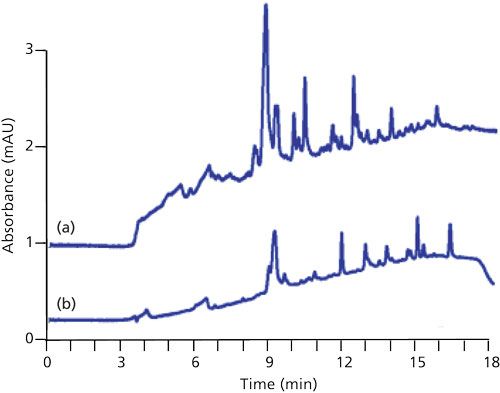
Figure 4: Comparison of gradient background peaks in no-injection gradients for different sources of water using the three-gradient test (run three of each sequence shown): (a) gradient using laboratory-prepared, contaminated HPLC-grade water; (b) steam-iron grade distilled water. A-solvent: water; B-solvent: HPLC-grade acetonitrile; gradient: 30-min equilibration followed by blank gradient of 0–83% B in 13 min plus 5-min hold at 83% B. Other conditions were as in Figure 1. Adapted from Figure 3 in reference 1.
One final comment here is that we shouldn’t automatically dismiss a particular reagent quality as unsuitable. I remember visiting China a few years ago and being startled that several laboratories we visited used bottled drinking water as their water source. I commented about this to my host from one of the instrument companies. He said this was a common practice and pulled out his laptop and showed me a comparison of blank gradients with several different brands of bottled water compared to one manufacturer’s HPLC-grade water-several of the drinking water sources were better than the HPLC-grade water!
Conclusions
The three-gradient test is a powerful tool that can help to identify the source of ghost peaks in gradient LC methods. As LC methods continue to move to lower and lower detection limits, problems with ghost peaks in gradients will only become more common. Be sure to consider the absolute peak response of the blank gradient in the context of the solvent specifications. For example, a common specification for HPLC-grade acetonitrile is that a water–acetonitrile blank gradient monitored at 254 nm can have no peaks larger than 0.5 mAU, and at no larger than 1 mAU at 205 nm. Note that even through the problem baseline of Figure 4a looks very bad by visual examination, there are only three peaks (at ~9, ~10.5, and ~12.5 min) that exceed the 0.5 mAU at 254 nm specification.
References
- J.W. Dolan, J.R. Kern, and T. Culley, LCGC North Am.14(3), 202–208 (1996).
- M.D. Nelson and J.W. Dolan, LCGC North Am.16(11), 992–996 (1998).

John Dolan
“LC Troubleshooting” Editor John Dolan has been writing “LC Troubleshooting” for LCGC for more than 30 years. One of the industry’s most respected professionals, John is currently the Vice President of and a principal instructor for LC Resources in Lafayette, California. He is also a member of LCGC’s editorial advisory board. Direct correspondence about this column via e-mail to LCGCedit@ubm.com

Polysorbate Quantification and Degradation Analysis via LC and Charged Aerosol Detection
April 9th 2025Scientists from ThermoFisher Scientific published a review article in the Journal of Chromatography A that provided an overview of HPLC analysis using charged aerosol detection can help with polysorbate quantification.
Removing Double-Stranded RNA Impurities Using Chromatography
April 8th 2025Researchers from Agency for Science, Technology and Research in Singapore recently published a review article exploring how chromatography can be used to remove double-stranded RNA impurities during mRNA therapeutics production.

