Rapid Quantitative Analysis of Ethylene Oxide and 1,4-Dioxane in Polymeric Excipients Using SIFT-MS
Pharmaceutical excipients, such as polyethylene glycol-based polymers, must be tested for the presence of ethylene oxide (EtO) and 1,4-dioxane as part of a safety assessment, according to USP Chapter <228>. Selected ion flow tube mass spectrometry (SIFT-MS) offers advantages over conventional GC methods and accelerates quantitative and selective analysis of EtO and 1,4-dioxane through elimination of a lengthy matrix-match preparation and shorter run times providing 9- to 14-fold higher daily throughput than gas chromatography (GC). These efficiencies are gained while maintaining high analytical sensitivity, using 10-fold less sample per analysis.
Ethylene oxide is used as a raw material in the chemical industry for the manufacture of polyethylene glycols (PEGs) and polysorbate (trade name Tween), compounds used as solubilizers or stabilizers in pharmaceutical formulations. Ethylene oxide is an environmental pollutant (1) and mutagenic to humans (2). The ethylene oxide ring can be hydrolyzed to form diethylene glycol, which is then dehydrated to generate 1,4-dioxane, a carcinogen linked to organ toxicity. As a result of the myriad of problems attributed to ethylene oxide and 1,4-dioxane, pharmaceutical quality requirements include limits on residual ethylene oxide and dioxane.
Conventional ethylene oxide and 1,4-dioxane analysis in polyethylene oxide products use gas chromatography (GC) with flame ionization detection (GC–FID) (3). This approach is slow from the perspective of sample preparation (4) and throughput. For testing where standards are prepared in PEG, for example, residual volatiles must be removed by placing the PEG under vacuum at 60 °C for 6 h. Furthemore, the GC–FID run time is 38 min for each sample.
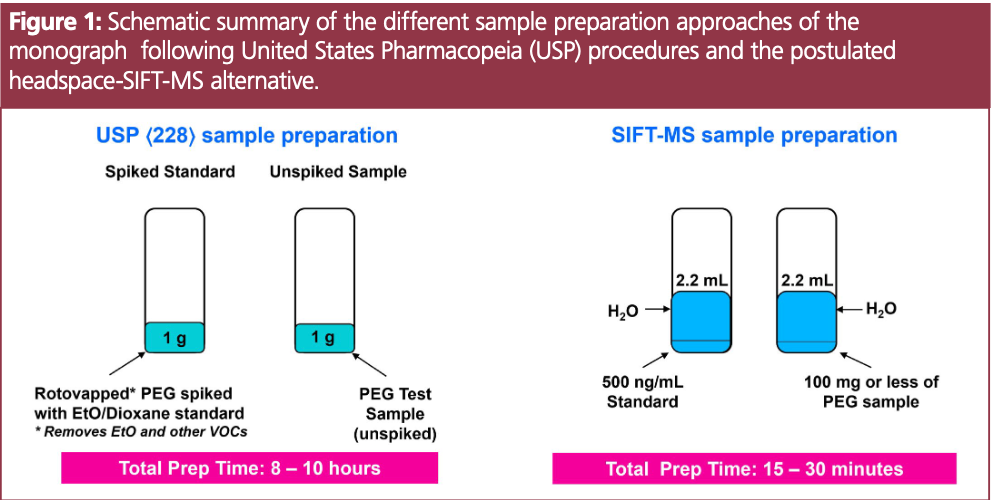
In the current study, a simplified alternative analytical approach is postulated. By leveraging the greater sensitivity of selected ion flow tube mass spectrometry (SIFT-MS) with headspace analysis, a much smaller quantity of PEG sample is used compared to headspace GC–FID. Sample preparation time is significantly reduced because this approach eliminates the need for matrix matching and therefore excludes the need for the 6-h PEG purification step (Figure 1). Additionally, direct sample analysis using headspace-SIFT-MS provides a nine-fold higher sample throughput than GC–FID and therefore a much faster time to first test result when calibrations, blanks, and a system suitability tests (SSTs) are considered (85 min. compared to 6–12 h) (5). The results obtained confirm the ability of headspace-SIFT-MS to rapidly quantify ethylene oxide in commercial samples of polymeric excipients, including in the presence of acetaldehyde.


The SIFT-MS Technique
Compared to conventional chromatographic techniques, SIFT-MS is a direct-injection MS technique (6). Briefly, rapidly switchable reagent ions (H3O+, NO+ and O2+) obtained from a microwave discharge in the air are used for gas-phase soft chemical ionization of volatile organic compounds (VOCs) in the headspace. Real-time, high-throughput analysis of chemically diverse volatile compounds is achieved because SIFT-MS is chromatography-free. Selectivity is achieved through the combination of multiple ionization mechanisms, courtesy of rapid switching between reagent ions providing independent measurements of each analyte, and mass spectrometric detection. The current work used a SIFT-MS instrument operating on helium carrier gas.
Experimental
Automated headspace-SIFT-MS analysis was achieved using an instrument comprising a Syft Tracer i3 (Syft Technologies, New Zealand), a multipurpose autosampler (PAL RSI, CTC Analytics AG, Switzerland), and SyftAuditTracer software (Syft Technologies, New Zealand). Samples were incubated at 70 °C for 30 min in an agitator. Headspace was sampled using a 2.5-mL headspace syringe (heated to 120 °C) and subsequently injected at a flow rate of 25 μL/ s into the SIFT-MS instrument’s high-throughput (HTP) inlet (heated to 120 °C). Since the nominal sample flow into the SIFT-MS instrument is 420 μL/s, a make-up gas (ultra-high purity nitrogen) is introduced into the inlet. The 10-fold dilution is accounted for in the calibration procedure below. The analysis time for each sample was 120 s and the reported concentrations are the mean of the values obtained during injection. Note that no internal standard was used (7).
Sample Preparation: PEG samples were prepared by weighing 100 mg of each PEG (PEG 400, PEG 8000 (Spectrum) and PEG 200, Sigma-Aldrich) and PS (Tween 20 and 80, Sigma-Aldrich) into a 20-mL headspace vial. Solutions were brought up to 2.2 mL with water. Samples were incubated at 70 °C for 30 min, and then 2.5 mL of headspace was injected into the Syft Tracer i3 at an injection rate of 25 μL s 1, using a syringe temperature of 120°C. The high-throughput inlet on the SIFT-MS was also maintained at 120 °C.
Standards for ethylene oxide and 1,4-dioxane were prepared in 20 mL headspace vials at a final concentration of 500 ng/mL in water. This is equivalent to 10 ppm, which is the acceptable limit for both volatiles in pharmaceutical excipients according to USP <228>.
SIFT-MS Detection of Ethylene
Oxide and 1,4-Dioxane
Table 1 summarizes the reagent ion–product ion pairs used to quantify ethylene oxide and 1,4-dioxane in this study.


Ethylene oxide is readily detected using SIFT-MS (Table 1). While the NO+ reagent ion is significantly less reactive with ethylene oxide than the O2+ reagent ions, the product ions of the O2+ reagent ions have mass-to-charge ratios that are frequently observed product ions for other VOCs and are unhelpful in practice. The most sensitive product ion (the m/z 45 ion resulting from reaction with H3O+) is subject to regular interference by acetaldehyde. Because PEG samples will typically have low levels of ethylene oxide—and especially because this work aims to leverage maximum sensitivity to reduce sample size and mitigate matrix effects—a subtraction approach is utilized. The H3O+ reagent ion is used to measure the combined ethylene oxide and acetaldehyde concentration and NO+ is used to measure the acetaldehyde concentration, enabling ethylene oxide to be determined by subtraction of the latter value from the former.
Results and Discussion
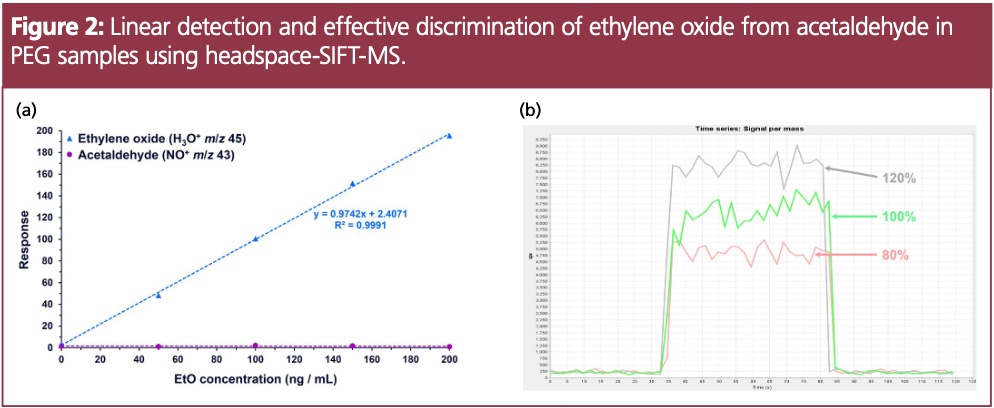
To evaluate linearity of ethylene oxide, a standard curve was run from 50–200 ng/mL of ethylene oxide in water (Figure 2a). Acetaldehyde concentrations are also reported simply to show that no acetaldehyde is detected using the NO+ 43 ion for quantification because this ion is unique to acetaldehyde only. To evaluate detectability, 100 mg of PEG was spiked with ethylene oxide at 80%, 100% and 120% of the accepted limit (8 ppm, 10 ppm, and 12 ppm, respectively). Figure 2b shows the increase in measured ethylene oxide with rising concentration, demonstrating detectability as required for validation of limits tests per USP. The limit of quantitation (LOQ) for ethylene oxide was calculated as 28 ng/mL (equivalent to approximately 0.5 ppm), which is approximately 20 times lower than the limits outlined in USP <228>, using 1/10 of the sample typically required with the GC–FID method.

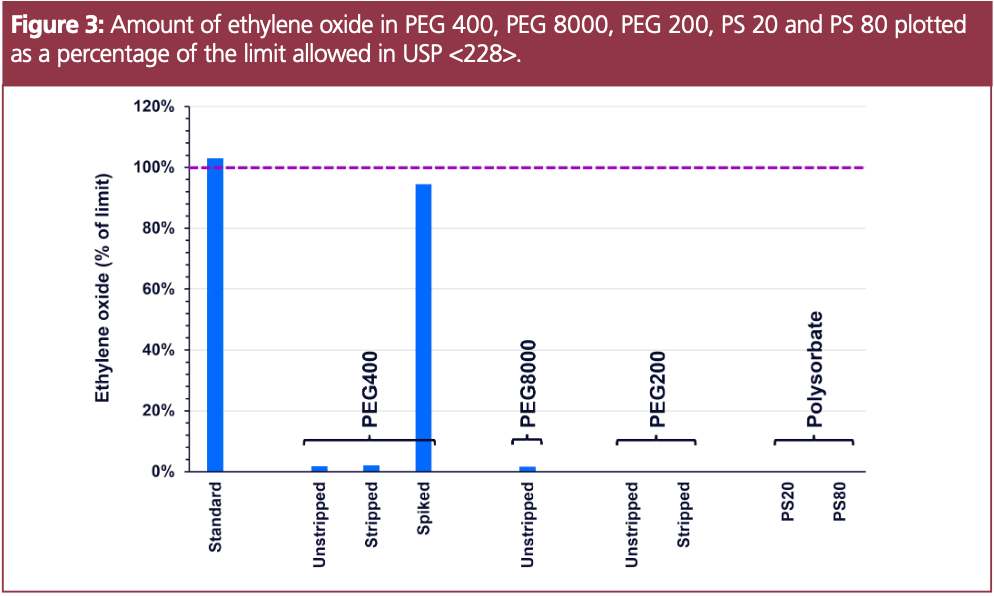
Both ethylene oxide and 1,4-dioxane were quantified in three different PEG samples: PEG 400, PEG 8000 and PEG 200. Two polysorbate (PS) samples were also prepared in the same way, as previous data has shown the ability quantify ethylene oxide and 1,4-dioxane in PS prepared in water, using SIFT-MS. Figure 3 shows ethylene oxide levels plotted as a percentage of the limit (10 ppm) in the three PEG samples and two polysorbate samples. For comparison, several of the PEG samples were prepared using the standard GC–FID preparation, where the PEG was “stripped” (i.e., rotovapped for 6 h to remove VOCs from the matrix). The data show some remaining ethylene oxide present in the stripped PEG 400 sample. The spiked PEG 400 sample, which was prepared by stripping the PEG and adding ethylene oxide at its limit, measured very closely with the standard prepared in water. Ethylene oxide was not detected in the PEG 200 or either of the PS samples.

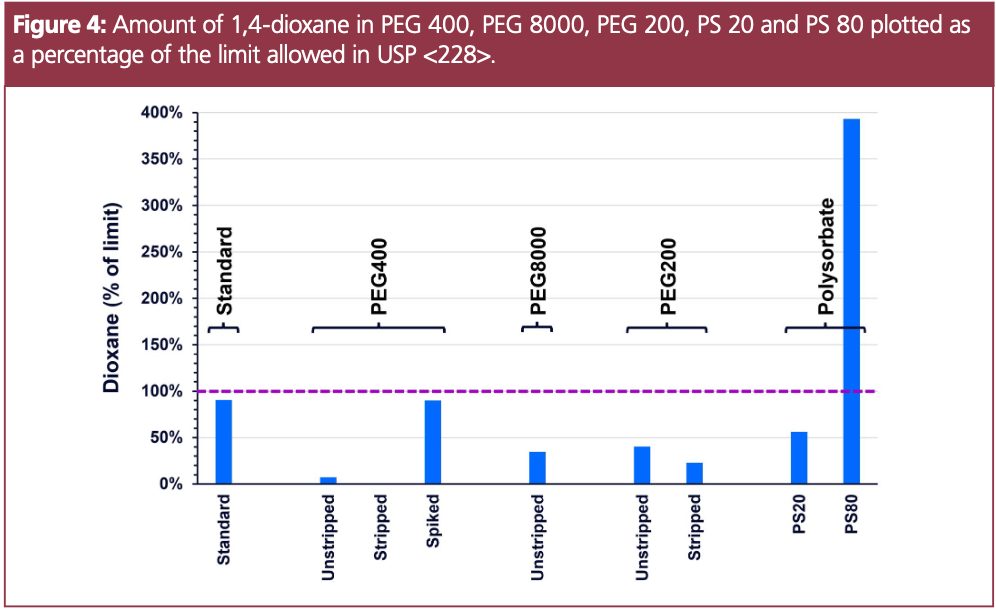
As was seen with ethylene oxide, the 1,4-dioxane data in Figure 4 shows both the dioxane standard in water, and prepared in the spiked PEG 400 sample, near the limit of 10 ppm. Some remaining 1,4-dioxane was detected in PEG 200, albeit at a significantly lower level than was present in the unstripped sample. A substantially higher level of 1,4-dioxane was measured in the PS 80 sample: almost four times the allowable limit. This sample is research-grade PS 80, and not of the purity that is used as a pharmaceutical excipient.

Conclusions
The findings from the current study show that high-sensitivity headspace-SIFT-MS analysis allows linear detection of ethylene oxide and effectively discriminates against its major interferent: acetaldehyde. The LOQ for ethylene oxide was calculated to be 0.5 ppm, which is well below the acceptance criteria outlined in USP <228>. The higher sensitivity of SIFT-MS enables use of 10-fold lower mass of sample compared to GC–FID, enabling 6-h prep of matrix-matched standards to be eliminated, as the effect from matrix becomes negligible. A single-point calibration using an external standard prepared in water can be used. SIFT-MS successfully measured both ethylene oxide and 1,4-dioxane in several PEG samples, and revealed that “stripped” PEG, which has undergone a rotovap step to remove volatiles, is not volatile-free, as ethylene oxide and 1,4-dioxane were detected in some of the “stripped” PEG samples due to the increased sensitivity provided by SIFT-MS.
Headspace-SIFT-MS analysis of ethylene oxide is 9- to 14-fold faster than the compendial GC–FID method, yielding sample throughputs of up to 224 samples/day. Shorter and simpler sample preparation when combined with faster analysis of SIFT-MS enables delivery of the first test result eight-fold faster than GC–FID. Headspace-SIFT-MS is an industry-proven technology ready for the QA/QC laboratory and process line.
References
(1) United States Environmental Protection Agency (US EPA). Available online: Ethylene Oxide Emissions: Frequent Questions | US EPA.
(2) Aronson, J.K., Ethylene oxide. In Meyler’s Side Effects of Drugs, 16th ed., Elsevier, pp 198-202 (2016). https://www.clinicalkey.com/#!/content/book/3-s2.0-B9780444537171007137
(3) United States Pharmacopeia. Polysorbate 80. 2015. https://www.usp.org/sites/default/files/usp/document/harmonization/excipients/polysorbate_80.pdf (Accessed June 26, 2024)
(4) United States Pharmacopeia. <228> Ethylene Oxide and Dioxane. 2013.
(5) Silva, L.; Connor, A.; Bastian, C.; Williams, C.; Morseth, Z.; Franco, E. Simple, Rapid Analysis of Ethylene Oxide in a Polysorbate 80 Excipient Using SIFT-MS. Syft Technologies application note. 2022. https://bit.ly/3QLWRmC
(6) Smith, D.; Španěl, P.; Demarais, N.; Langford, V. S.; McEwan, M. J. Recent Developments and Applications of [SIFT-MS]. Mass Spec. Rev.
2023, e21835. DOI: 10.1002/mas.21835
(7) Perkins, M. J.; Langford, V. S. Application of Routine Analysis Procedures to a Direct Mass Spectrometry Technique: [SIFT-MS]. Rev. Sep. Sci. 2021, 3 (2), e22001. DOI: 10.17145/rss.21.003
About the Authors
Juby Mathew is Life Sciences Market Specialist and Vaughan Langford is Principal Scientist at Syft Technologies in Christchurch, New Zealand. Leslie Silva is Applications Team Lead at Syft Technologies Inc in Anaheim, CA, USA. Direct correspondence to: Leslie.Silve@syft.com
Chad Bastian is Principal Scientist, Christopher Williams is Senior Director of Laboratory Services, and Alyssa McBurney is Senior Scientist at Alcami Corporation in Wilmington, NC, USA.
Mark Perkins is Senior Applications Chemist at Element Lab Solutions in Cambridge, UK.
, Sicily, Italy By Luis - stock.adobe.com")
 | Image Credit: ©Elmira - stock.adobe.com")
 | Image Credit: © TheWaterMeloonProjec - stock.adobe.com")

 | Image Credit: © chayantorn - stock.adobe.com")
 | Image Credit: © Gefo - stock.adobe.com")


. From industry he went on to Florida State University, where he was assistant professor of both analytical and materials chemistry. Since 2011, he has been at the National Institute of Standards and Technology (NIST), where he is currently Scientific Advisor in the Chemical Sciences Division. André is the author of over 90 peer-reviewed scientific publications, lead author of the second edition of “Modern size-exclusion liquid chromatography,” editor of the book “Multiple detection in size-exclusion chromatography,” past associate editor of the Encyclopedia of Analytical Chemistry and, since 2015, editor of Chromatographia. He has received a number of awards, including the inaugural ACS-DAC Award for Young Investigators in Separation Science, and was also inaugural Professor in Residence for Preservation Research and Testing at the US Library of Congress. His interests lie principally in the area of macromolecular separations, both fundamental and applied.")

New Method Explored for the Detection of CECs in Crops Irrigated with Contaminated Water
April 30th 2025This new study presents a validated QuEChERS–LC-MS/MS method for detecting eight persistent, mobile, and toxic substances in escarole, tomatoes, and tomato leaves irrigated with contaminated water.


University of Tasmania Researchers Explore Haloacetic Acid Determiniation in Water with capLC–MS
April 29th 2025Haloacetic acid detection has become important when analyzing drinking and swimming pool water. University of Tasmania researchers have begun applying capillary liquid chromatography as a means of detecting these substances.

Prioritizing Non-Target Screening in LC–HRMS Environmental Sample Analysis
April 28th 2025When analyzing samples using liquid chromatography–high-resolution mass spectrometry, there are various ways the processes can be improved. Researchers created new methods for prioritizing these strategies.

