Rapid Online Characterization and Reduction of Protein Modifications Using Fully Automated Two-Dimensional High Performance Liquid Chromatography–Mass Spectrometry
LCGC Europe
Characterization of protein modifications is an essential aspect of biopharmaceutical development. Traditionally, the characterization process of chromatographic peaks involves manual, larger-scale fractionation to obtain a sufficient amount of material for further analytical studies. This article presents a fully automated process for online peak fractionation and reduction of therapeutic antibodies with subsequent quadrupole time-of-flight mass spectrometry (QTOF-MS) characterization. This innovative technique significantly accelerates MS peak characterization compared to traditional approaches and avoids the risk of unintended modifications of the variants as a result of the isolation process, for example, deamidation during storage of isoforms. This approach considerably reduces the required sample amount and can be used for the characterization of product-related impurities during early stage development.
Photo Credit: kentoh/Shutterstock.com

Anja Bathke1, Denis Klemm1, Christoph Gstöttner1,2, Christian Bell1, and Robert Kopf1, 1F. Hoffmann-La Roche, Basel, Switzerland, 2Department of Biochemistry, University Regensburg, Regensburg, Germany
Characterization of protein modifications is an essential aspect of biopharmaceutical development. Traditionally, the characterization process of chromatographic peaks involves manual, larger-scale fractionation to obtain a sufficient amount of material for further analytical studies. This article presents a fully automated process for online peak fractionation and reduction of therapeutic antibodies with subsequent quadrupole time-of-flight mass spectrometry (QTOF-MS) characterization. This innovative technique significantly accelerates MS peak characterization compared to traditional approaches and avoids the risk of unintended modifications of the variants as a result of the isolation process, for example, deamidation during storage of isoforms. This approach considerably reduces the required sample amount and can be used for the characterization of product-related impurities during early stage development.
Monoclonal antibodies (mAbs) are highly complex recombinant proteins used successfully as therapeutics in many diseases. These immunoglobulins are large tetrameric glycoproteins with a molecular weight of 150 kDa. Monoclonal antibodies for therapeutic use are produced in genetically modified mammalian cells, for example, Chinese hamster ovary cells. During the expression, process- and product-related side products, such as glycosylation variants, glycation, and mispairing for CrossMabs, are generated. Additional modifications can occur during downstream processing and storage, including deamidation, isomerization, oxidation, and truncation (1–3). Aspartic acid or asparagine residues in the light and heavy chain are known to form succinimide under mildly acidic conditions. Succinimide further isomerizes to isoaspartic acid or back to aspartic acid under neutral or alkaline conditions. Hotspots for aspartic acid isomerization and asparagine deamidation are the motifs DG, NT, and NG (4–7).
These structural alterations or modifications lead to charge and size heterogeneity. For example, highâmolecular-weight species, such as aggregates of mAbs, have been correlated to a high safety risk because of their immunogenicity and influence on pharmacokinetics and efficacy (8). The formation of isoaspartic acid from a succinimide reaction may lead to a loss of biological activity (6,9). Most of these modifications can be monitored by the commonly used separation techniques, ion-exchange chromatography (IEC) or sizeâexclusion chromatography (SEC), and, consequently, these methods are commonly used in biopharmaceutical quality control (QC) strategies.
Characterization of charge and size variants is required to generate the product knowledge that forms the basis for critical quality attribute (CQA) assessment. The former is commonly performed using offline fractionation followed by mass spectrometry (MS) analysis of reduced protein in combination with enzymatic peptide maps. Although MS-friendly mobile phases for SEC separations have been reported recently (10,11), most buffers used in an IEC or SEC system are not compatible with MS. Therefore, an offline fractionation with subsequent up-concentration and buffer exchange step has to be performed. This procedure is very time-consuming and requires considerable amounts of isolated material (12), thereby often prohibiting peak characterization during early development. During the preparation, the isolated fraction is exposed to stress, which adds the risk of unintended modifications from sample preparation. To accurately determine the identification of the samples, further processing is performed including reduction, alkylation, and digestion steps (12–14).
During conventional characterization of mAbs, whole antibody samples were reduced and digested by dithiotreitol (DTT) or immunoglobulin-degrading enzyme from Streptococcus pyogenes (IdeS). The fragments were then separated by IEC and reversed phase in the twoâdimensional liquid chromatography (2D-LC) setup using comprehensive mode (15,16). By using this approach, variants of a mAb sample can be characterized but not assigned to specific peaks. The scope of this work was the direct characterization of mAb variant peaks observed in IEC or SEC QC) routine methods in a fully automated workflow. Several attempts were made to establish semi- or full automation for this workflow using fraction samplers or custom-made systems (17,18). However, most of those solutions were either not fully automated or very complex to handle and set up (17). Tran et al. performed all steps of a peak characterization including an IEC separation, online reduction, and online digestion with subsequent mass analysis via electrospray ionization time-of-flight (ESIâTOF) for smaller proteins with a customized capillary chromatographic system using a stop-flow technique. However, a fully automated procedure allowing use of routine analytical methods common for quality control strategies has been lacking (18).
This article describes a fully automated online reduction 2D-HPLC quadrupole time-of-flight (QTOF)-MS setup that allows rapid characterization of protein modifications with a multiple heart-cut valve system for automated peak fractionation. In contrast to earlier work, our process provides not only online reduction of trapped peaks but also a reversed-phase separation of the reduced proteins before entering the MS system. The developed system uses standard HPLC components and allows the use of the established QC methods for larger proteins (mAbs) in the first dimension without any adaptations. Peaks of interest observed in routine QC measurements can be directly characterized without the need for re-conformation runs. The use of a multiple heart-cut module allows for seamless analysis in the second dimension without the need to stop the flow. The system is easy to program with commercially available software. This article also discusses the benefits of an online approach versus standard offline peak characterization in detail.
Materials and Methods
Chemicals: Acetonitrile HPLC gradient grade, 2-(N-morpholino) ethanesulfonic acid monohydrate (MES), MES sodium salt, 4-(2-hydroxyethyl)-1-piperazineethanesulfonic acid (HEPES), dithiotreitol (DTT), sodium hydroxide (NaOH), and hydrochloric acid (HCL) were purchased from Merck KGaA. A 50% formic acid (FA) solution and phosphoric acid were obtained from Fluka (Sigma-Aldrich Chemie GmbH). Tris(hydroxymethyl)aminomethane (TRIS), piperazine, disodium hydrogen phosphate, sodium dihydrogen phosphate, Tris(2-carboxyethyl)phosphine hydrochloride (TCEP), and sodium chloride were purchased from Sigma-Aldrich. Isopropyl alcohol (IPA) was acquired from Sigma-Aldrich. Potassium chloride, dipotassium hydrogen phosphate, and potassium dihydrogen phosphate were ordered from Acros Organics. Purified water was used from a Milli-Q water Advantage A1-system (Merck KGaA).
Instrumentation: Experiments for online reduction of mAbs were performed on an Agilent 1290 Infinity 2D–LC system. The standard system itself consists of the following modules: 1260 quaternary pump (G5611A), 1290 binary pump (G4220A), 1260 Bio ALS autosampler (G5667A), 1290 thermostat (G1330B), 1290 column oven (G1316C) containing a six-port, two-position valve (G4231B), and two 1260 ultraviolet (UV) detectors (G1314F). The 2D interface module consists of a 1290 eight-port, twoâposition valve (G4236A) and two valve decks for multi heart-cut sampling with 6 × 40 µL loops each (G4242A multiple heart-cutting kit). To this standard system a third binary pump (G4220A) and a second column oven (G1316A) containing a six-port, two-position valve (G4231B) was added to enable the online reduction of antibodies. For MS detection, a Bruker Impact II ESI QTOF system (0211 G203) was used. The 2D-LC system was connected via a fused silica capillary with a diameter of 75 µm to the MS system. OpenLab CDS Chemstation (Agilent) was used to control the 2D-LC system. HyStar Software (Bruker) was used to control and acquire data from the MS system. A start signal for each individual 2D run was triggered by a customized software macro by means of a contact closure board. The signal of the 2D UV detector was fed into the Bruker software by an analog-to-digital (A/D) interface net ADC LC 421n (SCPA GmbH).
Starting with injection of the sample and separation on the first column, peaks of interest were fractionated online and stored in one of the 40-µL loops. During fractionation of the first dimension one peak after the other was injected onto the second dimension where it was either reduced and separated, or separated and then analyzed in the MS system. The process from injection of the sample until analysis in the MS system was fully automated by a “Valve Event Plugin” Macro from ANGI (Gesellschaft für angewandte Informatik). Each time a fraction was injected into the second dimension the third pump was started again and a start signal was sent to the MS system. In this way, a separate MS data file is generated for each fraction. Another advantage of the macro is that a valve in the column oven can be switched time dependent so that no reducing agent or salt from the first dimension IEC or SEC enters the MS system. In the setup for online reduction the second dimension UV detector was excluded to get sharper peaks and a good separation in the MS total ion chromatogram (TIC).
HPLC Operating Conditions:
Sample Preparation: Three different mAbs and one antigen-binding fragment (Fab) were used as a sample for online reduction. For online reduction, the mAb can be injected directly without any dilution or preparation.
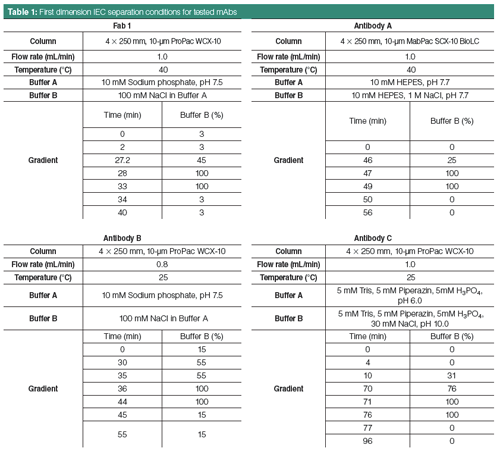
First Dimension Separation: IEC of mAbs was performed according to conditions listed in Table 1. The columns used were from Thermo Scientific.
Second Dimension Separation:
Trapping: The cut fractions were directed to a 2.1 × 50 mm, 1.7-µm Acquity BEH C4 reversed phase column (Waters Corporation) and trapped. Mobile phase A was 0.1% FA in purified water (PWA) and mobile phase B was 0.1% FA in acetonitrile. The pump was set to deliver 99% mobile phase A and 1% mobile phase B at a flow rate of 0.5 mL/min. The column temperature was set to 70 °C.
Online Reduction: The loaded reversed phase trapping column was flushed with the reduction solution at a flow rate of 56 µL/min for 5 min. The reduction solution was prepared by either dissolving 0.1543 mg DTT or 0.2502 mg TCEP in 50 mL tris solution pH 7.5 ending up in a final concentration of 0.02 M DTT or TCEP. The reduction solutions were freshly prepared each day.
Separation: The trapped and reduced peaks were finally separated by applying the gradient conditions as described in Table 2.
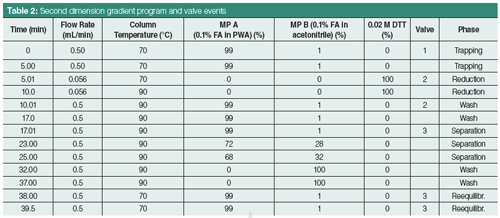
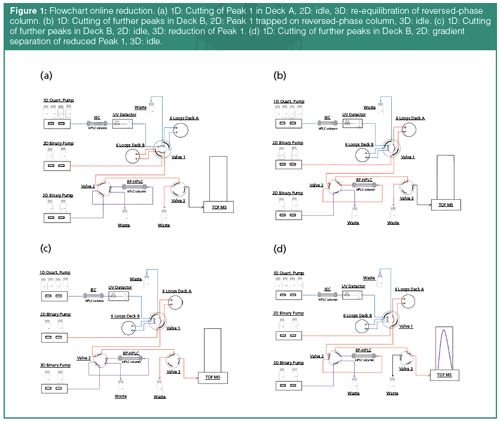
Process Flow: The complete characterization of a peak of interest consists of four steps (see Figure 1). After cutting the first peak of interest in Deck A, subsequent peaks were sampled in Deck B. Immediately after cutting, peak 1 was flushed to the reversed phase column where it is trapped and desalted. By switching valve 2, the trapped peak was reduced by pumping reducing reagent via the 3D pump. After reduction, valve 2 and valve 3 were switched simultaneously and the reduced mAb chains were separated with a reversed phase gradient and detected by MS.
MS Operation Conditions: For detection of reduced chains as well as material that has not been reduced, a Bruker Impact II system was used. The detection range was set between 300 and 2500 m/z. The end plate offset was 500 volt and dry temperature was set to 220 °C. Calibration was performed with 0.005% phosphoric acid.
Results and Discussion
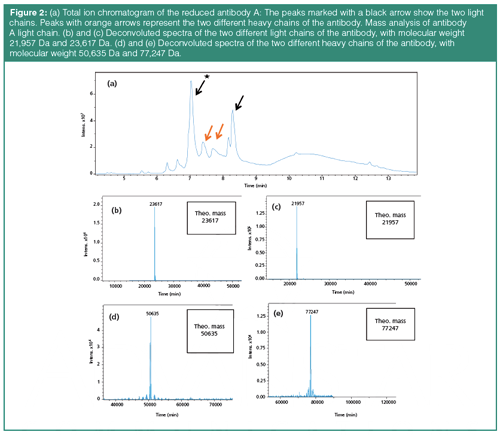
Development of an On-Column Reduction Step: Complete on-column reduction of mAb samples was achieved after a 5-min flush with either 0.02 M DTT or 0.02 M TCEP (data not shown). Longer reduction times were also evaluated without any improvement. Based on this observation no further optimization was deemed necessary. To verify the designed setup with the 5-min flow through of the reducing agent, a CrossMab (19) antibody (Antibody A) with one extended Fab arm on one side (2+1 CrossMab [20]) was used. For IEC separation conditions refer to Table 1. The size of the whole antibody is approximately 194 kDa without accounting for additional glycosylation. This antibody is built of two different heavy chains (HC) with a mass of approximately 77 kDa and 51 kDa and two different light chains (LC) with 22 kDa and 24 kDa; the chain with 24 kDa is present two times for each antibody. Figure 2(a) shows a TIC of the antibodies main peak (0.38 µg of protein for each fraction) after reduction. Major peaks could be assigned to the respective HC and LC chains.
Figure 2(b) and 2(c) depict the deconvoluted masses of all heavy and light chain fractions after online reduction. Other peak spectra showed comparable spectra.
Four different chains of the antibody A were detected after online reduction with excellent signal intensity (Figure 2). All interchain disulfide bridges as well as all intrachain disulfide bridges were reduced. The Fc glycosylation of the heavy chains was detected with different glycoforms. The detected masses corresponded to the theoretical masses based on the amino acid sequence of the four different chains (Figure 2). In addition, the intact antibody A (without reduction) was analyzed using 2D-LC–MS and the theoretical mass was observed (data not shown).
The developed system was used to analyze unknown peaks in stressed samples of three different antibodies and one Fab Fragment (Fab 1). Antibody B is a standard IgG1 antibody (Trastuzumab), whereas antibody A and C have extended Fab arms on one side and therefore a higher molecular weight than typical IgGs.
Characterization of a Low Abundance Basic IEC Peak in Antibody B: The IEC chromatogram of antibody B shows a low abundance peak in the basic region (Figure 3[a]). For IEC separation conditions refer to Table 1. A 40-µL sample of the peak of interest was extracted (0.24 µg of protein for each fraction) in the first dimension and transferred to the second dimension reversed phase column for on-column protein reduction. The reduced species were then eluted using an acetonitrile gradient and analyzed by QTOF-MS. The obtained deconvoluted mass spectrum is presented in Figure 3(b) and 3(c).
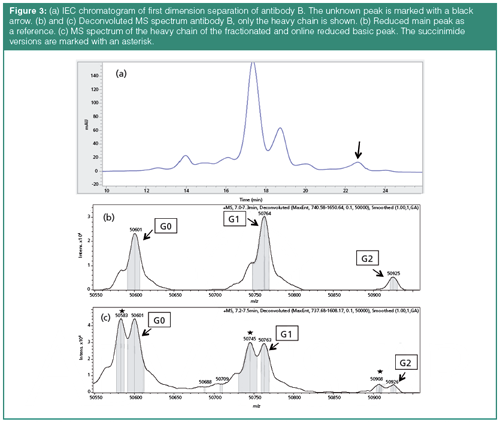
The peak with a mass of 50,601 represents the G0 glycovariant, whereas 50,763 and 50,926 are the G1 and G2 variants (7) of the non-modified heavy chain. The deconvoluted spectrum of the basic peak displays significantly increased signals with a difference of 17 ± 1 Da for all three glycoforms. This difference, combined with the retention time shift to the basic region of the IEC, suggests isomerization of aspartic acid to succinimide in the heavy chain of the mAb. This conclusion is further supported by data already published (21). The already present shoulders in the main peak spectrum at the same position are method-induced artifacts and represent the loss of water. The same effect can be seen in the spectrum of the basic peak.
Characterization of a Low Abundance Acidic IEC Peak in Antibody C: In a second experiment an acidic peak of an IEC separation of antibody C was analyzed (see Figure 4[a]). For separation conditions refer to Table 1. A 40-µL fraction of the peak of interest (0.54 µg of protein for each fraction) was sampled, reduced, and analyzed by QTOF-MS. The main peak was analyzed as a reference. The results are presented in Figure 4(b) and 4(c).
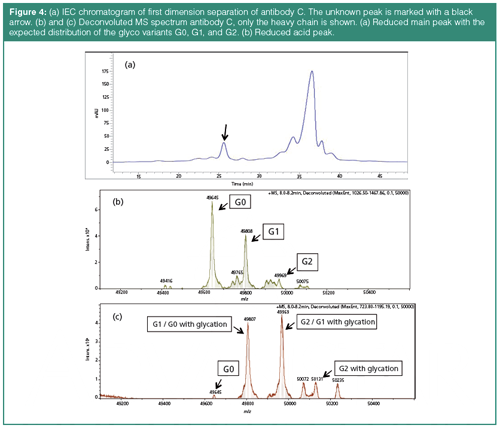
The main peak shows a normal distribution of the glyco variants, with the most abundant variant being G0, followed by G1 and G2 (Figure 4[b]). In the spectrum of the analyzed acidic IEC peak (Figure 4[c]), G0 was dramatically reduced, while the G2 peak was significantly increased. This can be explained by glycation of the heavy chain. Glycation is the result of covalent linkage of glucose to a lysine via formation of a Schiff base (22). This leads to loss of a positive charge of the molecule and a shift to the acidic region of the IEC chromatogram. Glycation typically occurs during the CHO cell culture process of antibody production when a high level of glucose is available in the cell culture medium. Glycation of the G0 variant results in an isoform with the same mass as the G1 variant. In addition, the G1 variant is also glycated leading to the observed increased mass of 49,969 Da. Glycation of the G2 variant leads to a new peak with a mass of 50,131 Da, which is only observed in the isolated acidic peak and not in the MS spectrum of the IEC main peak. The elution behaviour of the IEC peak supports the hypothesized glycation.
Characterization of a Low Abundance Acidic IEC Peak in Fab 1: In addition to monoclonal antibodies, a therapeutic Fab (Fab 1) was also characterized by 2D-HPLC–MS. The material was temperature stressed for 8 weeks at 40 °C and degradation products were subsequently measured by IEC. The non-stressed material was measured as reference. For separation conditions refer to Table 1. The IEC chromatogram of the stressed material showed one unknown peak, which was subsequently analyzed with the established 2D-HPLC–MS online reduction assay. The peak of interest is shown in Figure 5(a).
The peak was analyzed and found to be a modified light chain with a mass delta of +16 Da in comparison to the non-modified light chain. Based on three-dimensional X-ray structure measurements (data not shown), this mass shift most probably represents an oxidation of an exposed tryptophan residue in the complementarity-determining region (CDR) of Fab 1.
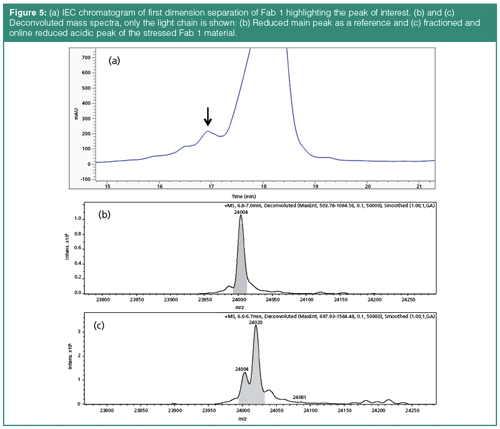
The deconvoluted MS spectra are depicted in Figure 5(b) and 5(c). Because the fractionated peak is next to the main peak there is also a small signal of the native light chain, with the mass of 24,004 Da next to the modified version with a mass of 24,020 Da.
Further Experiments
Further experiments using SEC in the first dimension instead of IEC were performed. These tests were performed with antibody A and antibody B. The online trapping and reduction of fractionated peaks were comparable to the IEC experiments (data not shown here). This combination is most appropriate when mispaired species or fragment peaks have to be characterized.
An alternative reducing agent, namely TCEP instead of DTT, was evaluated using exactly the same conditions such as temperature, concentration of the reducing agent, duration of reducing agent flow, and flow rate. TCEP was also tested with different antibodies and produced exactly the same results as the reduction with DTT (data not shown).
Conclusions
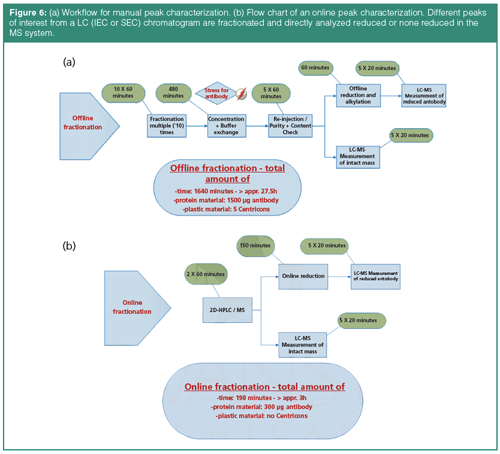
Characterization of product variants or post-translational modifications of therapeutic antibodies is essential because of their potential impact on product quality, safety, and efficacy (23); for example, a loss in potency can become a problem (24,25). To control those species various analytical QC methods are applied that are predominantly HPLC-based. Until now the characterization of unknown peaks had to be performed by offline fractionation. This is a time-consuming process with the risk of introducing additional, unintended modifications. The 2D-HPLC–QTOF-MS setup described here enables fully automated and rapid characterization of unknown peaks and is easy to use. It was possible to increase the sensitivity fivefold (0.2 µg of protein for each cut) compared to previous works (17). The system uses standard HPLC components and allows the use of the established QC methods for larger proteins (such as mAbs) in the first dimension without any adaptations. Unknown peaks observed in routine QC measurements can be directly characterized without the need of re-conformation runs or bridging between methods. The use of multiple heart-cutting as part of the 2D-HPLC system offered easy analysis in the second dimension without the need to stop the chromatographic flow. This approach has been successfully implemented for a plethora of biopharmaceutical development projects in our pipeline. The use of a reversed phase gradient for the separation of reduced mAb chains enables the identification and localization of modifications. Compared to conventional peak fractionation and characterization, the 2D-HPLC–MS setup described here yields a reduction in time-to-result of one order of magnitude, allowing sample characterization in a single day (Figure 6).
In some cases (for example, deamidation) identification of the modification can be improved by further reducing the size of antibody chains by digestion enzymes, like papain or trypsin. Further development work is ongoing to establish an additional digestion step for each fractionated peak in a 4D-HPLC–MS setup to achieve clear localization of modifications and verification of small mass shifts (1 Da for deamidation).
Acknowledgement
The work presented here was sponsored by the Roche Global Strategy Team (GST) process. The authors wish to thank Rico Schaerer from Agilent for his support.
References
- K. Sandra, I. Vandenheede, and P. Sandra, Journal of Chromatography A1335, 81–103 (2014).
- A. Beck et al., Anal. Chem. 85(2), 715–736 (2013).
- E. Mostovenko et al., EuPA Open Proteomics1, 30–37 (2013).
- J.F. Sydow et al., PLoS One9(6), e100736 (2014).
- H. Yang and R.A. Zubarev, Electrophoresis31(11), 1764–72 (2010).
- G.C. Chu et al., Pharm. Res.24(6), 1145–56 (2007).
- C.A. Sha Sha, K. Brorson, D.-Y. Lee, and S. Yoon, Trends in Biotechnology34(2), 835–846 (2016).
- A.S. Rosenberg, AAPS J.8(3), E501–7 (2006).
- A.C.B. Mire-Sluis, R. Madsen, A. Polozova, A. Rosenberg, H. Smith, T. Arora, and L. Narhi, BioProcess International 9(10), 38–45 (2011).
- R. Gahoual et al., Anal. Chem. 89(10), 5404–5412 (2017).
- M. Haberger et al., MAbs8(2), 331–9 (2016).
- X. Zhang et al.., Anal. Chim. Acta.664(2), 101–13 (2010).
- S. Fekete et al., Anal. Chem.88(1), 480–507 (2016).
- H. Steen and M. Mann, Nat. Rev. Mol. Cell. Biol. 5(9), 699–711 (2004).
- M. Sorensen et al., MAbs8(7), 1224–1234 (2016).
- D.R. Stoll et al., Anal. Chem.87(16), 8307–8315 (2015).
- M. Alvarez et al., Analytical Biochemistry 419(1), 17–25 (2011).
- B.Q. Tran et al., Journal of Separation Science31(16–17), 2913–2923 (2008).
- C. Klein, W. Schaefer, and J.T. Regula, MAbs 8(6), 1010–20 (2016).
- M. Bacac, C. Klein, and P. Umana, Oncoimmunology5(8), e1203498 (2016).
- K. Diepold et al., Plos One7(1), (2012).
- S. Fischer, J. Hoernschemeyer, and H.C. Mahler, European Journal of Pharmaceutics and Biopharmaceutics70(1), 42–50 (2008).
- C. Chumsae et al., J. Chromatogr. B Analyt. Technol. Biomed. Life Sci.850(1–2), 285–94 (2007).
- L. Huang et al., Anal. Chem.77(5), 1432–9 (2005).
- B. Yan et al., J. Pharm. Sci.98(10), 3509–21 (2009).
Christian Bell studied biochemistry at the Ruhr University Bochum, the Max-Planck Institute for Molecular Physiology, Dortmund, Germany, and the Scripps Research Institute, San Diego, California, USA. He went on to do his Ph.D. at the University of Oxford, UK, focusing on structural biology. Since 2011, Christian has worked for Roche and is currently focused on analytical development and quality control of protein therapeutics in a clinical setting.
Anja Bathke is Group Head of a mass spectrometry laboratory at Hoffmann-La Roche, Biotech Analytics in Basel, Switzerland. She is an expert in MS protein characterization and hyphenated techniques. Anja studied biotechnology at the Fachhochschule Lausitz - University of Applied Sciences, Germany.
Robert Kopf has worked as a principal scientist in the Biotech Analytics department of Hoffmann-La Roche since 2004. He studied analytical chemistry at the Reutlingen University, Germany. He has been involved in HPLC method development and validation for small and large molecules for his whole career.
Christoph Gstöttner is a PhD student in the Center for Proteomics and Metabolomics at the Leiden University Medical Center (LUMC), Leiden, in The Netherlands. Before that he studied biology at Regensburg University, Germany.
Denis Klemm studied applied chemistry at Reutlingen University, Germany, with special focus on bioanalytics. Since 2017 Denis has worked at Hoffmann-La Roche as a senior associate in the Biotech Analytics department. Both Denis and Christoph worked on the development of the described characterization system during their master theses.

Thermodynamic Insights into Organic Solvent Extraction for Chemical Analysis of Medical Devices
April 16th 2025A new study, published by a researcher from Chemical Characterization Solutions in Minnesota, explored a new approach for sample preparation for the chemical characterization of medical devices.
Sorbonne Researchers Develop Miniaturized GC Detector for VOC Analysis
April 16th 2025A team of scientists from the Paris university developed and optimized MAVERIC, a miniaturized and autonomous gas chromatography (GC) system coupled to a nano-gravimetric detector (NGD) based on a NEMS (nano-electromechanical-system) resonator.


