Optimizing Flavour Analysis Using Modern Heart-Cutting MDGC
The Column
This review discusses recent technological advances in classical heart-cuttting two-dimensional gas chromatography (GC–GC). These developments are then illustrated by application to analysis of important flavour compounds at trace levels in very complex matrices
In this review recent technological advances in classical heart-cuttting two-dimensional gas chromatography (GC–GC) are outlined. These developments are then illustrated by application to analysis of important flavour compounds at trace levels in very complex matrices. The technology can even be extended to three-dimensional capability (GC–GC–GC) for the most complex challenges.
Photo Credit: Nicholas Eveleigh/Getty Images

Single column capillary gas chromatography (GC) offers high separation efficiency that, when combined with a suitable choice of stationary phase and detection system, is sufficient for most practical demands. However, real-life samples such as fragrances, fuels, and environmental extracts can often overwhelm the separation capabilities of even the most efficient single columns. A solution is to perform two-dimensional (2D) GC, where a second capillary column is added, and effluent is transferred from the first column to the second column for further separation. The more dissimilar the two chromatographic phases, the greater the gain or increase in the selectivity factor (α). It is critical when performing 2D GC that attention is given to how columns are connected and the corresponding mechanisms for transferring compounds between columns. This is key to success and is where most development has taken place over the years.
There are two fundamentally different approaches for the transfer of first column effluent to the second separation space. The most simple and direct is heart-cutting GC (GC–GC), where subsets of compounds or retention-time segments are passed to the second column for further separation. In an alternative approach (GC×GC) all compounds eluting from the first column are passed "on-line" to the second column; however, unlike in GC–GC, the speed of the secondary separation can be two orders of magnitude faster than the first column separation. GC×GC can therefore require expensive fast-scanning mass spectrometers and elaborate techniques for construction and interpretation of the two-dimensional data. This area is constantly developing, but is perhaps not yet ready for acceptance into routine analysis. The final goal is the evolution of a system that can offer on-demand routine two-dimensional capability to practitioners with maximum use of current routine mass spectrometry (MS) equipment and selective elemental detectors.
In this review, a 2D heart-cutting system will be described that incorporates recent technological advances together with an olfactory detection port (ODP) for research and problem solving in the flavour industry.
A Short History of GC–GC
Early developments in GC–GC are summarized in various reviews.1,2 In the early days columns were connected for effluent transfer using multiport valves, but the large internal volume of these unions led to high unswept interface volumes and loss of primary peak width. Catalytic activity on the metal surfaces was also a problem.
A breakthrough was achieved in 1968 when Deans introduced a valveless switching system based on pneumatic pressure balancing.3 This was a fluidic device where the carrier gas flow was externally controlled to the injection port and the column intersection point, allowing the interface device located inside the GC oven to be constructed of inert materials. Additional advantages were the lack of memory effects and a reduction in interface contribution to band-broadening. Practically all commercial 2D GC systems developed after this were based on the Deans principle. Siemens introduced the Sichromat-2 in which the transfer system was termed a "live" switch and acted to offer minimal flow disturbance in the primary column.4,5 Other variations were offered by Chrompack,6,7 SGE,8 and Analytical Controls.9 In 1988 Gerstel introduced a system based on two GC ovens and connected by a transfer line that could be heated or cooled. The Deans switch used in this configuration employed a combination of electronic mass flow control and programmable restriction that offered rapid pressure re-equilibration at the mid-point connector after transfer of cuts.10,11
In 2006, Shimadzu introduced a multidimensional GC (MDGC) instrument that also used two GC columns connected by a heated transfer line,12 and this was applied to an in-depth study of perfume allergens.13
Two recent developments have generated renewed interest and activity in GC–GC. The first development was the introduction of a microfluidic transfer device manufactured through capillary flow technology (CFT) by Agilent Technologies. The device incorporates all transfer components into a miniature deactivated microchip plate, uses metal ferrules to eliminate leaks, and is thermally inert with both low thermal mass and unswept dead volumes.14 The second development was the introduction of low thermal mass (LTM) GC where a standard capillary column can be heated or cooled independent of the GC oven.15,16 Two of these units can be mounted in a single GC oven eliminating the previous need for two individual ovens for 2D GC–GC. The LTM technology enables accelerated heating and cooling for rapid analysis as well as independent temperature programming for each column module.
These advances led to the development of a patented 1D/2D GC–MS system.17–19 Based on a CFT Deans switch and dual LTM–GC together with additional CFT plates and a single pneumatics control module, all housed in a single GC.20
The selection of 1D or 2D GC–MS can be performed without any additional instrumental set-up change and the same mass spectrometer can be used for both 1D and 2D analysis. This allows the availability of spectral data from the first dimension monitor TIC. The system also allows simultaneous mass spectrometric and selective detection with constant split ratio.21
Modern GC–GC
Figure 1: Schematic flow diagram of conventional heart-cutting 2D GC-MS system: a) Inlet; b) 1st column; c) switching device; d) monitor detector; e) Cryotrap, f) 2nd column; and g) mass spectrometer.

1D/2D GC–O–MS: In this section, a system that has been succesfully applied to odour analysis will be described. GC–Olfactometry combined with MS (GC–O–MS) allows not only for the sensory evaluation of odour compounds, but also for their identification with mass spectral information; however, many key odour compounds can occur at very low concentrations. Analysis of odour compounds can therefore be a challenging task, because of compound coelution with other analytes or the sample matrix. 2D GC–GC with simultaneous olfactometry and mass spectrometric detection extends the identification capability and separation resolution of GC. Conventional systems (as shown in Figure 1) would need substantantial reconfiguration to be used for 1D GC–O or 2D GC–O. In addition, the monitor signal obtained for 1D GC–O is FID only and mass spectral information is not available to select heart-cuts for transfer to 2D.
Figure 2: Schematic flow diagram of TD-1D/2D GC-O-MS with single PFC system: a) TDU inlet; b) and c) dual LTM-GC; d) switching device; e) PCM; f) ODP; g) selective detector; h) cryo-trap; i) host GC oven; and j) mass spectrometer.
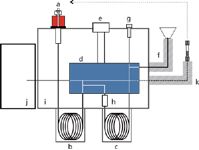
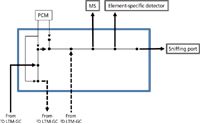
The selectable 1D/2D GC–MS system described (Figures 2 and 3) can overcome these limitations in a single system21 and offers several advantages:
- The entire configuration is not a dedicated GC–GC system. 1D GC–MS can be run separately when heart-cutting operations are not required. The selection of 1D GC–MS or 2D GC–MS operation is easily performed without any change in the instrumental setup.
- The preliminary analysis with a "monitor FID" to select the heart-cut region can be elimiminated and a "monitor TIC" can be provided for the 1D GC separation in a 2D GC–MS analysis. Both 1D and 2D TIC can be perfomed in a single run of 2D GC–MS.
- For target analysis, analytes that are free from co-elution of matrix or other analytes can be separated on 1D GC. Only those parts of the chromatogram that are negatively affected by co-elution of matrix or other analytes need to be transferred and separated on 2D GC. Quantification can be performed by a combination of both separations and mass spectrometric detection. This approach has been succesfully applied for the analysis of allergens.23
- Simultaneous mass spectrometric and olfactometry (and selective detection) can be performed for both 1D GC and 2D GC under a constant split ratio.
- The TDU inlet allows optimization of inlet conditions for thermal desorption (or solvent venting), analyte refocusing, and transfer to the column independent of the presence of non-volatile matrix components,24 resulting in greater system cleanliness.
Figure 3: Schematic flow diagram of the switching device for the 1D/2D GC-O-MS system.
1D/2D GC–O–MS with PFC: The olfactory detected compounds in a 2D separation are often not detected in the 2D TIC at the corresponding retention times (RTs), particularly when analyzing highly complex samples. In many cases, human sensory ability can be much more sensitive than instrumental detection and so an enrichment step may be required before final MS detection.
However, additional enrichment in sample preparation/introduction steps often deteriorates 1D GC separation because of overloading of the injected sample, resulting in a more complex chromatogram in both 1D and 2D GC separation. Between the late 1980s and the early 1990s, Nitz et al. proposed a modular-type MDGC system for analysis of odour compounds at low levels.24 They reported on 2D preparative GC in combination with TD–GC–O–MS for the analysis of passion fruit.25 After 2D GC separation and preparative enrichment with an adsorbent trap, the trapped compounds are thermally desorbed and subsequently analyzed by GC–O–MS.
A modular-type GC construction could be adopted for different instrumentation; however, one always has to reconfigure these MDGC modules. This concept has now been reintroduced in an improved format by combining the 1D/2D GC–O–MS system and a single preparative fraction collection (PFC) module (1D/2D GC–O–MS with PFC).21
After fraction collection and enrichment of an olfactory detected compound following multiple injections, the trapped and enriched compounds are thermally desorbed in a loop-type fashion into the same system without any instrumental set-up change. Finally, the desorbed compounds are analyzed by 2D GC–O–MS for identification.
Figure 4: Schematic flow diagram of the switching device for the 1D/2D GC-O-MS with PFC system.
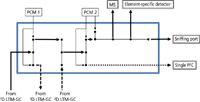
In a first application using SBSE-TD-1D/2D GC–O/MS with PFC, three off-flavour compounds (2,4,6-trichloroanisole, 2-isobutyl-4-methoxypyrazine, and geosmin) in wine at odour perception threshold levels (5–50 ng/L) could be identified.21 In addition to the components of TD-1D/2D GC–O–MS, the system consists of a second CFT Deans switch (Deans 2), the PCM 2, and the single PFC module (see Figure 2 and 4). Both the outlets of 1D and 2D columns are merged and then connected to Deans 2 instead of a splitter, which is in turn connected to a mass spectrometer and the ODP. The outlet flow is switched to the splitter or the single PFC module by Deans 2, which is controlled by PCM 2. The system can provide not only 1D or 2D GC–O–MS analysis but also PFC on both 1D and 2D GC separations.
Figure 5: Schematic flow diagram of TD-GC-2D/3D GC-SCD/NCD/MS system: a) TDU inlet; b) 1st column; c) 1st switching device; d) monitor detector; e) 1st GC, f) 1st cryo-trap; g) 2nd column (LTM-GC); h) 3rd column (LTM-GC); i) 2nd switching device; j) PCM; k) 2nd cryo-trap; l) host GC; m) MS; n) SCD; and o) NCD.

GC–2D/3D GC–SCD/NCD/MS: Although GC–GC is commonly used in target analysis of specific compounds, several authors have reported successful application of GC–GC for total profiling by using repetitive injection with consecutive cuts.10,21,26,27 However, in certain cases 2D GC separation is still not enough to deconvolute a highly complex sample. In cases such as these, additional dimensions, such as three-dimensional (3D) GC or high-resolution MS, would be required. We configured a heart-cutting 3D GC system based on 1D/2D GC–MS with element-specific detection for total profiling of sulphur compounds in tobacco smoke extract.28 Figure 5 shows a schematic of GC–2D/3D GC–MS with a sulphur chemiluminescence detector (SCD) and a nitrogen chemiluminescence detector (NCD) system (GC–2D/3D GC–SCD/NCD/MS). With this configuration, an additional GC–FID system, including the CFT Deans switch (c) and the PCM (PCM 1), performs sequential heart-cutting of the selected fraction in the 1D GC FID chromatogram. The transferred fraction is separated and profiled with 2D GC–SCD/NCD/MS. The selected sulphur peaks in the 2D SCD chromatograms are then transferred to the 3D GC separation by using the switching device in the 2D/3D GC system.
Applications
Methional in Daily Food Products: Analysis of odour compounds in daily food products can be rather complicated when taking into account the relatively high levels of matrices (lipids, proteins, and sugars) present. Many odour compounds are also present at low levels in the range of ng/mL or below. Several sample preparation techniques - such as liquid-phase extraction, gas-phase extraction/distillation, and solid-phase extraction - have been proposed for isolation and extraction of odour compounds in daily food products prior to GC analysis.29 Headspace techniques - such as static headspace (SHS), dynamic headspace (DHS), and headspace solid-phase microextraction (HS–SPME) - have been frequently used because they are simple, solvent-less, and amenable to full automation. However, these techniques are generally better suited for more volatile and/or hydrophobic compounds. In 2012, a full evaporation dynamic headspace (FEDHS) method, based on a classical full evaporation technique (FET) developed by Markelov and Guzowski in 1993,30 was demonstrated for uniform enrichment of odour compounds in aqueous samples at ng/mL levels.31 By applying FEDHS of 100 μL of aqueous sample at 80 °C, a wide range of odour compounds with different polarities could be uniformly recovered (>85%) in contrast with conventional DHS and HS–SPME, while leaving most of the low volatile matrix behind. In the following experiment, a combination of FEDHS and 1D/2D GC–O–MS with simultaneous pulsed flame photometric detection (PFPD) allows for the analysis of methional at ng/mL level in daily food yoghurt. Methional was first found in yoghurt in 1997 as an intense odour compound at trace level.32
For the FEDHS procedure a yoghurt sample was diluted twofold with ultra-pure water and 100 μL of the diluted sample was transferred into an empty 10 mL screw cap headspace vial. No further sample preparation was necessary.31
Figure 6: 1D/2D TIC, PFPD chromatograms, and olfactometric signals obtained by FEDHS-1D/2D GC-O-PFPD-MS for a yoghurt sample: a) 1D/2D TIC; b) 1D/2D PFPD chromatograms, c) 1D/2D olfactometric signals. Peaks: 1 = 2,3-butanedione, 2 = ethyl butyrate, 3 = 2,3-pentanedione, 4 = iso-amyl acetate, 5 = acetoin, 6 = acetic acid, 7 = propanoic acid, 8 = butanoic acid, 9 = 3-methyl-2(5H)-furanone, 10 = hexanoic acid, 11 = benzyl alcohol, 12 =octanoic acid, 13 = decanoic acid, 14 = benzoic acid, 15 = dodecanoic acid, 16 = ethyl vanillin, 17= vanillin. S1 = dimethyl sulphoxide, S2 = methionol, S3 = dimethyl sulphone, S4 = benzothiazole.
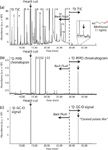
Several major odour compounds that contribute to the aroma of yoghurt were detected in a 1D TIC, including 2,3-butanedione (1) and 2,3-pentanedione (3), C4-C12 fatty acids (8,10,12,13,15). In short, sulphur peaks were detected in a 1D PFPD chromatogram. Four sulphur peaks were identified as dimethyl sulphoxide (S1), methionol (S2), dimethyl sulphone (S3), and benzothiazole (S4) from the combined search using an MS library and linear retention indices (LRI) database (Aroma Office 2D database, Gerstel K.K.) for the corresponding mass spectrum in the 1D TIC. However, several sulphur peaks, including the one eluting at RT of 13.52 min that had a strong "cooked potato-like" odour (obtained from the simultaneous GC–O), were completely buried in the 1D TIC. It is difficult to extract a clean mass spectrum for this sulphur peak because of significant interference of co-eluting sample matrix. A heart-cut of this sulphur peak was therefore performed in the 1D PFPD chromatogram for the identification in the 2D chromatograms. Figure 6 demonstrates the single heart-cut in the 1D RT 13.40–13.66 min and both 1D and 2D TIC (Figure 6[a]), PFPD chromatograms (Figure 6[b]), and olfactometric signals (Figure 6[c]). After heart-cutting, the heart-cut fraction was cryofocused in the CTS2 cryogenic trapping system (Gerstel) at -100 °C during the rest of the 1D GC run. At the RT 29 min, 1D GC was back-flushed and the cryogenic trap was rapidly heated to start 2D GC. The peak of interest was clearly detected with all detection capabilities (MS, PFPD, and olfactometry) in the 2D separation. Using 2D LRI of 899 (DB-5), the LRI database, and the MS library search, this sulphur peak was positively identified as methional. Finally, methional was determined at a trace level of 11 ng/mL by using a 5-point standard addition calibration between 20 ng/mL and 100 ng/mL.
Figure 7: 1D/2D TIC, and olfactometric signals obtained by FEDHS-1D/2D GC-O-MS for a green tea sample: (a) 1D/2D TIC; (b) 1D/2D olfactometric signals. 1 = 2,5-dimethyl pyrazine, 2 = 2,3,5-trimethylpyrazine, 3 = maltol, 4 = furaneol, 5 = indole, 6 = coumarine, 7 = vanillin, and 8 = hexanoic acid.
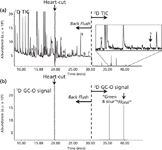
Geraniol in Brewed Green Tea: Analysis of odour compounds in green tea requires powerful extraction and enrichment steps before GC analysis because they are present at very low levels (from pg/mL to ng/mL). Kumazawa and Masuda demonstrated the identification of potent odourants in Japanese green tea by using aroma extract dilution analysis (AEDA).33 First they revealed 36 odour active peaks which have flavour dilution (FD) factors between 10 and 5000 from a starting sample of 3 L of green tea (filtrate) by the combination of steam distillation (SD), SPE, and GC–O. These 36 potent odourants were then identified from the starting sample of 30 L (3 L × 10 times) of green tea by using SD–SPE in combination with 1D GC–MS and off-line 2D GC–MS. In the following experiment FEDHS–1D/2D GC–O–MS with PFC is demonstrated for analysis of geraniol at low ng/mL levels in green tea. For this analysis, the same method, but minus the simultaneous PFPD detection, was used as for the yoghurt application. Several potent odourants in green tea were detected in a 1D TIC from only 100 μL of sample, including 2,3,5-trimethylpyrazine (2), maltol (3), furaneol (4), indole (5), coumarine (6), and vanillin (7). Two kinds of odour such as "floral" and "green and sour" were detected at the RT of 19.77 min with GC–O. However, only hexanoic acid (8) was identified as a "green and sour" compound from the 1D GC–O run. To identify the "floral" compound, a heart-cut in the RT 19.60–90 min region was performed. Figure 7 shows both 1D and 2D TIC and olfactometric signals of green tea. The peak of interest (floral) was clearly detected with olfactometry on the 2D separation. However, the corresponding peak on the 2D TIC was very small and it was difficult to obtain mass spectra that were amenable to the MS library search. To further enrich the "floral" compound, FEDHS-1D GC–PFC with a Tenax TA trap (Restek)was sequentially performed for 20 samples. After 20 injection cycles, the trap was finally analyzed by TD-2D GC–O–MS using the same system without any instrumental set-up change. Figure 8 demonstrates a comparison of the 2D TIC between single FEDHS (Figure 8[a]) and FEDHS after PFC enrichment with 20 injection cycles (Figure 8[b]). After the PFC enrichment and 2D separation the peak of interest that corresponded to the 2D GC–O signal of "floral" could be clearly detected on the 2D TIC. Using 2D LRI of 1251 (DB-5), the LRI database, and the MS library search, this peak was positively identified as geraniol, which is reported as a potent odourant in green tea.33 After the successful identification, quantification was performed with a single run of FEDHS–2D GC–O–MS in the SIM mode using a 4-point standard addition calibration between 2 ng/mL and 20 ng/mL. Geraniol was determined at a trace level of 1.7 ng/mL.
Figure 8: Comparison of 2D TIC between the single FEDHS: (a) PFC enrichment with 20 injection cycles (b) for green tea.

Total Profiling of Sulphur Compounds in Tobacco Smoke: We have successfully applied FEDHS-1D/2D GC–SCD/NCD/MS with sequential heart-cutting approach for the total profiling of sulphur compounds in aged and unaged whisky at ng/mL levels.21 More than 40 sulphur peaks were detected in the 2D SCD chromatograms after generation of 16 sequential heart-cuts. Twenty sulphur compounds could be positively identified and an additional eight formulas were also obtained. The same approach was applied to sulphur compounds in tobacco smoke extract. A 100 μL sample of tobacco smoke extract (methanol solution) was used for the analysis.
A total of 60 heart-cuts were sequentially performed from the 1D LRI 800 to 2000 (LRI 20 unit per fraction) and more than 450 sulphur peaks were detected in the 2D SCD chromatograms. However, only 18 sulphur compounds were positively or tentatively identified and in most cases it was difficult to obtain clear mass spectrum of each sulphur compound even after 2D GC separation. Tobacco smoke is one of the most complex sample types and contains more than 5000 compounds.34 To address a large number of coeluting compounds in the 2D TIC a 3D configuration was assembled by incorporating an additional stand alone GC–FID with the original 1D/2D selectable system. This system is outlined schematically in Figure 5 and can be termed FEDHS-GC–2D/3D GC–SCD/NCD/MS. The column combination used was a non-polar DB-1 in the stand alone 1D GC, and a polar DB-Wax and a medium polar DB-225 column (Agilent Technologies) ([50% cyanopropylphenyl]-polydimethylsiloxane) in the 1D/2D (2D/3D) system. For this analysis, the same FEDHS method was used as mentioned previously in the yoghurt and green tea analyses.31
Figure 9: 1D FID chromatogram, 2D TIC, and 2D SCD/NCD chromatograms obtained by FEDHS-GC-2D/3D GC-SCD/NCD/MS for a tobacco smoke sample: (a) 1D FID chromatogram; (b) 2D TIC; (c) 2D SCD chromatogram, and (c) 2D NCD chromatogram. S1 = methional, S2 = 3-ethyl thiophene, 2,3-dimethyl thiophene, S3 = 2,4-dimethyl thiazole, S4 = vinyl thiophene, 2-ethyl thiazole, and S5 = dimethyl sulphoxide.

Figure 9 demonstrates a 1D FID chromatogram, a 2D TIC, a 2D SCD chromatogram, and a 2D NCD chromatogram obtained from the single heart-cut of the 1D LRI of 880–900. Although more than 30 sulphur peaks were detected in the 2D SCD chromatogram (Figure 9[c]), only methional (S1) was identified with the combined search using the MS library and the LRI database. Therefore, we performed sequential second heart-cuts to transfer the selected sulphur peaks (S2–S5) for 3D GC separation.
Figure 10: 2D/3D TIC and 2D/3D SCD/NCD chromatograms obtained by FEDHS-GC-2D/3D GC-SCD/NCD/MS for a tobacco smoke sample: (a) 2D/3D TIC, (b) 2D/3D SCD chromatograms, and (c) 2D/3D NCD chromatograms. S3 = 2,4-dimethyl thiazole.

Figure 10 illustrates an example of the second heart-cut of the S3 peak (in Figure 9[c]) and both 2D and 3D TIC (Figure 10[a]), SCD/NCD chromatograms (Figure 10[b] and 10[c]). After heart-cutting, the heart-cut fraction was cryo-focused at -100 °C during the rest of the 2D GC run, including the cool-down time. At the RT 44 min, the 2D LTM–GC column was cooled down to 40 °C, and the cryogenic trap was rapidly heated to start 3D GC. The sulphur peak (S3) was clearly detected with all three detectors (MS, SCD, and NCD) in the 3D separation. Using "2D LRI" of 1288 (DB-Wax), the LRI database, the MS library search of the mass spectrum obtained in the 3D TIC, and elemental information (S and N), the S3 peak was positively identified as 2,4-dimethylthiazole. In addition, 5 sulphur compounds were identified from the second heart-cuts of three sulphur peaks (S2, S4, and S5), containing 3-ethyl thiophene, 2,3-dimethyl thiophene, vinyl thiophene, 2-ethyl thiazole, and dimethyl sulphoxide.
Conclusions
Classical 2D GC with heart-cutting is continually making significant strides in terms of flexibility, applicability, and software-driven ease of access. Systems can be assembled for coupled 1D and 2D investigations without the need for intermediate instrumental reconfigurations. Multiple detectors, including human olfactory perception, can be incorporated into the various cycles to offer powerful capability for investigation and detection of flavour and environmental compounds.
A possible disadvantage compared to "on-the-fly" comprehensive GC×GC could be longer analysis times resulting from multiple heart-cut cycles, but in our opinion this is more than compensated for by the accessible information content of the resulting data. In fact, technological advances are continually narrowing perceived differences between both approaches and will lead towards a more unified approach to multidimensional separation in the future.
References
1. W. Bertsch, J. High Resolut. Chromatogr. 22, 647–665 (1999).
2. P.J. Marriot, P.D. Morrison, R.A. Shellie, M.S. Dunn, E. Sari, and D. Ryan, LCGC Europe 16, 23 (2003).
3. D.R. Deans, Chromatographia 18, (2003).
4. G. Schmburg, F. Weeke, F. Mueller, and M. Oreans, Chromatographia 16, 87–91 (1982).
5. S. Nitz, H. Kollmannsberger, and F. Drawert, J. Chromatogr. 471, 173 (1989).
6. L. Tunistra, W.A. Traag, A.J. Van Munsteren, and V. Van Hesse, J. Chromatogr A 395, 307 (1987).
7. R.van Ingen, L.M. Nijssen, F. van den Berg, and H. Maarse, J. High Resolut. Chromatogr. 10, 151 (1987).
8. D.W. Wright, K.O. Mahler, L.B Ballard, and E. Dawes, J. Chromatogr Sci. 24, 13–17 (1986).
9. L.L. Lamparski, T.J. Nestrick, D. Janson, and G. Wilson, Chemosphere 20, 635–645 (1990).
10. K. MacNamara, R. Leardi, and A. Hoffmann, LCGC North America 22(2), 166 (2003).
11. A. Hoffmann, R. Bremer, and J.A. Rijks, Proceedings of the 15th International Symposium on Capillary Chromatography, Riva del Garda 830–836 (1993).
12. L. Mondello, A. Casilli, P.Q. Tranchida, M. Furukawa, K. Komori, K. Miseki, P. Dugo, and G. Dugo, J. Chromatogr A 1105, 11 (2006).
13. L. Mondello, A.Casilli, P.Q. Tranchida, D. Sciarrone, P. Dugo, and G. Dugo, LCGC Europe 21, 130–137 (2008).
14. B.D. Quimby, J.D. McCurry, and W.M. Norman, LCGC The Peak, (2007).
15. R. Mustacich, J. Everson, and J. Richards, Am. Lab. 27, 38–41 (2003).
16. J. Luong, R. Gras, G.Yang, H. Cortes, and R. Mustacich, J. Sep. Sci. 31, 3385 (2008).
17. N. Ochiai, K. Sasamoto, and H. Kanda, United States Patent 8119983 (2012).
18. GERSTEL K.K., European Patent 2110663, 2010.
19. N. Ochiai, K. Sasamoto, H. Kanda, Japan Patent 4533940 (2010).
20. K. Sasamoto and N. Ochiai, J. Chromatogr A, 1217, 2903–2910 (2010).
21. N. Ochiai, K. Sasamoto, and K. MacNamara, J. Chromatogr. A. 1207, 296–304 (2012).
22. C. Devos, N. Ochiai, K. Sasamoto, P. Sandra, and F. David, J. Chromatogr. A. 1255, 207 (2012).
24. S. Nitz, F. Drawert, M. Albrecht, and U. Gellert, J. High Resolut. Chromatogr. Chromatogr. Commun. 11, 322 (1988).
25. S. Nitz, H. Kollmannsberger, M. Albrecht, and F. Drawert, J. Chromatogr. 547, 516 (1991).
26. B.M. Gordon, M.S. Uhring, M.F. Borgerding, H.L. Chung, W.M. Coleman III, J.F. Elder Jr., J.A. Giles, D.S. Moore, C.E. Rix, and E.L. White, J. Chromatogr. Sci. 26, 174 (1988).
27. C. Ziegler, K. MacNamara, Z. Wang, and A. Robbat Jr., J. Chromatogr. A.1205, 109–116 (2008).
28. Y. Yoshimura, N.Ochiai, K. Sasamoto, K. Mitsui, H. Kanda, N. Higashi, F. David, and P. Sandra, Abstracts of CORESTA Congress 2012, SSPT28 (2012), Sapporo.
29. R. Marsili Ed., Flavor, Fragrance, and Odor Analysis (Marcel Dekker, New York, USA, 2002).
30. M. Markelov and J.P. Guzowski Jr., Anal. Chim. Acta 276, 235 (1993).
31. N. Ochiai, K. Sasamoto, A. Hoffmann, and K. Okanoya, J. Chromatogr. A 1240, 59 (2012).
32. A. Ott, L.B. Fay, and A. Chaintreau, J. Agric. Food Chem 45(3), 850 (1997).
33. K. Kumazawa and H. Masuda, J. Agric. Food Chem. 47, 5169 (1999).
34. A. Rodgman, T. Perfetti, in: A. Rodgman, T. Perfetti, Eds., The Chemical Components of Tobacco and Tobacco Smoke (second edition, CRC Press, 2013) p.1007.
Kevin MacNamara, PhD, was Principle Scientist at Irish Distillers where he established a high profile centre for distilled spirits research. Recently retired, he has published extensively and remains semi-active in this field.
Nobuo Ochiai, PhD, is a Technical Director at GERSTEL K.K., Japan. He is author or co-authors of many journal papers and book chapters mainly on sample preparation/introduction technologies and multi-dimensional GC–MS.
Kikuo Sasamoto is a Technical Support Manager at GERSTEL K.K., Japan. He is author or co-author of various journal papers mainly on sample preparation/introduction technologies and multi-dimensional GC–MS.
Kazuhisa Mitsui is a Research Scientist at Tobacco Science Research Center, Japan Tobacco Inc., Japan.
Yuta Yoshimura, PhD, is a Research Scientist at Tobacco Science Research Center, Japan Tobacco Inc., Japan.
E-mail: kevindmacnamara@gmail.com
Website: www.gerstel.com/
This article is from The Column. The full issue can be found here: http://www.chromatographyonline.com/vol-10-no-17-column-september-18-2014-europe-and-asia-pdf

Polysorbate Quantification and Degradation Analysis via LC and Charged Aerosol Detection
April 9th 2025Scientists from ThermoFisher Scientific published a review article in the Journal of Chromatography A that provided an overview of HPLC analysis using charged aerosol detection can help with polysorbate quantification.
Analyzing Vitamin K1 Levels in Vegetables Eaten by Warfarin Patients Using HPLC UV–vis
April 9th 2025Research conducted by the Universitas Padjadjaran (Sumedang, Indonesia) focused on the measurement of vitamin K1 in various vegetables (specifically lettuce, cabbage, napa cabbage, and spinach) that were ingested by patients using warfarin. High performance liquid chromatography (HPLC) equipped with an ultraviolet detector set at 245 nm was used as the analytical technique.
Removing Double-Stranded RNA Impurities Using Chromatography
April 8th 2025Researchers from Agency for Science, Technology and Research in Singapore recently published a review article exploring how chromatography can be used to remove double-stranded RNA impurities during mRNA therapeutics production.


