Modern Supercritical Fluid Chromatography — Possibilities and Pitfalls
LCGC North America
There has been a revival of supercritical fluid chromatography (SFC) in recent years, especially in the chiral preparative field, but also more recently in the analytical area. However, SFC is considerably more complex than liquid chromatography (LC), mainly because of the compressibility of the mobile phase. One can say that SFC is a "rubber variant" of LC where everything considered constant in LC varies in SFC. In this review, we go through advances in theory, instrumentation, and novel applications.
There has been a revival of supercritical fluid chromatography (SFC) in recent years, especially in the chiral preparative field, but also more recently in the analytical area. However, SFC is considerably more complex than liquid chromatography (LC), mainly because of the compressibility of the mobile phase. One can say that SFC is a "rubber variant" of LC where everything considered constant in LC varies in SFC. In this review, we go through advances in theory, instrumentation, and novel applications.
Recently, both instrumental manufacturers and the pharmaceutical industry have increased their interest in supercritical fluid chromatography (SFC) because of the lower environmental impact and the considerably shorter separation times compared to traditional high performance liquid chromatography (HPLC). The use of low-viscosity carbon dioxide as the main solvent enables operation at higher flow rates as compared to liquid chromatography (LC) (1), and the low toxicity of this mobile phase and its ease of recycling have created another important incentive. Even though the SFC revival has focused on preparative chiral separations (2), it has also been successfully used in many achiral applications. However, LC still dominates analytical applications because of its versatility and so far its superior robustness compared to SFC. If the reproducibility of modern SFC could be considerably improved, we believe its revival would be strongly boosted.
The inherent problem with SFC that makes it so much more complex than LC is the compressibility of the mobile phase, which makes SFC a "rubber variant of LC." Everything considered as constant in LC is not constant in SFC (3,4). This ultimately results in radial and axial density and temperature gradients in the column that affect the thermodynamics of adsorption and cause a volumetric flow rate gradient through the column (5–7). The practical consequences are serious. We cannot be guaranteed that the set operational conditions reflect the true conditions over the columns like we can in LC. This results in poor system-to-system reproducibility and transfer between analytical methods, which in turn hampers the wider use of SFC in the pharmaceutical industry. These phenomena also result in poor predictions in scaling up from analytical SFC instruments to preparative SFC instruments (8). The consequence is that optimization in process- and preparative-scale SFC must be done in the large scale, which costs money and energy and may even be impossible in some cases. Therefore, a proper understanding of how operational parameters such as pressure, temperature, and solvent composition affect the separation and its reproducibility is of paramount importance.
In this brief investigation, with both new and review material, we start out with some illustrative examples of poor method transfer among different analytical systems. Thereafter, we report on recent investigations on which experimental parameters are the most important to improve reproducibility and method of transfer in SFC. Some guidelines to users and some advice for improvements to manufacturers is also provided.
Results and Discussion
Examples of Poor Reproducibility Between Systems
First, the reproducibility between different SFC systems was studied by injecting 20 µL (full-loop) of 350 g/L antipyrine solution on four different SFC systems using identical instrumental settings and the same column (see Figure 1). Liquid carbon dioxide was supplied to systems 1, 3, and 4 (AGA Gas AB, Sweden) and system 2 was fed gaseous carbon dioxide. The same 150 mm × 4.6 mm Kromasil silica column, packed with 5-µm nominal particle size, 100-Å pore size media (AkzoNobel Eka) was used for all systems. The back pressure (P) was 150 bar, the column temperature was 35 °C, and the eluent composition was 85:15 (v/v) carbon dioxide–methanol. All experiments were carried out at volumetric flow of 2 mL/min.
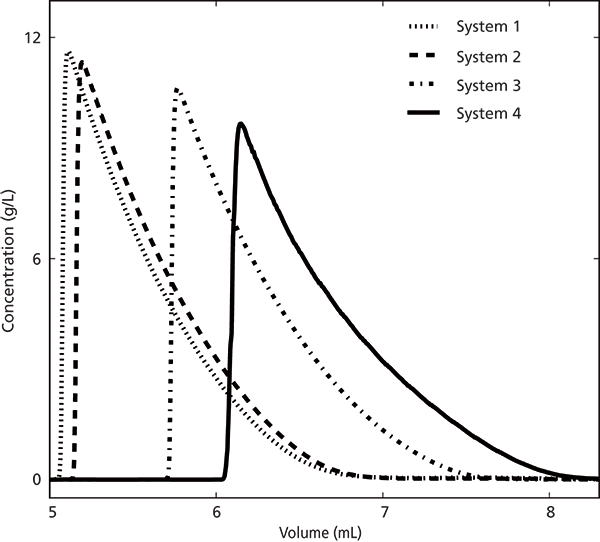
Figure 1: Experimental chromatograms recorded on the various SFC systems. The set volumetric flow was 2 mL/min and the injection volume was 20 µL of a 350-g/L sample.
The resulting overloaded elution profiles, corrected for system void volumes, is clearly system dependent as can be seen in Figure 1. This figure also shows that the elution volume is larger on system 4 while systems 1 and 2 have lower, and similar, retention volumes. However, system 3 (same instrument model as system 1) had a retention volume that was more than 0.5 mL larger than that of system 1 when using the same column and the same set conditions. This observation indicates that either the set conditions are not manifested in the systems or that the operational column conditions were different, although identical set values were used. We further investigated if the volumetric flow rate was the reason for the observed difference between the elution profiles shown in Figure 1, but the column dead volume was determined and was estimated to be approximately 1.9 mL on each system. This observation means that the volumetric flow rate was more or less identical on all systems; otherwise the void volumes would have been different.
Other important parameters governing retention are the density of the mobile phase, the fraction of organic modifier (CM), and the column temperature (T). The density is a nonlinear function of pressure (P) and temperature; to calculate the density of the carbon dioxide and methanol stream inside the column, the pressure at the column inlet and outlet as well as the actual column temperature must be known. An immediate conclusion was that none of the systems measure pressure directly before or after the column, only at a point upstream from the column. Furthermore, this pressure reading cannot simply be correlated between different systems because the pressure drop upstream to the back-pressure regulator will be divided between capillaries and column. Pressure drop from the capillaries will depend on their length and diameter, which cannot be assumed to be identical between the different systems. So the reason for the problem is probably due to the fact that in SFC - in contrast to LC - the set operational values are not necessarily identical with the actual operational values.
Deeper Investigation of the Causes of the Poor Reproducibility Between Systems
Initial Experiments
We used a design-of-experiment (DoE)-based approach (9) to find out the most important parameters affecting the reproducibility of retention for different neutral model compounds in this system and similar ones. In DoE, the effects of variations of operational parameters on a certain response, such as retention factors or selectivity in chromatography, are statistically investigated under controlled experiments. For this particular study, we had to find out the real temperature, pressures, and the cosolvent fractions inside the column. Thus, we used external devices to measure the real mass flows over the column and external sensors for measuring temperature and pressure at different positions along the column (5).
Before the DoE-based experiments and modeling, we investigated experimentally how retention volumes are affected by changes in system back pressure and modifier content (10). Analytical injections of 5 µL of 0.350-g/L antipyrine solutions were performed at back pressures of 140–160 bar and modifier fractions of 14–16%, on system 1 (see Figure 2). As seen in Figure 2, the retention volume was strongly affected by changes in the modifier concentration and to a smaller extent to the "set" back pressure. When performing the system reproducibility experiments described in the previous section, we noticed that system 4 had a much lower pressure drop compared to systems 1 and 2. This sensitivity and back pressure difference between systems probably explains the observed differences in retention volumes mentioned earlier.
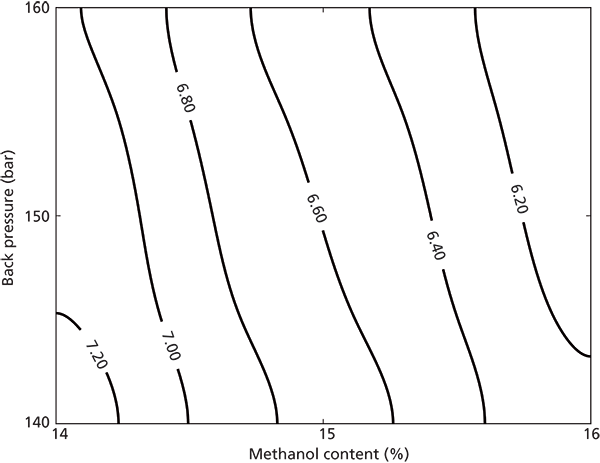
Figure 2: Retention volume of analytical peaks as a function of methanol content and pressure determined using 14, 14.5, 15, 15.5, and 16 (v/v) % methanol content at 140, 145, 150, 155, and 160 bar on system 1. All analytical injections were 5 µL of a 0.35-g/L sample.
Design of Experimental-Based Investigation
We used DoE to investigate the impact on retention by cosolvent, pressure, and temperature in the column (9). These three factors and their interactions were studied for two different solutes. The coefficients of the second order polynomial were estimated by least squares regression. The regression model for each response was evaluated with analysis of variance (ANOVA). The model was refined by first removing statistical outliers and then removing any statistically insignificant terms from the polynomial at a 95% confidence level.
To study the dependency and variation of common chromatographic parameters such as retention factors, selectivity, and productivity with parameters such as amount of cosolvent, temperature, and pressure, the true parameter values in the chromatographic column must be used rather than the values set on the instrument. The true values were determined by using external measurements of pressure, temperature, and mass flow. To verify the set volumetric flow rate, the corresponding density of the mobile phase fluid was calculated using the Kunz and Wagner equation of state as implemented by the National Institute of Standards and Technologies in a database software used in science research (11). Interestingly, the deviation between the set and estimated volumetric flow rate, temperature, and pressure was found to be relatively small for most experimental conditions used.
Parameters of Importance for Retention Factors
Before a successful method development can be performed in SFC, it is essential to have knowledge about and to be able to predict how the retention factor is affected by a certain change of the operating parameters (that is, the variables). The centered and normalized coefficients for the retention factor models are presented in Figure 3. Here the test solutes studied were trans-stilbene oxide (TSO) and 1,1'-bi-2-naphthol (BINOL). In particular, Figure 3 shows the impact of different operation parameters on the retention factors for the first and second enantiomer of TSO and BIONOL. The height of positive or negative bar in the plot shows the relative degree of impact of the corresponding operational parameter. The operational parameters are denoted in the x-axis: pressure (P), methanol fraction (CM), and column temperature (T); significant values of the quadratic and more complex term on the x axis indicate nonlinear dependencies. In Figure 3, it is clear that the volumetric CM was the most important parameter, which is represented by the largest coefficient value for methanol. The methanol fraction also had a large quadratic term (C2M), meaning that the methanol dependence is not linear. Pressure was the second most important factor for the retention factor, and the retention factors all have similar pressure dependencies with a slight nonlinearity (see Figure 3). In Figure 3, it can also be seen that the interaction terms are all significant, that is, the coefficients of the interaction terms are shown to be significant. These interaction terms would be missed if one factor at a time were varied. Interestingly, the effect of temperature in the investigated region was low for both components enantiomers, however, slightly larger for BINOL (see Figure 3).
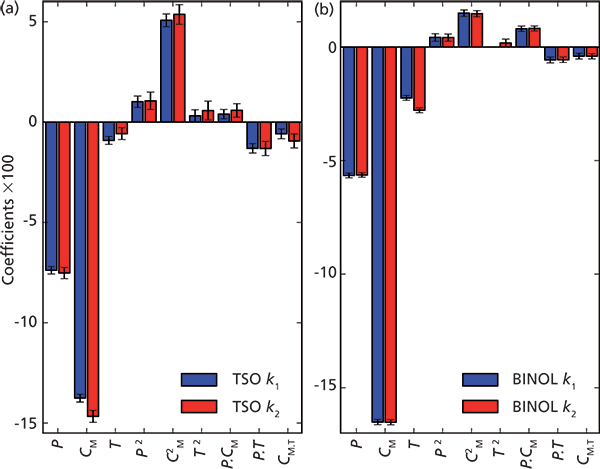
Figure 3: Centered and normalized coefficients from the model fit for the first and second retention factor, respectively, for (a) TSO and (b) BINOL. The error bars represent the 95% confidence interval of the coefficients. The height of a negative or positive bar in the plot shows the relative degree of impact of corresponding parameter. Adapted with permission from reference 9.
Figure 4 contains contour plots illustrating the combined dependency of the retention factors on methanol fraction and pressure for TSO and BINOL, respectively, at the fixed column temperature 30 °C. For both enantiomers of both components, we can see that the larger the methanol fraction and the larger the pressure the lower (more blue color) the retention factors (see Figure 4). The highest values of the retention factors are obtained for the second enantiomer (for both TSO and BINOL) at combined low methanol fractions and low pressures (deeply red color). It is evident that the retention factors for both solutes have similar trends when studied in the methanol–pressure plane, despite the different density variations seen between the experimental conditions for TSO and BINOL.
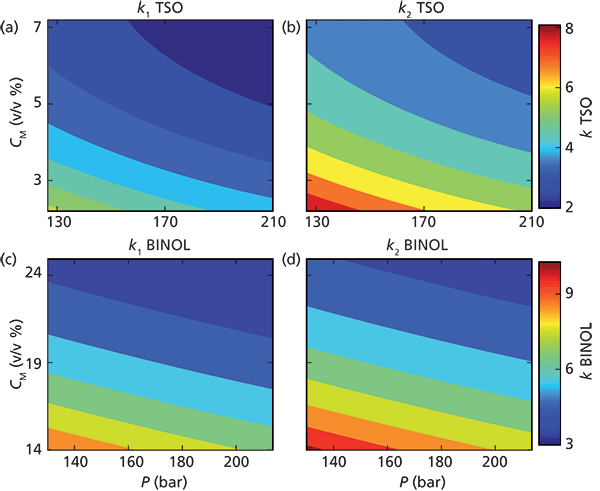
Figure 4: Contour plots showing the retention factor (k) as a function of pressure and amount of methanol in the eluent: (a) k1 for TSO, (b) k2 for TSO, (c) k1 BINOL, and (d) k2 BINOL. Adapted with permission from reference 9.
Parameters of Importance for Productivity
In preparative chromatography, it is important to purify the desired components at the desired purity and for maximum productivity (that is, the amount of purified product per unit time). In a separation of the enantiomers of a racemate, the first step is to find suitable separation systems. This is achieved by screening combinations of chiral stationary phases (CSPs) and cosolvents. Typically, selectivity is maximized while k´ is minimized. Loading studies utilizing maximum sample concentration on suitable candidate systems can then be performed. In this study, the dependency and variation of productivity on cosolvent, pressure, and temperature was studied. Either of the enantiomers of TSO was selected as target. The optimal chromatogram was chosen to maximize injection volume while maintaining touching-band separation (that is, having a yield of 100%). The productivity was calculated by assuming that stacked injections could be performed for the separation of either enantiomer of TSO at 30 °C, 160 bar, and 5% methanol. The trends in productivity were very clear and analysis of parameter importance revealed that the most important factor to increase productivity was to increase the fraction of cosolvent followed by an increase of temperature (see Figure 5a). Therefore, by simultaneously increasing methanol content and temperature, the productivity in this case could be efficiently maximized as can be seen in Figure 5b. By decreasing pressure, the productivity could be further increased but only marginally (data not shown). It should be noted that a complete optimization also would entail further work on the volumetric flow or concentration of the sample, but that was beyond the scope of this study. Interestingly, the selectivity for the separation of TSO increases with decreasing methanol content. Hence, in this case, maximizing selectivity will yield lower productivity.
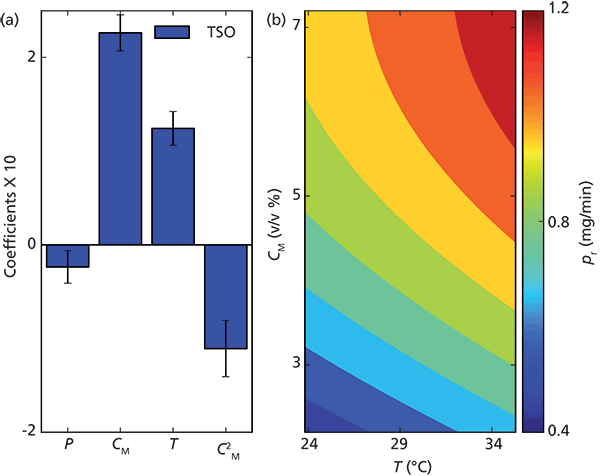
Figure 5: Centered and normalized coefficients with 95% confidence interval from the model fit to the productivity for the optimum touching-band chiral separation of TSO is plotted. In (b) the productivity is plotted as a function of amount of modifier in the eluent and the temperature. Adapted with permission from reference 9.
Conclusions
This study shows that SFC is a complicated chromatographic method and that the same instrumental set conditions do not necessarily give the same actual working conditions over the column on different systems for a variety of reasons. Recorded elution profiles for the model compound antipyrine injected onto the same silica column on three different systems at the same set conditions were clearly different. This means that it can be hard to transfer an established separation method from one system to another, even if one is using the same column and identical instrument settings. This method transfer difficulty has implications both for analytical methods and preparative applications. For example, different separation methods are usually screened on an analytical instrument and then the selected method is transferred to a larger preparative system. A design of experimental approach was used to study the impact of a change of the most common operational parameters using neutral model compounds on mostly chiral systems. The model systems presented here - except for antipyrine separated with a silica column - consisted of racemic mixtures of TSO and BINOL were separated using a chiral cellulose-derivative silica-based column. All input parameters were carefully measured using external sensors. The parameters investigated were column temperature, pressure, and cosolvent fraction. The methanol fraction was the most important factor for governing the retention factors, and the pressure was the second most important factor. On the other hand, the temperature did not have a significant effect on the retention factor. Increasing either the temperature or the pressure resulted in reductions of the retention factors. Although not reported here, this result was also obtained with another chiral system studied (racemic 1-phenyl-1-propanol as an analytical model compound) (10).
For preparative purification of either enantiomer of TSO, the most important parameters were found to be methanol content and temperature. The selectivity for the separation of TSO increases with decreasing methanol content. Therefore, in this case, maximization of the selectivity will yield lower productivity. As in most forms of chromatography, compromises must also be made in SFC.
References
(1) G. Guiochon and A. Tarafder, J. Chromatogr. A. 1218, 1037–1114 (2011).
(2) A. Rajendran, J. Chromatogr. A. 1250, 227–249 (2012).
(3) A. Tarafder, K. Kaczmarski, D.P. Poe, and G. Guiochon, J. Chromatogr. A.1258, 136–151 (2012).
(4) K. Kaczmarski, D.P. Poe, and G. Guiochon, J. Chromatogr. A 1218, 6531–6539 (2011).
(5) M. Enmark, P. Forssén, J. Samuelsson, and T. Fornstedt, J. Chromatogr. A 1312, 124–133 (2013).
(6) F. Kamarei, F. Gritti, and G. Guiochon, J. Chromatogr. A 1306, 89–96 (2013).
(7) M. Enmark, J. Samuelsson, E. Forss, P. Forssén, and T. Fornstedt, J. Chromatogr. A 1354, 129–138 (2014).
(8) A. Tarafder, C. Hudalla, P. Iraneta, and K.J. Fountain, J. Chromatogr. A 1362, 278–293 (2014).
(9) D. Åsberg, M. Enmark, J. Samuelsson, and T. Fornstedt, J. Chromatogr. A 1374, 254–260 (2014).
(10) M. Enmark, D. Åsberg, J. Samuelsson, and T. Fornstedt, Chrom. Today 7, 14–17 (2014).
(11) E.W. Lemmon, M.L. Huber, and M.O. McLinden, NIST Standard Reference Database 23: Reference Fluid Thermodynamic and Transport Properties-REFPROP, Version 9.1, (National Institute of Standards and Technology, Standard Reference Data Program, Gaithersburg, Maryland, 2013).
Torgny Fornstedt is a professor in analytical chemistry and heads the internationally competitive Fundamental Separation Science Group (www.separationscience.se) at Karlstad University. The group develops and applies numerical tools to characterize, validate, and optimize analytical and preparative separation methods and has recently turned toward supercritical fluid chromatography.

Torgny Fornstedt
Ronald E. Majors is the editor of "Column Watch," an analytical consultant, and a member of LCGC's editorial advisory board. Direct correspondence about this column to lcgcedit@lcgcmag.com

Ronald E. Majors

New Study Reviews Chromatography Methods for Flavonoid Analysis
April 21st 2025Flavonoids are widely used metabolites that carry out various functions in different industries, such as food and cosmetics. Detecting, separating, and quantifying them in fruit species can be a complicated process.

.png&w=3840&q=75)

.png&w=3840&q=75)


.png&w=3840&q=75)


.png&w=3840&q=75)


